|
|
||||||||||
|
.
|
GROUP 4 PROJECT- 2009
|
|||||||||
|
Connor Scheu and Wouter Zwart
Race Rocks Tidal Turbine Generator
Background: Connor communicated with Russ Stothers of Clean Current for his project; "Here is a simple synopsis of the project I will be doing this week. It is called a group four project (which pertains to the experimental science department here at the college), and the theme for everyones project is resource allocation/sustainability. Every student has to decide upon a project in which they will research something in this area. This usually involves the identification of a question, and then variables, presented in a lab format and accompanied by a presentation, but not overly formal. |
|
So basically what I would require for my project is some simple data, on the energy output of the generator, hopefully in relation to the tidal currents. From this I hope to create a simple relationship, proportional or not, which will help me identify the output and efficiency as current varies. This would satisfy the lab component of my project. The next component I would pursue would be the application of this knowledge. Simply from the results of the data and correlation I hope to receive, I would apply some simple reasoning to determine how effective or feasible such technology would be in other circumstances. That is, different magnitudes, in size and tidal extremes. An example of this would be; if the generator receives pique efficiency at the lowest speeds, then the technology would be more widely applicable to more general locations in the world, as opposed to selective areas of high tidal motion. Or if the energy benefits of higher speeds outweigh the selectivity of the projects.
This may be a rather ambitious goal, however this is a less formal project than others at the college (the extended essay is a full research paper) and as such it is OK to have lofty goals and then only achieve some of them in the allotted time. However I am sure that with your help I will be fully capable of receiving satisfactory results. So I guess what I am asking of you would be the data I have previously outlined, in addition to the answering of some basic questions on the running of the turbine (included below this message). This help would be most appreciated, I think it would be highly beneficial for the students of the college to have a little more information on the nature of this project. As it is so unique in design, important to global issues, and close to home. This is what my project will allow, as I will be presenting my findings to the student body towards the end of the week. I am very grateful for your generosity and aid thank you again Connor Scheu Here are some of the questions which I have identified as what I think I need to know. But please feel free to include any relevant knowledge that you think would help. I am still quite unfamiliar with the project, and as such my questions may be a little vague. Also feel free to not answer any questions if they breach any kind of protocol or patent information.
Procedure: Experimentation performed by Clean Current and its employees Data:
|
|||||||||
|
|
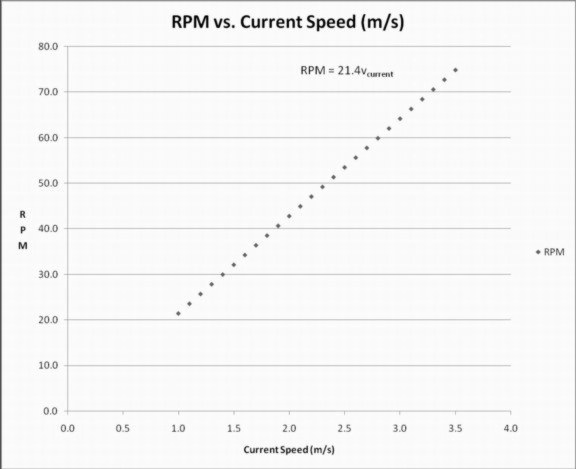
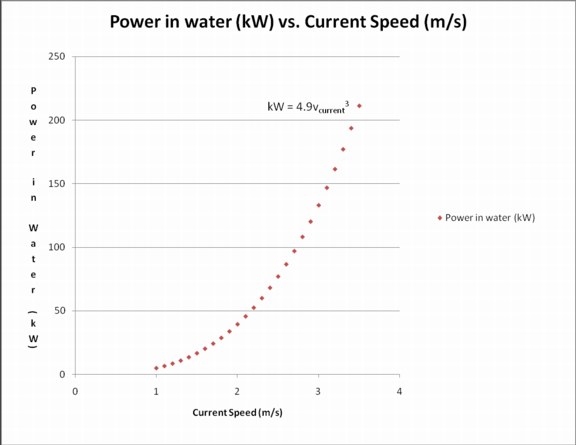
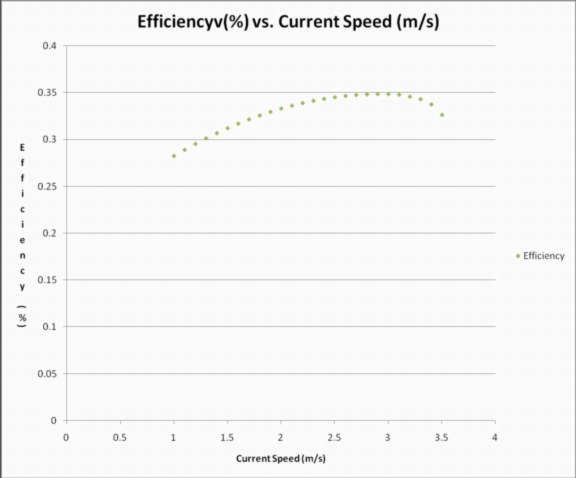
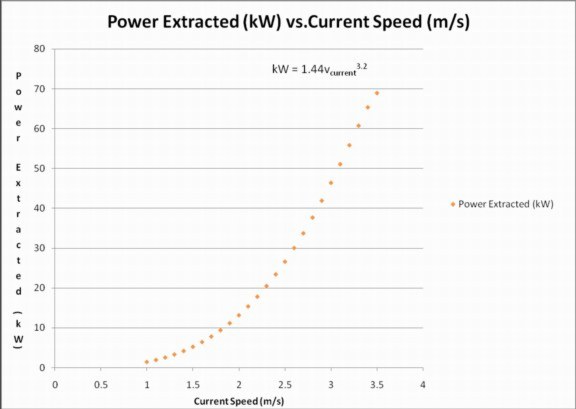
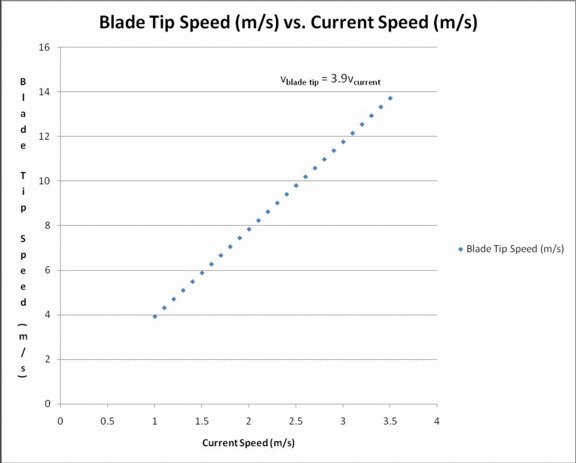
| These graphs are representative of the data presented in the table. They indicate the relationship between rate of current flow in meters per second to a variety of other variables (Blade Speed, RPM, Theoretical Energy, Efficiency, and Produced Energy). |
 |
|
This graph shows how there is a perfectly linear relationship between the current speed, and the rotational speed of the blade tips. This is self evident as it is in fact the current that drives this motion. It is notable however that there is virtually no impact from friction or other environmental forces. There is a uniform constant (value 3.9) which relates blade tip speed to current speed for this model of generator.
This graph shoes much the same relationship as the first graph, albeit with a different constant. This is simply because the blade speed has a direct relationship with the revolutions per minute. This value is dependent on the diameter of the turbine, and thus the length of the blades.
This graph shows the relationship between the theoretical value of the power in the water, and the current speed. This value is derived from the formula: P = Cp x 0.5 x ρ x A x V3 Where: Cp is the turbine coefficient of performance P = the power generated (in watts) ρ = the density of the water (seawater is 1024 kg/m3) A = the sweep area of the turbine (in m2) V3 = the velocity of the flow cubed (i.e. V x V x V)
This graph shows the relationship between the overall efficiency of the turbine, and the rate of current flow. This is derived from dividing the actual power produced by the theoretical power produced. It can be seen that as current flow reaches its upper limits, the device begins to rapidly lose efficiency. This has implications on the applicability of this product. The peak efficiency is 2.76 m/s, found as follows: The estimated equation for the slope of the graph is -0.0215x2 + 0.1187x + 0.1829 using a graphing program.
The derivation of this line is: -0.043x + 0.1187
When this equals zero, the slope is zero, which is the point of greatest efficiency (maximum point)
This is 2.76 m/s, the power received at this point is 35.5 kW
This graph displays the actual values for energy produced, when compared to current flow. It can be viewed as a combination of the efficiency and ideal power graphs. This knowledge is integral to understanding the ideal speed. It can be clearly seen that the relation is quite exponential, with higher speeds yielding much greater results. However it is also known that the efficiency curve takes a greater role at roughly the end of the data, an extension of this graph would show an eventual plateau. Using this knowledge we can conclude that the ideal current speed for this turbine is somewhere in the region of 3.5 m/s. Analysis/Conclusion:
From the data we have developed a very clear and meaningful relationship between the rate of current flow, and various aspects of the turbine generator on Race Rocks. We have noted that there is a perfectly linear relationship between current speed and the speeds of the blade tips, as well as the RPM of the turbine itself. We have shown that there is an exponential increase in theoretical power contained in the water and current flow, as well as the exponential decrease in efficiency as these values increase. Finally we have shown the actual relationship between current speed and energy output, which can be viewed as a compilation of the efficiency and theoretical power graphs. This data is incredibly usefulin the analysis of this device, and its applicability. The point where the most energy is obtained most efficiently has great impacts on how the technology is used. From our data it is clear that this point is towards the upper range of the current flow, about 3.5 m/s. For after this point the efficiency of the system decreases dramatically. Before this point, the exponential increase in energy produced makes the efficiency loss acceptable. Further Connections:
I have learned that the average energy output for this turbine for one day is 300kWh, which equates to an average energy production of approximately 12.5 kW. This information may be applied to any power consumption grid, in order to determine the feasibility of using these turbines on a larger scale. One house at Pearson College uses approximately 600 kWh of energy per day. Using this data, it is possible to conclude that two of these generators could provide enough power for one house. That is power for forty-two individuals, provided entirely by the sea; perfectly green, completely sustainable, and 100% predictable energy. It should also be considered that this device is still a prototype, and is constantly being refined to the point where it may be commercialized and applied on a larger scale. |
| Return to the Student Research File |
 |
 |
Sitemap | Contact |
webmaster:
Garry Fletcher |
Copyright |
