Second Interim Report: Environmental Monitoring at Race Rocks Ecological Reserve related to the Tidal Power Project.

Summary the environmental monitoring tasks completed Aug 1to Jan 13, 2006. by staff of Archipelago Marine Research Ltd.

  • three site visits to document biotic features along the cable route
  • preparation and remote monitoring by remote cameras of racerocks.com
  • direct communication with PC staff and drilling staff regarding the imagery  and specimen ID.
  • observation of upland activities between the boathouse and battery room were made during the last visit in November.

See the Complete 11 page PDF : archipelinterimreportJan200

Telmessus cheiragonus:Helmet Crab-The Race Rocks Taxonomy

helmet crab

Telmessus cheiragonus


helmetventral

Telmessus cheiragonus, the helmet crab, ventral inage

Domain: Eukarya
Kingdom: Animalia
Phylum: Arthropoda
Class: Crustacea
Order: Decapoda
Family: Cheiragonidae
Genus Telmessus
Species cheiragonus
Common Name: Helmet crab

helmet3

Telmessus cheiragonus, Helmet crab photos by G. Fletcher

This crab shows up frequently when we are diving at Race Rocks

Other Members of the Phylum Arthropoda at Race Rocks.

taxonomyiconReturn to the Race Rocks Taxonomy
and Image File
pearsonlogo2_f2The Race Rocks taxonomy is a collaborative venture originally started with the Biology and Environmental Systems students of Lester Pearson College UWC. It now also has contributions added by Faculty, Staff, Volunteers and Observers on the remote control webcams.  G. Fletcher


Zostera marina: eel grass–The Race Rocks taxonomy

This true sea grass, is not an algae, but a flowering plant. It does have a close relative, the other sea grass Phyllospadix scouleri which does live at Race Rocks. We have included it here because it often ends up on the small pocket beach areas as drift along marine algae and logs. So technically its energy is imported into the Race Rocks Ecosystem with the help of storms. It actually grows in shallow offshore areas in a sand sediment bottom. The closest to Race Rocks is around Bentinck Island and in Emdyck Passage

Asexual Reproduction: In the photos you can see that it grows on a sediment substrate and has creeping roots or rhizomes just below the surface. They serve as its main method of propagation. It also can produce seeds from small inconspicuous flowers. A bed of this grass may be closely related genetically as it is joined by a network of these rhizomes underground.

Domain Eukarya
Kingdom: Plantae
Clade: Tracheophytes
Clade: Angiosperms
Clade: Monocots
Order: Alismatales
Family: Zosteraceae
Genus: Zostera
Species: marina
Common Name: Eel Grass


Other Members of the Angiosperms at Race Rocks 
taxonomyiconReturn to the Race Rocks Taxonomy
and Image File
pearsonlogo2_f2The Race Rocks taxonomy is a collaborative venture originally started with the Biology and Environmental Systems students of Lester Pearson College UWC. It now also has contributions added by Faculty, Staff, Volunteers and Observers on the remote control webcams.

 name –year (PC)

Solaster stimpsoni: Stripped Sun Star–The Race Rocks Taxonomy

This is a frame taken from the video beside. The blue color is because white light does penetrate to a depth of 8 metres, so only the parts of the picture that are illuminated from the video light show the true colors.. Note in the video how objects appear to change color when illuminated, but, they don’t actually do so. In the foreground is a broooding anemone , red with a band of babies at its girth. The pink coral is hydrocoral.

“Invertebrates at Race Rocks” is an introductory piece on a few of the invertebrate phyla. This was one of the first hinted streaming videos done by the Pearson College divers in April 2000. There is a good section on Soalaster Stimpsoni in the film. It was taken by Rowena and Shamsher on a Sony Digital camera, and edited by Hannah and Garry on a G4 Macintosh Computer using iMovie.


Physical Description
It has 8-12 arms, but usually it has 10 arms, which has length is about 23 cm. The diameter about 20 inches (51 cm). And the central disc about &Mac185; of total diameter. It&Mac226;s mouth just below the central disc. And, as the common sea star, it uses its tube feet which under main arms to move.

Global Distribution
This kind of sea star could be found at Bering Sea to Salt Point California (Trinidad Head, Sonoma Country, Kodiak Island and Oregon) and Pacific Northwest (Sunrise Beach and Gig Harbor).

Physical Description
It has 8-12 arms, but usually it has 10 arms, which has length is about 23 cm. The diameter about 20 inches (51 cm). And, as the common sea star, it uses its tube feet which under main arms to move.

Habitat
This sea star is possible to find at rocky bottoms but sometimes in sand or in the lowest zone.
Domain Eukarya
Kingdom Animalia
Phylum Echinodermata
Class Asteroida
Order Spinulosida
Suborder Eugnathina
Family Solasteridae
Genus Solaster
Species stimpsoni
Common Name: Stripped Sun Star, Sun Star, Stimpson’s
Feeding
This animal is a carnivore. It usually feed at sea cucumbers (the most favorite foods), tunicates, lampshells, sea pens, brachiopods, holothurians, sea squirts and nudibranch.

Predator
The predator of this animal is Sunflower Star ( Solaster dawsoni).

Reproduction
It reproduces sexually. It is breeding from February to March. Gametes are discharge into water. The eggs then become larvae and start to metamorphosis for about 40-50 days.

Interesting Thing
It can curl its arms up over its body to take on a spherical shape. This allows it to tumble across the seafloor in the along-shore currents.

References
Alaska Fisheries Science Center, Sun Sea Star Solaster Stimpsoni. Internet
British Columbia Creature Page. Internet
Edmonds Discovery Programs. Internet
Gotshall Daniel (1994) Guide To Marine Invertebrates. California
King Country (1999) Sun Star &Mac246; Solaster Stimpsoni. Internet
Lambert Philip (1965) Sea Star. Vancouver, Canada
Morris Robert, Donald A & Eugene H (1980) Interditial Invertebrates of California. California
Photo Gallery. Internet
Strathmann Megumi (1987) Reproduction And Development of Marine Invertebrates of The Northern Pacific Coast. Friday Harbour Laboratory
Verrill (1880) Solaster Stimpsoni. Internet
Yates Steve (1988) Marine Wildlife. Washington


Other Members of the Phylum Echinodermata at Race Rocks
taxonomyiconReturn to the Race Rocks Taxonomy

and Image File

pearsonlogo2_f2The Race Rocks taxonomy is a collaborative venture originally started with the Biology and Environmental Systems students of Lester Pearson College UWC. It now also has contributions added by Faculty, Staff, Volunteers and Observers on the remote control webcams.

January 2006 Winda (PC year 32)

Daily Air Temperature Data -1998-2005: Race Rocks Ecological Reserve


I am working at restoring the following links which were removed when Telus dropped a server unexpectedly which we had been using at racerocks.com .. If you wish to access this data before i get the links updated ,you may contact me at email :garryf  then use the at sign gmail dot com

October 1984 to February 1997 daily weather records submitted to Environment Canada Meteorological Service by the light keepers at Race Rocks.

Be sure to do a Customized Search for
“Race Rocks Lightstation” to find this archive.

I think previous records exist so I am trying to get them from the Canadian Meteorlogical Service.

AIR DATA, JANUARY 1998
(missing first three months)

AIR DATA, FEBRUARY 1998

AIR DATA, MARCH 1998


>AIR DATA, APRIL 1998AIR DATA, MAY 1998

AIR DATA, JUNE 1998

AIR DATA, JULY, 1998

AIR DATA, AUGUST, 1998

AIR DATA SEPTEMBER, 1998

AIR DATA OCTOBER, 1998

AIR DATA NOVEMBER, 1998

AIR DATA DECEMBER, 1998


AIR DATA, JANUARY 1999

AIR DATA, FEBRUARY 1999

AIR DATA, MARCH 1999

AIR DATA, APRIL 1999

AIR DATA, MAY 1999

AIR DATA, JUNE 1999

AIR DATA, JULY, 1999

AIR DATA, AUGUST, 1999

AIR DATA SEPTEMBER, 1999

AIR DATA OCTOBER, 1999

AIR DATA NOVEMBER, 1999

AIR DATA DECEMBER, 1999


AIR DATA, JANUARY 2000

AIR DATA, FEBRUARY 2000

AIR DATA, MARCH 2000

AIR DATA, APRIL 2000

AIR DATA, MAY 2000

AIR DATA, JUNE 2000

AIR DATA, JULY, 2000

AIR DATA, AUGUST, 2000

AIR DATA SEPTEMBER, 2000

AIR DATA OCTOBER, 2000

AIR DATA NOVEMBER, 2000

AIR DATA DECEMBER, 2000


AIR DATA, JANUARY 2001

AIR DATA, FEBRUARY 2001

AIR DATA, MARCH 2001

AIR DATA, APRIL 2001

AIR DATA, MAY 2001

AIR DATA, JUNE 2001

AIR DATA, JULY, 2001

AIR DATA, AUGUST, 2001

AIR DATA SEPTEMBER, 2001

AIR DATA OCTOBER, 2001

AIR DATA NOVEMBER, 2001

AIR DATA DECEMBER, 2001


AIR DATA JANUARY, 2002

AIR DATA FEBRUARY, 2002

AIR DATA MARCH, 2002

AIR DATA APRIL, 2002

AIR DATA MAY, 2002

AIR DATA JUNE, 2002

AIR DATA JULY, 2002

AIR DATA AUGUST , 2002

AIR DATA SEPTEMBER , 2002

AIR DATA OCTOBER, 2002

AIR DATA NOVEMBER, 2002

AIR DATA DECEMBER, 2002


AIR DATA JANUARY, 2003

AIR DATA FEBRUARY, 2003

AIR DATA MARCH, 2003

AIR DATA APRIL, 2003

AIR DATA MAY, 2003

AIR DATA JUNE, 2003

AIR DATA JULY, 2003

AIR DATA AUGUST, 2003

AIR DATA SEPTEMBER, 2003

AIR DATA OCTOBER, 2003

AIR DATA NOVEMBER, 2003

AIR DATA DECEMBER, 2003


AIR DATA JANUARY, 2004

AIR DATA FEBRUARY, 2004

AIR DATA MARCH, 2004

AIR DATA APRIL, 2004

AIR DATA MAY, 2004

AIR DATA JUNE, 2004

AIR DATA JULY, 2004

AIR DATA AUGUST , 2004

AIR DATA SEPTEMBER , 2004

AIR DATA OCTOBER, 2004

AIR DATA NOVEMBER, 2004

AIR DATA DECEMBER, 2004


AIR DATA JANUARY, 2005

AIR DATA FEBRUARY, 2005

AIR DATA MARCH, 2005

AIR DATA APRIL, 2005

AIR DATA MAY, 2005

AIR DATA JUNE, 2005

AIR DATA JULY, 2005

AIR DATA AUGUST , 2005

AIR DATA SEPTEMBER, 2005

AIR DATA OCTOBER, 2005

AIR DATA NOVEMBER, 2005

AIR DATA DECEMBER, 2005


From January 2006 on, refer to the air temperature files from the Davis Weather Instrument.

Archived Data for this page has been produced in the EXCEL Files by Mike Slater. It was then converted and saved as html by Garry Fletcher and students of the racerocks.com activity


The Ethology Assignment

BACKGROUND:


Ethology, the study of natural animal behaviour, seeks to understand behaviour as it relates to the animal’s adaptive strategies, reproductive strategies, and energy requirements. Ethologists spend long hours making field observations, often under inhospitable conditions. These observations may be supplemented by experiments performed either in the field or in the laboratory.

In this lab, you get an idea of what ethological research is like by using the procedures of scientists in the field, yet making your observations over a much shorter time period by means of the remote-controlled cameras at Race Rocks. northernsealionbehav

You will be observing the behaviour of an animal species at the Race Rocks Marine Ecological Reserve. One advantage of using the real-time video available at racerocks.com is that you (the observer) have no impact on the animal’s behaviour. This is an ideal way to gather ethological data, as this science, by definition, involves the analysis of natural behaviour.
You will be collecting data for one of the time periods designated by your teacher. This is a mini- version of this lab which still gives you experience in doing a study using the techniques of the Ethologist. Since the remote cameras allow a two minute time per user, which may be renewed if no one else is on line, you may do several two minute periods. An actual in depth study, where you can actually go to the island, would involve at least two 1-hour periods .
OBJECTIVES:
a) Conduct a study of animal behavior using the techniques of an ethologist.
b) Analyze the relationship between animal behaviors and meteorological events.
for Race Rocks.

Materials
The following materials are needed
o Pen and paper
o Watch with a second hand. (absolutely required for compiling a time budget)

PROCEDURE:
1. Preliminary Observations: Work in pairs for his exercise. Spend a few minutes observing the animal you have chosen for the study before you start the actual study. You may decide to make observations at the same time each day for a number of days. Why do you think you should collect data at the same time of day? Why should data be collected from the same time of year?
2.Collecting data
You will be presenting the data in two forms: as an ethogram, and also as a time budget.
An ethogram is a qualitative list of the behaviours observed, whereas a time budget is a quantitative table that gives the percentage of time the animal spends engaged in each form of behaviour. The ethogram should be prepared prior to the time budget. This lab involves observation and analysis only. No experiments will be conducted. You should establish a predetermined period for observation of a given individual (i.e. 1 minute, 5 minutes) when preparing a time budget. Once you have decided how long to observe one subject, stick to this time period. It will be tempting to shift to the individual that is most active at any given time, but this practice would skew the resulting time budget in the direction of that behaviour. If the animal you are observing leaves the area (i.e. dives below the surface) before the prescribed observation time is up, just make a note of it and move to another individual of the same species.
3.. You may be able to tell male from female, and juvenile from adult of the species you are observing. If so, you ought to decide if you are going to observe a single category (i.e. adult males only), or if you are going to split your observation time between the groups. The Dichotomous key could help with this.
4.. Compiling the ethogram
The data collected from your 1st observation period will be used to compile an ethogram.
An animal’s behaviour may be described considering only the physical activity (i.e. diving into ocean), or as an action with a specified function (i.e. hunting for food). In your observations, you will continually be presented with the dilemma of deciding which type of description to use. The simple physical description is more objective, and therefore less likely to be incorrect. The functional description is more informative, but more likely to be incorrect because it requires interpretation on the part of the observer. You will use both types of description in your final ethogram. In your evaluation, indicate which functional descriptions you are confident of (i.e. due to anecdotal information gathered from a qualified source, information on the species gathered from the literature, or common sense), and those which of which you are less.
The ethogram should be hierarchical in presentation. Broad categories of behaviour (i.e. searching for food) will be broken down into subcategories (i.e. exploring the environment), which may then be broken down further (i.e. smelling).
Some of the classes of animal behaviour that you ought to monitor include:
o Searching for/acquiring/consuming food
o Social interaction (i.e. aggressive, reproductive)
o Evading (avoiding/escaping from) predators
o Activities contributing to individual well-being (i.e. preening, urinating, defecating, behavioural thermoregulation)
o Monitoring the environment
o Resting/doing nothing (Keep in mind that the subject may be quietly monitoring the environment, avoiding predators, thermoregulating, etc.)
When you have collected all data that will contribute to the ethogram, devise a coding system of behavioural classes displayed by the species you observed. This organization will help greatly when you gather data for the time budget.
5. The data collected during your 2nd observation period will be used to compile a time budget. To acquire this data, start the clock at the beginning of your observation period. Then write down the time each new behaviour begins and the code for that behaviour (from your ethogram). Your activity level during this period will, of course, depend upon the level of activity of your animal subject. If you see a behaviour that was not listed in your ethogram, take note and include it in the evaluation section of your lab write-up.
When your 2nd observation period is over, add up all the time the animal(s) spent engaged in each particular activity. This data, converted to percentage values (of the total time observed), forms your time budget. Unfortunately, the time budget loses some of the information contained in your raw data (i.e. sequence of behaviours, individual-to-individual variation in behaviour). You may want to elaborate on some of these specifics in the evaluation section of your write-up.
A sample time budget follows:

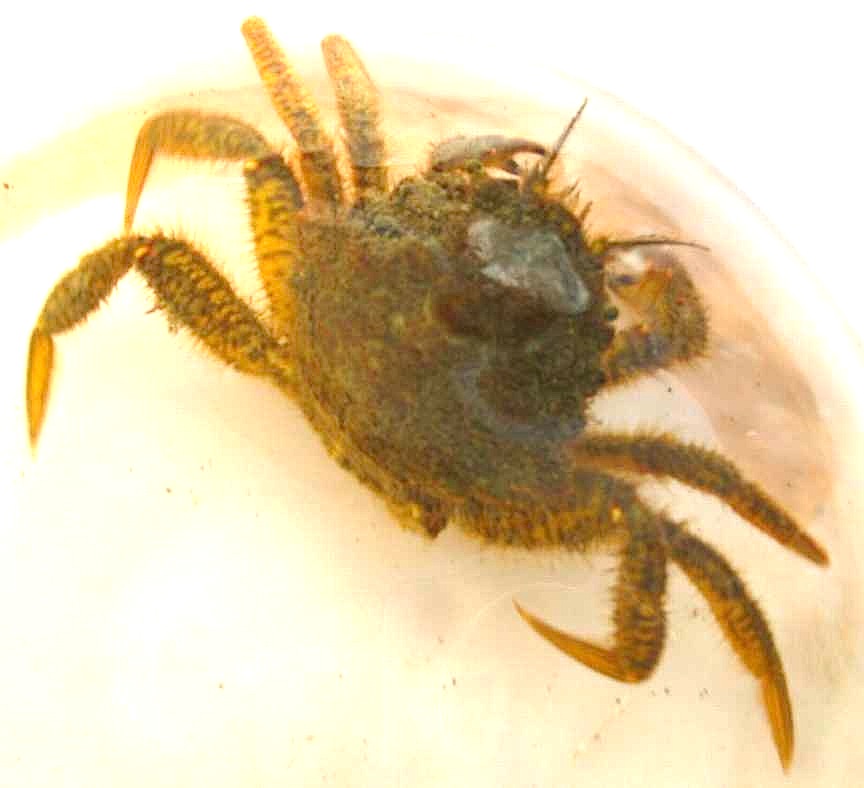
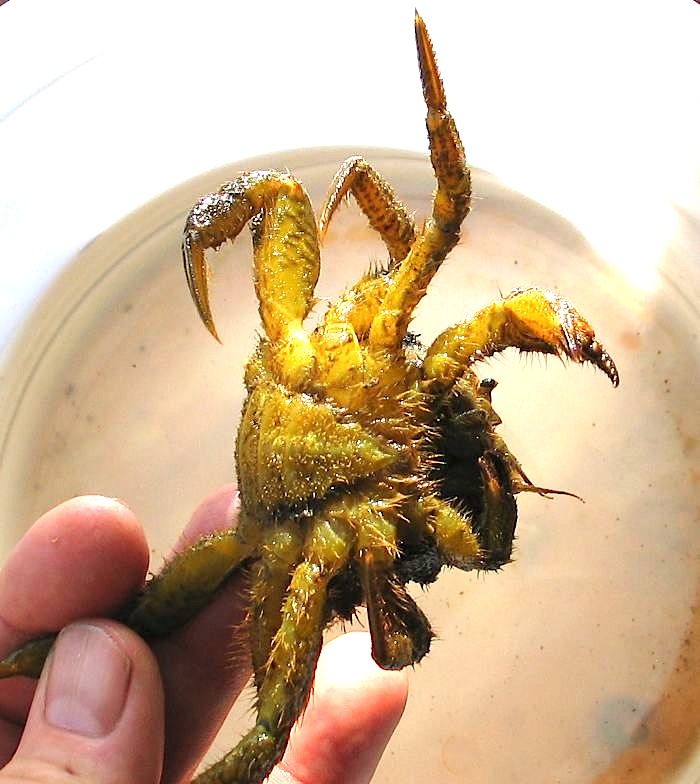
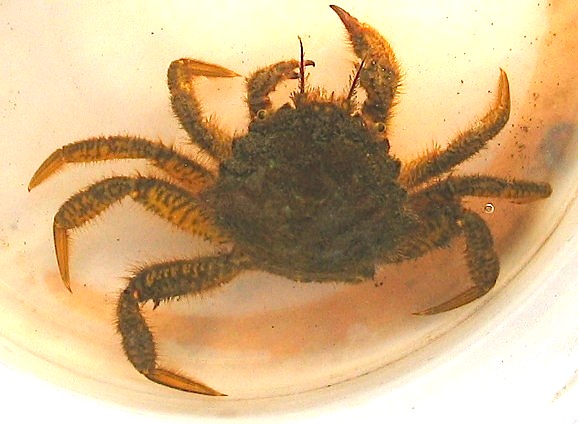
Table 1. Time budget of Shield-backed Kelp Crab (Pugettia producta)
Adult juvenile
Number of 5 min. observation periods 6 6
Number of individuals observed 3 2
Total minutes of observation 30 30
% time acquiring food 28.5 17.0
% time avoiding predators 21.1 36.3
% time monitoring environment 40.2 31.8
% time in social interaction (aggressive) 10.2 14.9

6. Submit your results . You will identify the species observed and provide a detailed description of the animal’s habitat. Location of the study site ( latitude, longitude), time of day and date, and weather conditions should also be given. Include a picture of your graphical data that you obtain from the study. You should also include a picture of the animal under study, by doing a screen capture.

Table 1: A Sample Ethogram.

Note: Most descriptions are physical (i.e. “listening”), but they have been interpreted by the observer as contributing to the quest for food. The more inclusive categories of behaviour may be given codes (i.e. “01-B”) for use in compiling a time budget. If an activity occurs too rapidly to be accurately timed, it may appear on the ethogram without a code.

Part of a sample ethogram follows:
Searching for food (01)
Exploring ground environment (01-A)
Standing upright
Visual survey
Smelling
Listening
Moving
Rapidly in a straight line
Slowly, on a meandering course
Digging (01-B)
Forepaws
Hindlegs
Snout

Link to a sample write up of the longer version of this lab done by a student.This may give you an idea of how you may present your data in graphical form. This can be done in EXCEL


Report
Use the literature (library books, reputable internet sites) when writing your report. Many questions asked here might already have been answered in previous studies, and should be compared with your results.
The following questions should be considered in your evaluation:
1. What are some advantages/disadvantages of your method of recording data?
2. What improvements in this procedure would allow for more accurate recording of data?
3. What environmental information is relevant to the animal’s behaviour?
4. How might loss of animals before the end of the predetermined observation period affect the time budget?
5. Is it difficult to classify behavioural activities into broad categories?
6. How representative do you think your data are for describing the species?
7. How do your data relate to the energy requirements of the species?
8. Do your data shed any light on the adaptive stratagy of the species you selected?7. Extension material: For further inquiry: Later, in your evaluation of the data, you will consider the potential effects of the physical context (i.e. temperature, wind, precipitation) on the animal’s behaviour.oystercatchersealloungegull territoryeagleatgullfeed

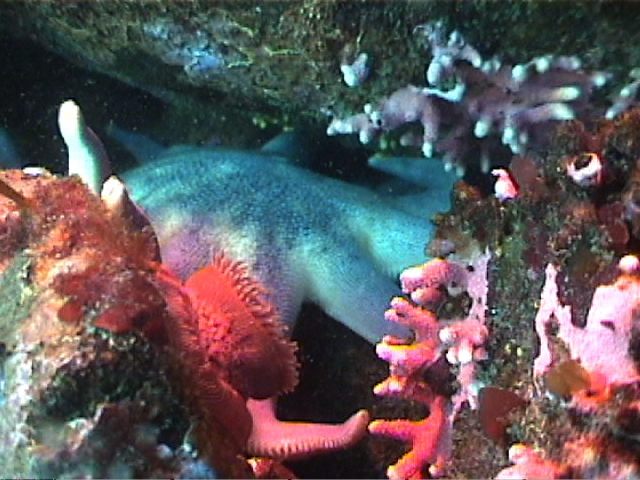
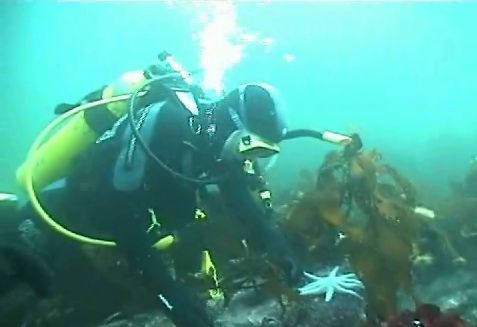
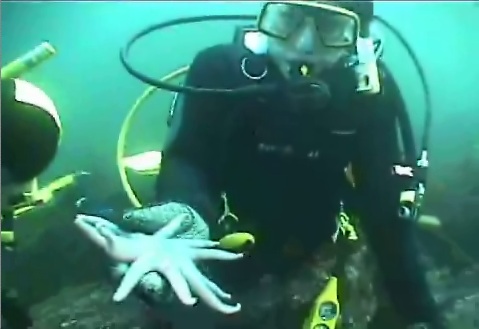
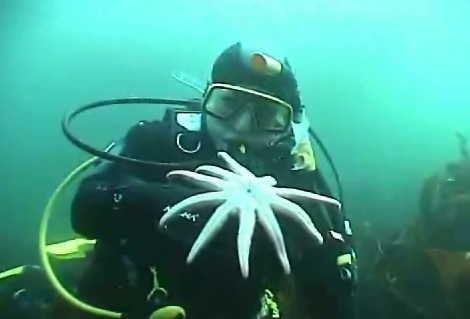
Above are some archived videos which may be used for a practice run or instead of live viewing. There are other behavioral videos of vertebrates and invertebrates in the racerocks.com video archives.