Questions on whether or not there are correlations in nature between two or more observed events can often be an idea for interesting investigations. Here are some examples:
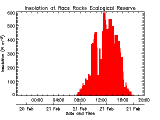
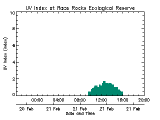
Solar radiation and UV levels
- Solar radiation in a day
- uv radiation in a day
- In graphs aboveof a sunny day in late February both UV and Solar show a rise at the same time of day .. However check at other times of the year in the records at http://www.victoriaweather.ca/station.php?id=72 to answer the question about whether there is always a correlation between these two abiotic factors.
- Temperature and salinity: : examine this graph and see if you can make some conclusions about the correlation between seawater temperature and salinity , or between temperature and any of the other factors shown in the weather station graphs
- Wind speed and barometric pressure : here you might look for examples of negative correlations– in the file from the race rocks weather station http://www.victoriaweather.ca/station.php?compare wind and barometric pressure data,
- Link to the satellite page from the Physical factors page to the satelite page, and on it go to the Weather Model – North Pacific Surface Pressure and Wind website . Track one of the low barometric pressure circles across the Pacific and predict what effect it will have on wind in 6 or 12 hours.. This works especially well in the winter months
- Go to the pages of photographs done by Pam Birley taken on the Race Rocks cameras. Since they are published by the month, look for correlations in her observations . Are all species always seen at the same time of the year, ie does presence correlate with season. See if you can use her pictures to show presence/absence of migratory or resident species and correlate that with seasons.


