CLICK ON IMAGES FOR LARGE SIZED CHARTS
 This file is extracted from a report of the analysis of the data by Rick Birch of ASL from the ADCP Deployment at Site 1.
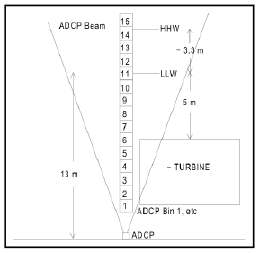
The mooring was deployed on the bottom on may 30 and recovered on June 15, 2005. The ADCP collected current profile data in 1m bins starting from 2.5 metres off the bottom (bin 1).Times were recorded in PDT and directions in degrees magnetic. Directions were converted to degrees true during processing by adding 19 degrees. Water Depth: 13 m (LLW) Location: 48 17,955’N 123 31, 937′ W
Data Quality:
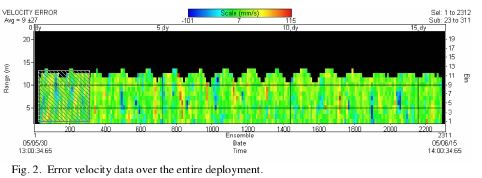
One of the primary indicators of ADCP velocity data quality is the error velocity. This is the difference in computed vertical velocities using different combinations of 3 beams. Error velocities over the deployment were generally less than 5cm/s and never exceeded 12 cm/s (Figure 2).This is generally considered acceptable for such a deployment.
Characteristics of the measured currents:
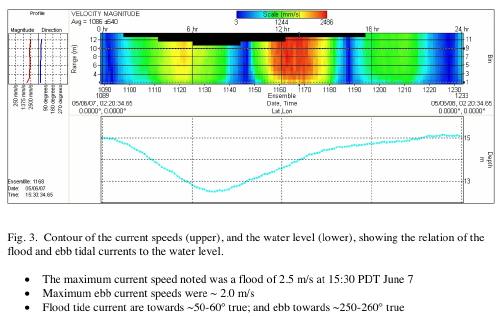
Most of the current is due to tides. Maximum tidal ranges reach 3.3 m during the larger ‘spring’ tides. Tides are mixed, mainly diurnal with one main low and one main high each day. Peak ebb currents occur ~2 hours before the main low tide, and peak flood currents occur~ 4-5 hours after the main low tide (Fig.3). Flood tide currents are generally stronger than the ebb.
Upwelling/Downwelling:
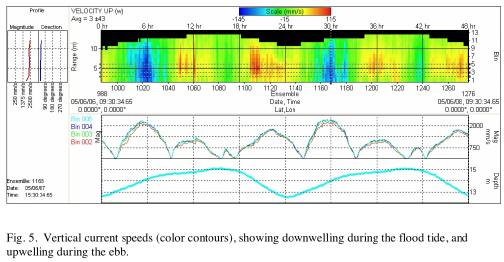
As at site 2, there was upwelling on the ebb flow and downwelling on the flood. Maximum vertical velocities reached about 11 and 15 cm/s respectively (Fig 5)
This probably relates to the shallows just West of the site.
Bin 2-5 Average Current
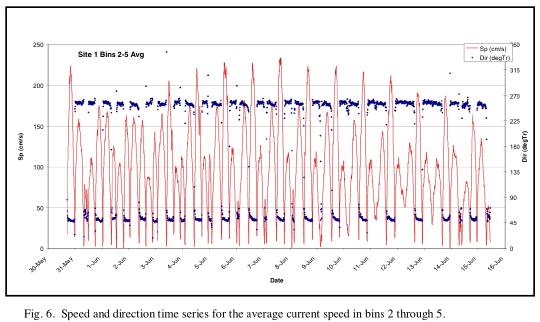
The current velocity data from bins 2-5 were selected as representative of the flow through the turbine and were averaged.
Figure 6 is a plot of the averaged current speeds over the entire record. The average current speeds range up to about 2.3 m/s on the floods , and 1.75 on the ebbs.
Ed.note: Due to these low current levels, site 1 had to be abandoned as a candidate for the tidal current generator location.

