Danish Journal Article on Race Rocks

The Danish language version of this article is published in the Journal “Geografisk Orientering”.2005 NR2 Link to this 2 page .PDF file.

By Søren Pilgaard Kristensen (PC yr 8 1983)
Associate Professor
Institute of Geography University of Copenhagen
Østervoldgade 10 ,1350 Kbh. K,.Denmark

and Garry Fletcher*

Abstract:
Af Gerry Fletcher og Søren P. Kristensen
I Race Rock, et marint naturreservat i havet udfor British Columbia, Canada, er man gået nye veje for at give skoleklasser og andre interesserede adgang til at opleve det isolerede områdes unikke natur. Artiklen beskriver hvorledes Internet, webkameraer og undervisningsprogrammer bringer havets hemmeligheder indenfor i klasselokalerne overalt i Canada, uden at overbelaste det sårbare økosystem. i undervisningen på det nærlig- gende Pearson college, hvor det blev et yndet mål for feltarbej- de og hvor klasseundervisning i biologi også kunne udnytte de unikke muligheder, som stedet rummer. Det unikke økosystem er meget sårbart overfor fiskeri og forurening, og der var behov Undervisning Som nævnt ovenfor, har Race Rocks igennem snart 30 år væ- ret udnyttet til undervisning og forskning. På grund af øernes afsides beliggenhed, der kræver bådtransport og dykkerudrust- ning for at udforske den del af øerne der ligger under havover- ningspakke drejer sig om måling af bakterievækst i ”tidepools” – tidevandsbassiner. Her bruges digitale billeder af bakteriekolo- nier i biologiundervisningen til, at elever kan måle udviklingen i forskellige miljøer. Der følger en grundig instruktion med til både elever og de lærere der benytter

Link to the Danish Language Version of this articledanisharticle

Abstract: Race Rocks, an island archipelago in the South West corner of British Columbia, Canada is an Ecological Reserve and a designated Marine Protected Area. Students and Faculty of Lester B. Pearson College, the community stewards for this park, have developed the website http://www.racerocks.com to provide via the internet, an educational resource on marine ecology using this sensitive ecosystem as a model for other areas around the world.
www.racerocks.com
A Model for Virtual Access to
Ecologically Sensitive Areas

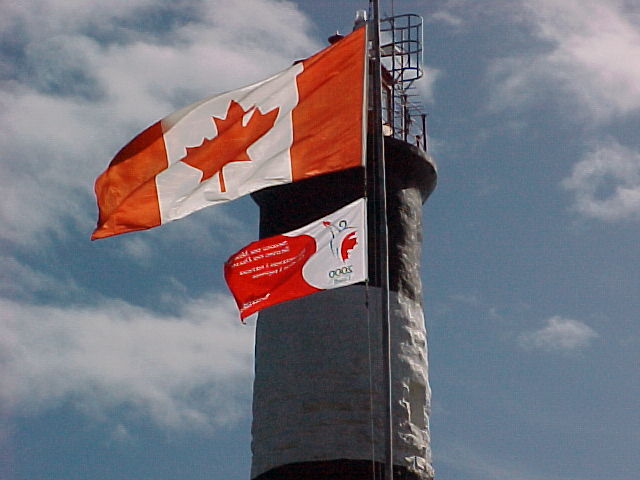
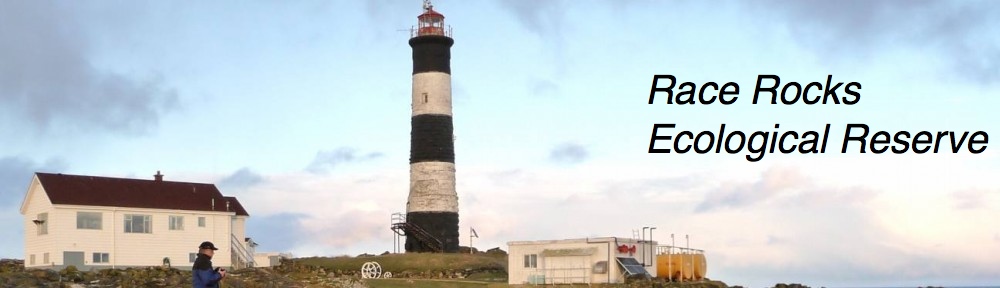
Race Rocks Marine Ecological Reserve and Marine Protected Area protects a significant high-current subtidal and intertidal ecosystem in the Strait of Juan de Fuca at the southern tip of Vancouver Island, Canada. The reserve contains high current underwater reefs with ecologically significant populations of benthic invertebrates and fish. It protects several rare species which represent unique Canadian or North American occurrences. It also provides haul out and feeding areas for elephant seals and sea lions as well as breeding areas for harbour seals and nesting habitat and migrating resting areas for many species of seabirds. It is these characteristics that make it such a unique environment for discovery and education.

Lester Pearson College is a non-profit educational institution, one of the 10 United World Colleges with students on scholarship from over 80 countries. It has assisted in the stewardship of the Race Rocks Ecological Reserve and Marine Protected Area since the late 1970’s and used it as a community outreach program. Students involved in the science and activities programs of the college have had the opportunity to participate in the operation the island as well as the building and operating of the website devoted to providing an educational resource for this unique environment.

In 1980, the students and faculty were instrumental in having the area declared a Provincial Ecological Reserve. In 1997, with the automation of the Light Station, Lester Pearson College took over the Management of the Islands for BC. Parks. In 1998 Race Rocks was chosen as one of five areas on Canada’s shores to become a new Marine Protected Area under Canada’s Oceans Act. Presently awaiting final approval of the local First Nations, it remains one of the most unique areas in Canada’s system of Marine Parks. Details of the process of involving community stakeholders in the Marine Protected Area Process can be found at: http://www.racerocks.com/racerock/admin/admin.htm. In the year 2000, special funding from Canada’s Millennium Fund helped to launch the “racerocks.com project’ with protection of the ecosystem and the wildlife, both above and below the water, as the main guiding principle.

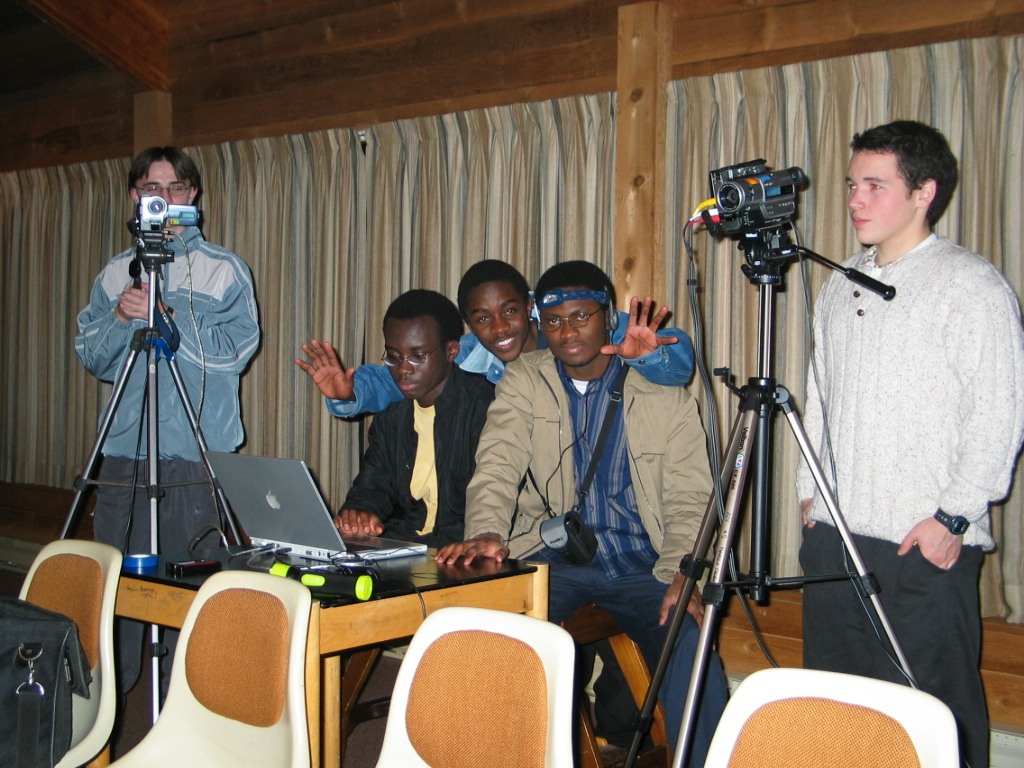
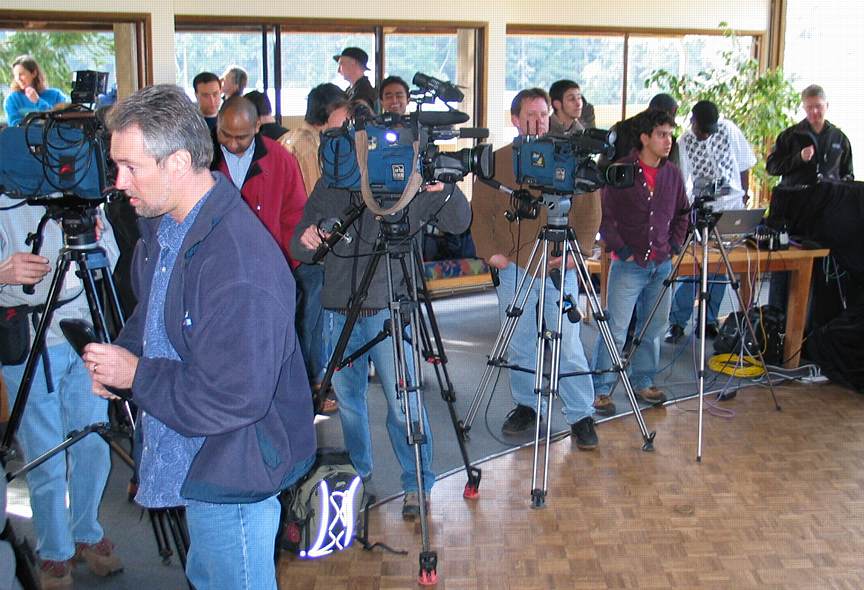
Racerocks.com was conceived as a project to utilize technology and the internet to bring to the educational community access to a sensitive ecosystem. Through the generous support of sponsors and partners, in March 2000, the website http://www.racerocks.com/ went live on the internet. Since that time several cameras have sent live images continuously out on the internet, and the students and faculty of Lester Pearson College have produced a large resource of supportive background materials and archived video. In addition, a portable video camera and webcast channel is available for special event programming both from Pearson College and Race Rocks. The main aim of the program was to provide a virtual website which presents as many aspects as possible of an environmentally sensitive area, allowing investigators to use the resources of the area without contributing to a negative environmental impact. The target audience is wide ranging, from elementary school to university and the general public. Some of the materials presented are interactive, some present curriculum ideas which can be pursed in the classroom, and some challenge others to use the model of this area to instill the values of environmental stewardship in others so that more areas can be protected yet made available virtually to the public. Since we at Pearson College have benefited for so many years from the resources of this special ecosystem, we feel that by making it available to all, we can contribute a great amount to environmental education and research. We welcome feedback from groups and individuals who use our resources.
From the outset we have maintained a commitment to present a non-commercialized site. I have highlighted 10 components of the website below which are particularly well-suited to demonstrate the value of the resource to education at a number of levels. Some are specifically targeted at the Middle School level, and some are appropriate for high school and even introductory level ecology classes at the university level. Of course the site is available freely to everyone with an internet connection. Copyright release available to anyone using the materials for educational purposes. The provision of two robotic cameras provide a level of interactivity unsurpassed in most educational media. If students are given an assignment where they have to quantify behaviours of an animal, and they can do that remotely by manipulating the controls of a camera, then this is a great motivational device for learning.
The following represents some of the curriculum links provided by racerocks.com
1. The Jason Program activity files on Race Rocks:
These files are designed for the Middle School Level. They provide a detailed set of objectives and a teacher information file, as well as assessment methods.
The part of the website in particular has been designed to facilitate easy implementation by the teacher, complete with specific Learner outcomes and assessment procedures. http://www.racerocks.com/racerock/jason/index.html
a. Scavenger Hunt (An introduction to the racerocks.com website)
b. Geology and Geography (Abiotic Characteristics at Race Rocks),
c. Preserving the Past and Present Culture of Race Rocks (The Thirteen Moons),
d. Maintaining our Coastal Ecosystems (An Ethology),
e. The Northern Abalone,
f. Pinnipeds,
g. Conservation,
h. Seascape – Art

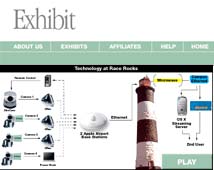
2. The Apple Learning Interchange Files:
The Apple Learning Interchange is providing the distribution network on the internet making it possible for thousands of student connections per week. This exhibit provides one with a glimpse of the educational programs, the technology that makes it possible, as well as ideas to help use our resources in the classroom.
http://ali.apple.com/cgi-bin/WebObjects/ALIView.woa/wa/DisplayExhibit?SiteCode=ali&ExhibitID=1000007  (link now removed)

3. The Race Rocks Taxonomy:
This class assignment allows students in environmental systems and biology to prepare a taxonomy of a species from the Race Rocks area and link to it educational videos and pictures of the species in their habitats at Race Rocks. This provides a useful activity where students can accomplish a number of objectives while contributing a permanent “digital legacy” to help in making this site an enriched educational resource.
http://www.racerocks.com/racerock/eco/taxalab/taxonomy.htm
We have also linked to this exercise a template to encourage other schools to use a similar approach for recognition and conservation of biodiversity in their own local ecosystems. http://www.racerocks.com/racerock/eco/newecosystem/genusfolder/studentemplate.html

4. The “Adopt an Ecosystem” project:
Environmental Education involving science students at undergraduate levels in direct action is the goal of our program at Pearson College. We have found that the production by students of internet materials on environmental issues is a vehicle for doing this effectively. This is a tool, which provides incentive for environmental understanding and encouragement of an “adopting an ecosystem” attitude that can have important consequences in education. The emphasis is on “action” and seeking methods to enable collaboration with others to help solve environmental problems. Students at Lester B. Pearson College have been learning about environmental issues by producing materials for the internet, a “Digital Legacy”. In this way, their education has the added advantage of serving as a resource for others in the educational system in British Columbia and around the world. It also allows them to participate in facilitating collaborative efforts in environmental research.
http://www.racerocks.com/racerock/eco/adopt/adopteco.htm

5. Race Rocks as a Resource for a Statistics exercise.
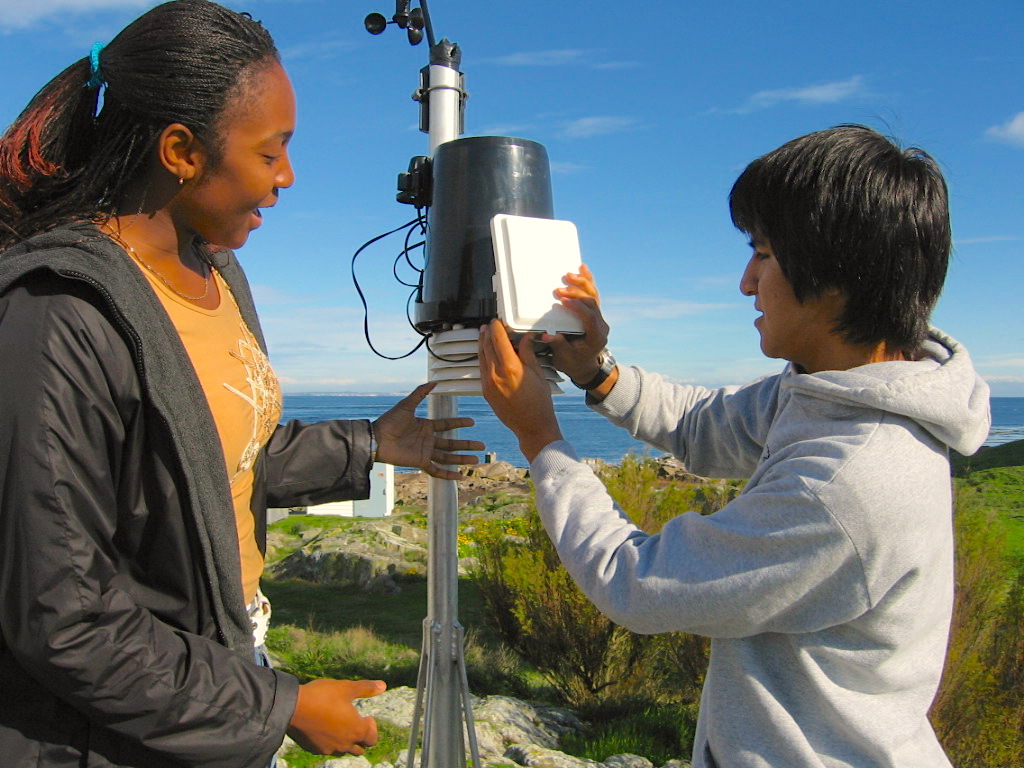
The purpose of this file is to enable a student to transfer Environmental Data being recorded at Race Rocks from a spreadsheet presented on the internet to their own computer in order to be able to graph trends and analyze relationships. Long-term databases are very important for monitoring change in ecosystems. Patterns of cyclic activity and even events such as Climate Change can be detected from the Race Rocks Data.
http://www.racerocks.com/racerock/education/curricula/ibbiology/labairseatemp.htm

6. Links to Race Rocks Resources for the BC Grade 11 Curriculum:
Selected Biology Prescribed Learning Outcomes are taken from the B.C.Ministry of Education K-12 Curriculum and Learning . The Outcomes which are related to Race Rocks are presented on this page with racerocks.com links
http://www.racerocks.com/racerock/education/curricula/bc11bio/bc11bio.htm

7. IB Biology and Environmental Systems Ecology Resource.
The objectives of the International Baccalaureate program for secondary students are linked to appropriate activities and resources in these files.
http://www.racerocks.com/racerock/education/curricula/ibbiology/bioecol.htm

http://www.racerocks.com/racerock/education/curricula/ibensy/ibensy.htm

8. The Animal Behaviour studies:
This file is intended for Secondary school students. It provides ideas for taking the live images on the cameras and for doing a scientific study of the complexities of animal behaviour.
http://www.racerocks.com/racerock/education/ethology/ethology.htm
9. The Ecological Niche and The Transect File:
These two files demonstrate useful ecological quantification techniques and allow an interactive format for the students to study this aspect of ecology. They further provide a model for doing similar studies in ones own ecosystem.
http://www.racerocks.com/racerock/transect/econiche/econiche.htm and
http://www.racerocks.com/racerock/transect/transrrk.htm

10. Race Rocks as a Facility for Graduate-Level Research:
Dr. Gitai Yahel is currently doing post-doctorate research at the University of Victoria. He has worked with us in doing in situ research on the Trophic Dynamics of the Invertebrate Community at Race Rocks. This video and a link to an explanation of his work is a useful example of the type of non-consumptive research that can be done in an underwater marine reserve. Other outside researchers are presently being supported by the college in the areas of tidal current energy and Invertebrate taxonomy.

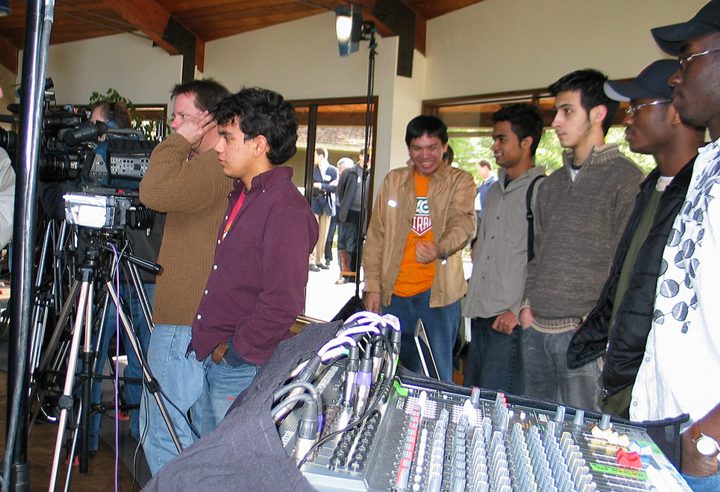
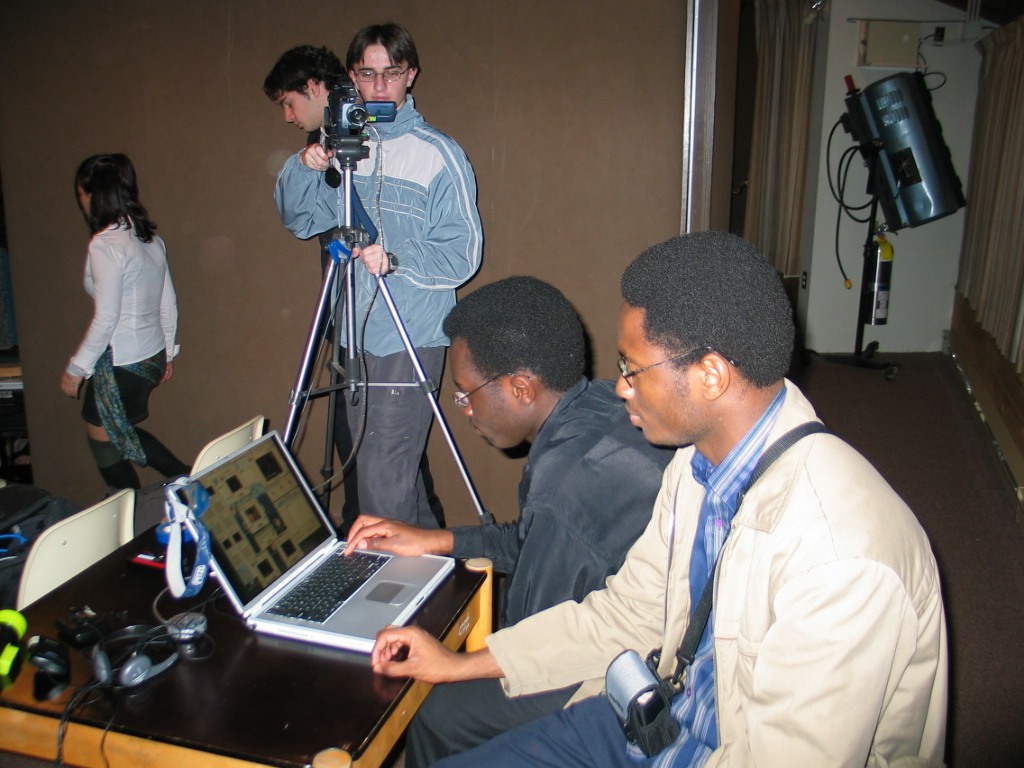
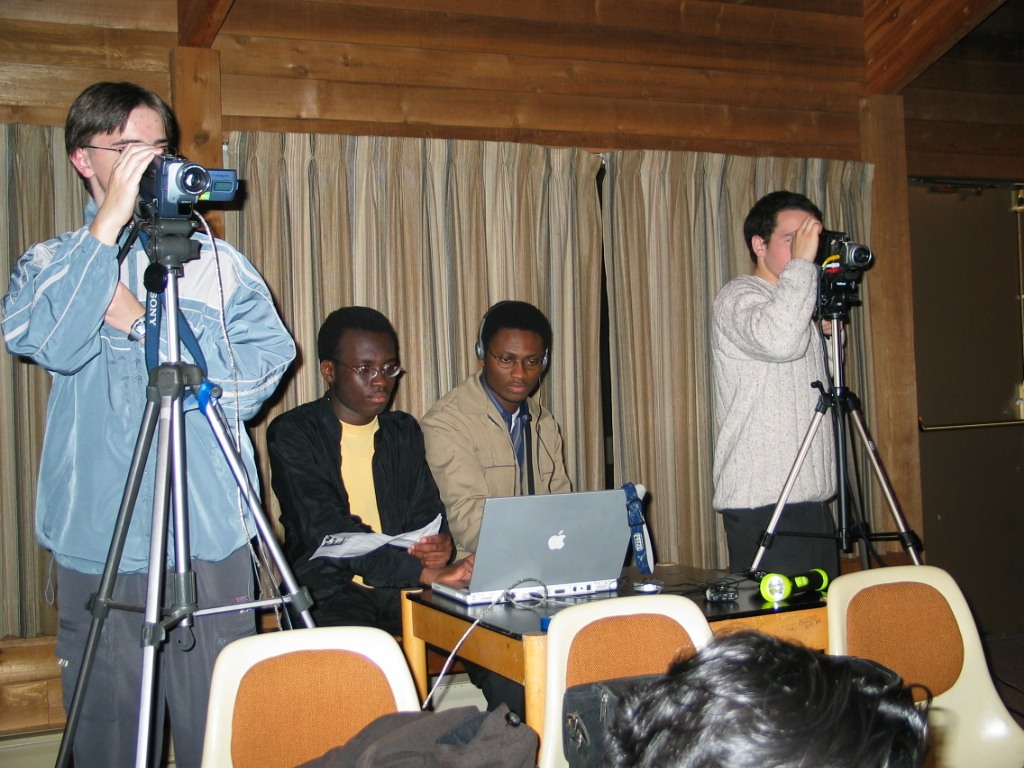
Since part of our goals relate to the involvement of our own students in providing the programming live via the internet, the following account describes how one student expressed his satisfaction with the process in a project week in June in bringing a set of live programs to the internet:

“I am one of three Pearson College students currently spending 11 project days at Race Rocks Marine Protected Area. We are all year 29 students of Pearson College who decided to stay for this project after our first year, and we will soon be going home to different countries of the world. My name is Jeremias Prassl, I’m from Austria. Even though coming from a landlocked country, oceans have always had a great fascination on me. Coming to Pearson College and living on the Pacific Ocean was the realization of an old dream. Through my IB biology class as well as waterfront activities at the college I’ve learned to value marine life in all its beauty and diversity. During the year, I spent one project week at Race Rocks, studying marine mammal behaviour in relation to the DND’s weapons testing. Numerous trips led me out to the island, some for biology classes (and related fieldwork), and some for helping with tasks necessary for the island, such as bringing fuel for the generators. Every time I come to Race Rocks, it allows me to discover something new, to explore a new aspect of this gorgeous place. This has been an amazing time for all of us. Diving, learning more about the reserve and species living on it, contributing to research projects, producing live webcasts daily, and helping the lighthouse keepers in maintaining the station have just been some of the tasks we pursued during the last days”
Jeremias Prassl, June 2003

Although so many people get to use the wonderful educational resources of the Race Rocks area by going there virtually on the internet, the wildlife is not harmed and the environment remains pristine. If we can say this after another 20 years and if other places have taken this technique and applied it in a similar way, then the experiment will have been worth every bit of the volunteer time and effort to make it successful. The program takes advantage of new media and new technology in a original and creative way which will hopefully form a model for education in conservation ecology in many parts of the world. When young people are given ownership of an idea they tend to internalize the values and end up with their own real commitment. Perhaps this is the aspect which we are most proud of in this project. From the examples we have seen of what our own students have gained and contributed in this venture, we know how effective this process can be and how powerful it is an educational tool. Because the project involves a creative approach to conservation education never tried before on this scale, and because it gives the confidence to our own international students knowing that their efforts can have a wider effect, influencing conservation practices beyond our local example, we feel this program has a major value in Distance Education.

We have recently started to build a set of pages which contain the translations of our racerocks.com website sitemaps. These are portrayed by flag icons at the base of the home page http://www.racerocks.com. The pages were done by the students of our racerock.com activity. It is hoped that we will be able to expand this coverage of languages in order to provide a start to multilingual access to the resource.

It is a difficult job securing at least $100,000 a year to keep the island operational. What is really needed is an endowment, and this we are determined to build up over the next few years. Keeping observers and cameras on the island has in the last few years served to keep the many users of the area such as whale watching boats accountable, so that the ecological integrity of the resource may be sustained. On the home page of racerocks.com is written: “we humans are never content just to know that a special area exists on this earth. We strive to be there, to touch, to feel, to consume. But therein lies the paradox. In so doing we can destroy the very thing we love.” The aim of the racerocks.com program has always been to make this special ecosystem available to all through the Internet. We have been fortunate to have this opportunity to establish a window into the daily lives of the creatures of a rugged marine island ecosystem. We just hope that we can continue to make the amazing life of these islands available to all. Last spring with the further assistance of Apple Computer, we upgraded our computers and added a new 340 degree robotic camera which provides a much more thorough survey of many parts of the islands from your own computer.

——————————————————————————————-

Author: *Garry Fletcher has worked with the Race Rocks project as a teacher since 1978. He has recently retired after teaching for 36 years, The last 28 of those years have been spent in teaching Biology and Environmental Systems and in the SCUBA Diving program at Lester B. Pearson College. He has always valued the role of hands on involvement in environmental projects to stimulate students. Garry now continues as the Educational Director of Race Rocks and continues development of the website at http://www.racerocks.com. He also serves as a marine education consultant from his home in Metchosin, British Columbia, Canada. )

In June of 2000, at their annual conference in Dunedin New Zealand, The Commonwealth Of Learning presented it’s Award for Excellence in Distance Education materials under category B: multimedia materials supporting non-formal education, to Lester B. Pearson College, Victoria, Canada for its on-line materials “Racerocks.com”. They recommended this multi-media material for the award because it is fitting for a variety of clientele needs in non-formal education in the very important area of the environment, it has adopted a sound learning and instructional design, and it uses a variety of media which can be integrated in a flexible manner according to individual learning needs and interests. (http://www.racerocks.com/racerock/events2004/col/colaward.htm)

the Racerocks.com Activity 2004-2005

The racerocks.com  activity was designed to accommodate those students who had an interest in internet technology and webcasting live activities from Race Rocks and from  Pearson College Campus. This set of photos show some of their activities 

The Race Rocks Weather Station


October, 2005 Chinyere and Juan Carlos inspect the Davis Weather Instrument that we have installed at Race Rocks for real-time monitoring and archiving of meteorological events.


Several individuals and groups have helped us in implementing this weather station. In particular we must mention the anonymous gifting to Race Rocks of two G4 Computers from our friend Julia from Boston. The weather instrument console originally interfaced with one of these computers and regularly transmitted the data by FTP to the Telus internet server.  Now a computer supplied by Pearson College transmits this data to a different server used by this website.
Thanks also to Mike Slater for an excellent job of installing the mast and the conduit for the instrument, and for the remote help in keeping the software running through our internet connection.

Funding of the weather instrument and installation work was originally funded byThe B.C. Ministry of Energy and Mines to assist in the upgrading of Internet services from the Island and to up-date monitoring of the environmental factors as part of the Pearson College, ENCANA, Clean Current Demonstration Tidal Power Project.

You may be able to find a Davis Weather Instrument in your neighbourhood too !

Imagine my surprize in April 2007 when I came across this Davis Weather Instrument operating behind the Bayon Temple at the Angkor Wat World Heritage Site in Cambodia.


Derived Variables for Davis Weather Instrument

DERIVED VARIABLES IN DAVIS WEATHER PRODUCTS
Application Note 28

Note: Not all formulae could be cut and pasted to this post so see the complete PDF for accurate formulae:

Derived Variable Calculations app note 28-1

The following parameters do not have any sensors or circuitry. They are calculated from measured variables. Any conditions that affect the functions of the measurements that are used to calculate these variables will affect the readings of these variables. This includes the Vantage Pro® and Vantage Pro2TM Setup Screen settings. In each case unless otherwise noted, the software uses the exact formula and the console uses a lookup table that closely approximates the formula.

WIND CHILL

Parameters Used: Outside Air Temperature and Wind Speed

What is it:
Wind chill takes into account how the speed of the wind affects our perception of the air temperature. Our bodies warm the surrounding air molecules by transferring heat from the skin. If there’s no air movement, this insulating layer of warm air molecules stays next to the body and offers some protection from cooler air molecules. However, wind sweeps that comfy warm air surrounding the body away. The faster the wind blows, the faster heat is carried away and the colder the environment feels.

The new formula was adopted by both Environment Canada and the U.S. National Weather Service to ensure a uniform wind chill standard in North America. The formula is supposed to more closely emulate the response of the human body when exposed to conditions of wind and cold than the old formula did.

Formulas:
Older versions of software (Versions 5.0 and earlier) and firmware (Vantage firmware revisions before Sept. 7, 2001 and all non-VantagePro products including Echo) are based on the following formula (Siple and Passel, 1945):

0.0817 * (3.71V0.5 + 5.81 – 0.25V) * (T – 91.4) + 91.4

where V is the wind speed in mph and T is the outside air temperature in °F. Wind speeds above 55 mph are set to 55 mph. For wind speeds below 5 mph or temperatures above 91.4°F, the wind chill is set equal to the air temperature.

Newer product revisions (WeatherLink version 5.1 through 5.5.1 and Vantage Pro and Vantage Pro2 consoles with Sept 7, 2001 firmware or later and Vantage Pro2 consoles with firmware before May 2005) are based on the following formula:

35.74 + 0.6215T – 35.75 * (V 0.16 ) + 0.4275T * (V 0.16 )

As with the old formula, any place where the result yields a wind chill temperature greater than the air temperature, the wind chill is set equal to the air temperature. This always occurs at wind speeds of 0 mph or temperatures above 76°F. This also occurs at lower wind speeds with temperatures between 0°F and 76°F.

The new formula takes into account the fact that wind speeds are measured “officially” at 10 meters (33 feet) above the ground, but the human is typically only 5 to 6 feet (2 meters) above the ground. So, anemometers still need to be mounted as high as possible (e.g., rooftop mast) to register comparable wind speed readings and wind chill values.

An even newer version of this formula is available in WeatherLink version 5.6 or later and Vantage Pro2 console firmware version and later. This newer version of the formula addresses the fact that the latest National Weather Service (NWS) formula was not designed for use above 40°F. The result of the straight NWS implementation was little or no chilling effect at mild temperatures. This updated version provides for reasonable chilling effect at mild temperatures based on the effects determined by Steadman (1979) (see THSW Index section), but as with the new NWS formula, no upper limit where chilling has no additional effect. The later version

28 – 2 Rev A 5/11/06

for the console table only differs in that whole degrees and less resolution in the table are used for code and memory space conservation. As with previous versions of the wind chill formula, any place where the result yields a wind chill temperature greater than the air temperature, the wind chill is set equal to the air temperature. This always occurs at wind speeds of 0 mph or temperatures at or above 93.2°F (34°C). This also occurs at lower wind speeds with temperatures between 0°F (-18°C) and 93.2°F (34°C). As per Steadman (1979), 93.2 F (34°C) is the average temperature of skin at mild temperatures, thus temperatures above this value will actually create an apparent warming effect (see THSW Index section).

The Vantage Pro and Vantage Pro2 console uses the “10-minute average wind speed” to determine wind chill, which is updated once per minute. When 10-minute of wind speed data is unavailable, it uses a running average until 10-minutes worth of data is collected. The WeatherLink® software uses the 10-minute average wind speed also. If it is unavailable, it uses the current wind speed (which updates every 2.5 to 3 seconds). All other products use the current wind speed to determine wind chill.

The reason an average wind speed is employed in the Vantage Pro and Vantage Pro2 to calculate wind chill is as follows: The human body has a high heat capacity, thus high wind speeds have no effect on the body’s thermal equilibrium. So, an average wind speed provides a more accurate representation of the body’s response than an instantaneous reading. Also, “official” weather reports (from which wind chill is calculated) provide average wind speed, so using an average wind speed more closely matches the results that are seen in weather reports.

REFERENCES

“Media Guide to NWS Products and Services”, National Weather Service Forecast Office, Monterey, CA, 1995.

“New Wind Chill Temperature Index”, Office of Climate, Water and Weather Services, Washington, DC, 2001.

Siple, P. and C. Passel, 1945. Measurements of Dry Atmospheric Cooling in Subfreezing Temperatures. Proc. Amer. Philos. Soc.

Steadman, R.G., 1979: The Assessment of Sultriness, Part I: A Temperature-Humidity Index Based on Human Physiology and Clothing Science. Journal of Applied Meteorology, July 1979

Rev A 5/11/06

28 – 3

HEAT INDEX

Parameters Used: Outside Air Temperature and Outside Humidity

What is it:
Heat Index uses temperature and relative humidity to determine how hot the air actually “feels.” When humidity is low, the apparent temperature will be lower than the air temperature, since perspiration evaporates rapidly to cool the body. However, when humidity is high (i.e., the air is saturated with water vapor) the apparent temperature “feels” higher than the actual air temperature, because perspiration evaporates more slowly.

Formulas:
Older versions of software and the display console using the following methodology. This formula is based upon the lookup table presented by Steadman (1979). The Davis implementation simply extends the range of use of this table to make it usable at temperatures beyond the scope of the table. Some of this extension is based on the table adapted by the US National Weather Service. The GroWeather and EnviroMonitor systems do not display a value beyond the scope of the Steadman table. All other products that display this value either:
Set values at temperatures below the scope of the table to the air temperature
Extend the readings using a best-curve fit above and below the air temperature
scope of the table. The low temperature cutoff is when the heat index for the given combination of temperature and humidity is 14°C or 57.2°F or below. This corresponds to a vapor pressure of 16 hPa. Heat Indices are set equal to the air temperature or 57.2°F, whichever is less, below these values. (The 14°C cutoff corresponds to the equivalent dewpoint at average testing laboratory conditions.)
WeatherLink software versions 5.2 or later and Vantage Pro2 console firmware versions of May 2005 revision or later use the above methodology with the following exceptions for values below an air temperature of 68°F:
The values use a variable baseline to which the Heat Index is either above or below the air temperature.
The values are loosely derived from the methodology outlined by Steadman in his 1998 paper (referenced below). Thus, air temperatures below 50°F follow this 1998 procedure. Air temperatures above 68°F follow his procedure outlined in 1979 (since the US NWS continues to use this). Davis has made a smooth transition between the two methods between 50°F and 68°F.

  1. The formula Davis uses is also used by the US National Weather Service. Heat Index can also be used to determine indoor comfort levels and as such is displayed in WeatherLink version 5.6.The latest version for the console table only differs in that whole degrees and less resolution in the table are used for code and memory space conservation.Note: Heat Index has also been referred to as “Temperature-Humidity Index” and “Thermal Index” in some Davis products.

28 – 4 Rev A 5/11/06

REFERENCES

Steadman, R.G., 1979: The Assessment of Sultriness, Part I: A Temperature-Humidity Index Based on Human Physiology and Clothing Science. Journal of Applied Meteorology, July 1979

“Media Guide to NWS Products and Services”, National Weather Service Forecast Office, Monterey, CA, 1995.

Quayle, R.G. and Steadman, R.G., 1998: The Steadman Wind Chill: An Improvement over Present Scales. Weather and Forecasting, December 1998

Rev A 5/11/06

28 – 5

DEWPOINT

Parameters Used: Outside Air Temperature and Outside Humidity

What is it:
Dewpoint is the temperature to which air must be cooled for saturation (100% relative humidity) to occur, providing there is no change in water content. The dewpoint is an important measurement used to predict the formation of dew, frost, and fog. If dewpoint and temperature are close together in the late afternoon when the air begins to turn colder, fog is likely during the night. Dewpoint is also a good indicator of the air’s actual water vapor content, unlike relative humidity, which is air temperature dependent. High dewpoint indicates high vapor content; low dewpoint indicates low vapor content. In addition a high dewpoint indicates a better chance of rain and severe thunderstorms. Dewpoint can be used to predict the minimum overnight temperature. Provided no new fronts are expected overnight and the afternoon Relative Humidity >=50%, the afternoon’s dewpoint gives an idea of what minimum temperature to expect overnight. Since condensation occurs when the air temperature reaches the dewpoint, and condensation releases heat into the air, reaching the dewpoint halts the cooling process.

Formula:
The following method is used to calculate dewpoint:

v = RH*0.01*6.112 * exp [(17.62*T)/(T + 243.12)],
this equation will provide the vapor pressure value (in pressure units) where T is the air

temperature in C and RH is the relative humidity. Now dewpoint, Td, can be found:
Numerator = 243.12*(ln v) – 440.1
Denominator = 19.43 – ln v

Td = Numerator/Denominator

This equation is an approximation of the Goff & Gratch equation, which is extremely complex. This equation is one recommended by the World Meteorological Organization for saturation of air with respect to water.

The Vantage Pro and Vantage Pro2 console uses a lookup table and it only differs from the formula in that whole degrees and less resolution in the table are used for code and memory space conservation.

REFERENCES

“Guide to Meteorological Instruments and Methods of Observation”. World Meteorological Organization, Geneva, Switzerland, 6th Ed. 1996.

“Smithsonian Meteorological Tables”. Smithsonian Institution Press, Washington, DC, 4th Ed. 1968.

28 – 6 Rev A 5/11/06

THSW INDEX

Parameters Used: Temperature, Humidity, Solar Radiation, Wind Speed, Latitude & Longitude, Time and Date

What is it:
Like Heat Index, the THSW Index uses humidity and temperature to calculate an apparent temperature. In addition, THSW incorporates the heating effects of solar radiation and the cooling effects of wind (like wind chill) on our perception of temperature.

Formula:
The formula was developed by Steadman (1979). The following describes the series of formulas used to determine the THSW or Temperature-Humidity-Sun-Wind Index. Thus, this index indicates the level of thermal comfort including the effects of all these values.

This Index is calculated by adding a series of successive terms. Each term represents one of the three parameters: (Humidity, Sun & Wind). The humidity term serves as the base from which increments for sun and wind effects are added.

The Vantage Pro and Vantage Pro2 calculation is an improvement over the THSW Index in the Health EnviroMonitor because the Health system:

only calculates THSW Index when air temperature is at or above 68°F.

assumes the sky is clear.  assumes the elevation is sea level.

  1. HUMIDITY FACTORThe first term is humidity. This term is determined in the same manner as the Heat Index. This term serves as a base number to which increments of wind and sun are added to come up with the final THSW Index temperature.Note: Heat Index has also been referred to as “Temperature-Humidity Index” and “Thermal Index” in some Davis productsWIND FACTORThe second term is wind. Depending upon your version of firmware or software, this term is determined in part by a lookup table (for temperatures above 50°F) and in part by the wind chill calculation, or uses an integrated table that is used both for calculation of this term and for wind chill. With this in mind, the following criterion apply with later versions referring to Vantage Pro2 console firmware revision May 2005 or later or WeatherLink version 5.6 or later: At 0 mph, this term is equal to zero.  For temperatures at or above 68°F and wind speeds above 40 mph, the wind speed is set to

    40 mph. For later versions, there is no upper limit on wind speed.For temperatures at or above 130°F, this term is set equal to zero. For later versions of this algorithm: WeatherLink uses 144°F as the threshold; Vantage Pro2 console firmware 143°F. This is based on a best-fit regression of the Steadman 1979 wind table. The differences are reflective of the higher resolution used in the WeatherLink software.

  2. For temperatures below 50°F (later versions use the new wind chill formula result here (calculate the wind chill increment using the difference between the air temperature and wind chill)):
    For the earlier display console versions and WeatherLink version 5.0 or 5.1:use the wind chill calculation as the base temperature.
    For the WeatherLink software(versions5.2through5.5.1):use the new heatindex

    formula (as described in the heat index section) as the base temperature and calculate the wind chill increment using the difference between the air temperature and wind chill (which is always a negative number).

    The resulting value is the wind term, which will be added to the humidity term and subsequently the sun term as indicated below.
    Note: The WeatherLink software (version 5.2 through 5.5.1) offers a variable does not include the sun term in its calculation. It shows the result as the “THW Index” or Temperature-Humidity- Wind Index. This value indicates the “apparent” temperature in the shade due to these factors.

    SUN FACTOR

    The third term is sun. This term, Qg, is actually a combination of four terms (direct incoming solar, indirect incoming solar, terrestrial, and sky radiation). The term depends upon wind speed to determine how strong an effect it is. The value is limited to between

    For temperatures below 50°F (later versions use the new wind chill formula result here (calculate the wind chill increment using the difference between the air temperature and wind chill)):
    o FortheearlierdisplayconsoleversionsandWeatherLinkversion5.0or5.1:usethe

    wind chill calculation as the base temperature.
    o FortheWeatherLinksoftware(versions5.2through5.5.1):usethenewheatindex

    formula (as described in the heat index section) as the base temperature and calculate the wind chill increment using the difference between the air temperature and wind chill (which is always a negative number).

    The resulting value is the wind term, which will be added to the humidity term and subsequently the sun term as indicated below.
    Note: The WeatherLink software (version 5.2 through 5.5.1) offers a variable does not include the sun term in its calculation. It shows the result as the “THW Index” or Temperature-Humidity- Wind Index. This value indicates the “apparent” temperature in the shade due to these factors.

    SUN FACTOR

    The third term is sun. This term, Qg, is actually a combination of four terms (direct incoming solar, indirect incoming solar, terrestrial, and sky radiation). The term depends upon wind speed to determine how strong an effect it is. The value is limited to between 20 and +130 W/m2 in the Vantage Pro2 console firmware and WeatherLink software versions 5.6 or later.

    REFERENCES

    Steadman, R.G., 1979: The Assessment of Sultriness, Part II: Effects of Wind, Extra Radiation and Barometric Pressure on Apparent Temperature. Journal of Applied Meteorology, July 1979.

    “Media Guide to NWS Products and Services”, National Weather Service Forecast Office, Monterey, CA, 1995.

    Quayle, R.G. and Steadman, R.G., 1998: The Steadman Wind Chill: An Improvement over Present Scales. Weather and Forecasting, December 1998

    BAROMETRIC PRESSURE

    What is it:
    The weight of the air that makes up our atmosphere exerts a pressure on the surface of the earth. This pressure is known as atmospheric pressure. Generally, the more air above an area, the higher the atmospheric pressure, this, in turn, means that atmospheric pressure changes with altitude. For example, atmospheric pressure is greater at sea-level than on a mountaintop. To compensate for this difference and facilitate comparison between locations with different altitudes, atmospheric pressure is generally adjusted to the equivalent sea-level pressure. This adjusted pressure is known as barometric pressure. In reality, the Vantage Pro and Vantage Pro2 measures atmospheric pressure. When entering the location’s altitude in Setup Mode, the Vantage Pro and Vantage Pro2 calculates the necessary correction factor to consistently translate atmospheric pressure into barometric pressure.

    Barometric pressure also changes with local weather conditions, making barometric pressure an extremely important and useful weather forecasting tool. High pressure zones are generally associated with fair weather while low pressure zones are generally associated with poor weather. For forecasting purposes, however, the absolute barometric pressure value is generally less important than the change in barometric pressure. In general, rising pressure indicates improving weather conditions while falling pressure indicates deteriorating weather conditions.

    The following section applies to Vantage Pro and Vantage Pro2 systems only:
    Parameters Used: Outside Air Temperature, Outside Humidity, Elevation, Atmospheric Pressure

    Formula: Simply,

    PSL = PS * (R),
    where PSL is sea level pressure, PS is the unadjusted reading sensed by the Davis barometer,

    and R is the reduction ratio, which is determined as follows:

    First, Tv (virtual temperature in the “fictitious column of air” extending down to sea-level) can be determined as follows. The result is in degrees Rankine, which is similar to Kelvin except it uses a Fahrenheit scale divisions rather than Celsius scale divisions:

    Tv = T + 460 + L + C,

    where T is the average between the current outdoor temperature and the temperature 12 hours ago (in Fahrenheit) in whole degrees. L is the typical lapse rate, or decrease in temperature with height (of the “fictitious column of air”), as calculated by:

    L = 11 Z/8000,
    where L is a constant value with units in °F. Z is elevation, which must be entered in feet.

    The current dewpoint value and the station elevation are necessary to compute C. C is the correction for the humidity in the “fictitious column of air”. It is determined from a lookup table (provided in the attached table). The table consists of dewpoints in °F every 4°F and elevations

    in feet every 1500 feet. Linear interpolation is performed to obtain the correct reduced pressure value. For dewpoints below –76°F, C = 0; for dewpoints above 92°F, a dewpoint of 92°F is assumed.

    Now, Tv can be determined. From this, the following can be computed: Exponent = [Z/(122.8943111*Tv)]
    Once this exponent is computed, R can be computed from the following: R = 10^[Exponent].

    Thus, PSL = PS * (R) can be calculated. Pressure can be in any units (R is dimensionless) and still yield the correct value.

    This procedure is designed to produce the correct reduced sea-level pressure as displayed. This requires the user to know their elevation to at least plus or minus 10 ft. to be accurate to every 0.1 ” HG

    or plus or minus 3 feet to be accurate to every 0.1 mb/hPa.

    This is a simplified version of the official U.S. version in place now. The accepted method is to use lookup tables of ratio reduction values keyed to station temperature. These are based on station climatology. These values are unavailable for every possible location where a Davis user may have a station, thus this approach is not suitable.

    It should be noted that if a sensor’s pressure readings require adjustment, the user can adjust either the uncorrected or the final reading to match the user’s reference, as appropriate. If the user chooses to measure uncorrected atmospheric pressure or use another reduction method, they should set their elevation to zero. Subsequently, output data using the VantageLink can be read by or exported to another application and converted as desired.

    The calibration of the sensor is a separate one time function performed on the unit during the manufacturing process. It is a completely independent operation from the calculation the Vantage Pro and Vantage Pro2 console makes to display a reading corrected to sea-level. The calibration is done to ensure the sensor reads uncorrected or raw atmospheric pressure (not barometric pressure) properly. Any properly functioning unit will read the uncorrected atmospheric pressure within specifications. However, limits in the displayable range of the bar value may prevent the user from setting an incorrect elevation for their location. That is, a user at sea-level, may see a dashed reading if they set their unit to 5000′ elevation or vice-versa. So, the best way to tell if a unit is functioning properly, is:

    •  use a reference that has been adjusted to indicate sea-level pressure and setting the Vantage Pro and Vantage Pro2 console to the proper elevation or
    •   use a reference that is reading the raw, uncorrected atmospheric pressure and set the Vantage Pro and Vantage Pro2 console elevation to zero

      and verify that these readings are comparable.

      ALTIMETER SETTING and CWOP APRS

    The CWOP program in NOAA prefers to receive altimeter setting data rather than barometric pressure. This feature in WeatherLink 5.7 automatically calculates the correct altimeter setting using the user-specified elevation. Monitor II and Perception II users should set their barometer reading to match the altimeter setting of the nearest National Weather Service (NWS) weather station. Simply enter your zip code on the NWS home page to get the nearest observation. This is usually found at the “2 Day History” (detailed observation section) link under Current Conditions section. http://www.nws.noaa.gov/ . For users outside the United States, contact your country’s national meteorological service.

    Altimeter Formula, A:

Race Rocks Millenium Project 2002-2004

A Bold Initiative: racerocks.com utilizes 21st century technology to maximum advantage to create a dynamic educational web experience utilizing the extraordinary marine eco-system at Race Rocks, Canada’s most southerly point in the Pacific.

Real time streaming video webcasts digital images of marine life from above the sea at Race Rocks and below the ocean when divers are on hand to do the live mobile webcasts. In addition, a complete environmental scan will be continually transmitted from the site using an array of data sensors in five ecosystems of the area.

The knowledge of the First Nations is being explored and explained as the Salish people share generations of experience in living in harmony with the abundance that once dominated this region and is now threatened.

Creative educators are developing internet-based curriculum to stimulate students and teachers to engage fully in the racerocks.com educational program. Researchers will share their studies and discoveries as we gain a new and deeper understanding of the ecosystem

The Place

For centuries, deep ocean currents and the great rivers of the Georgia Basin have converged in the Strait of Juan de Fuca between southern Vancouver Island and Washington State. Race Rocks reveals itself as nine rocky outcrops thrust from the ocean floor in the middle of the strait.

For generations the people of the Salish Nation prospered in this region at the entrance to the Salish Sea. The extraordinary richness of this diverse ecosystem represented by Race Rocks is valued today as it was then. Race Rocks has been an ecological reserve since 1980 and is becoming Canada’s first internationally recognized Marine Protected Area.

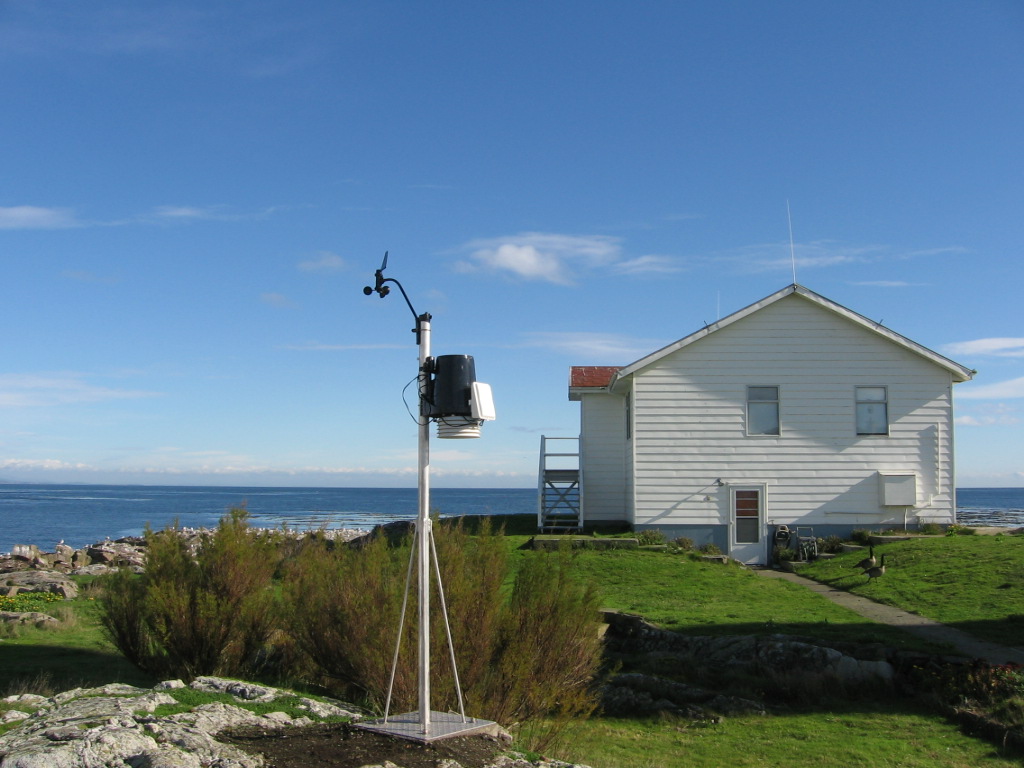
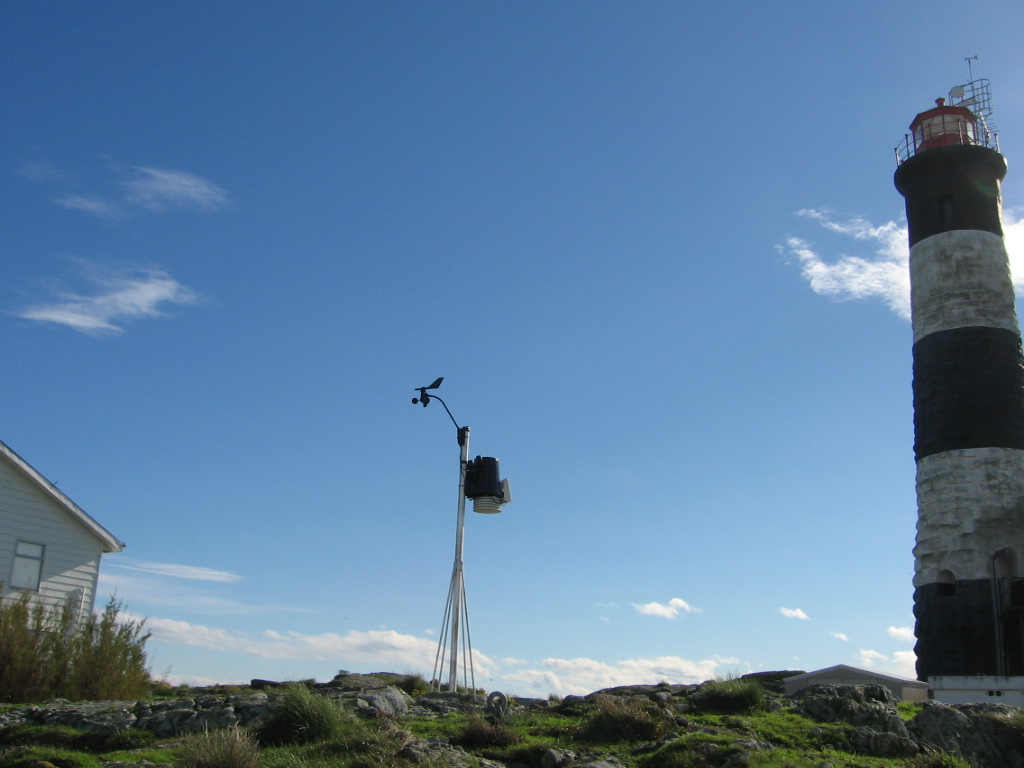
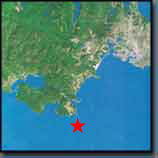
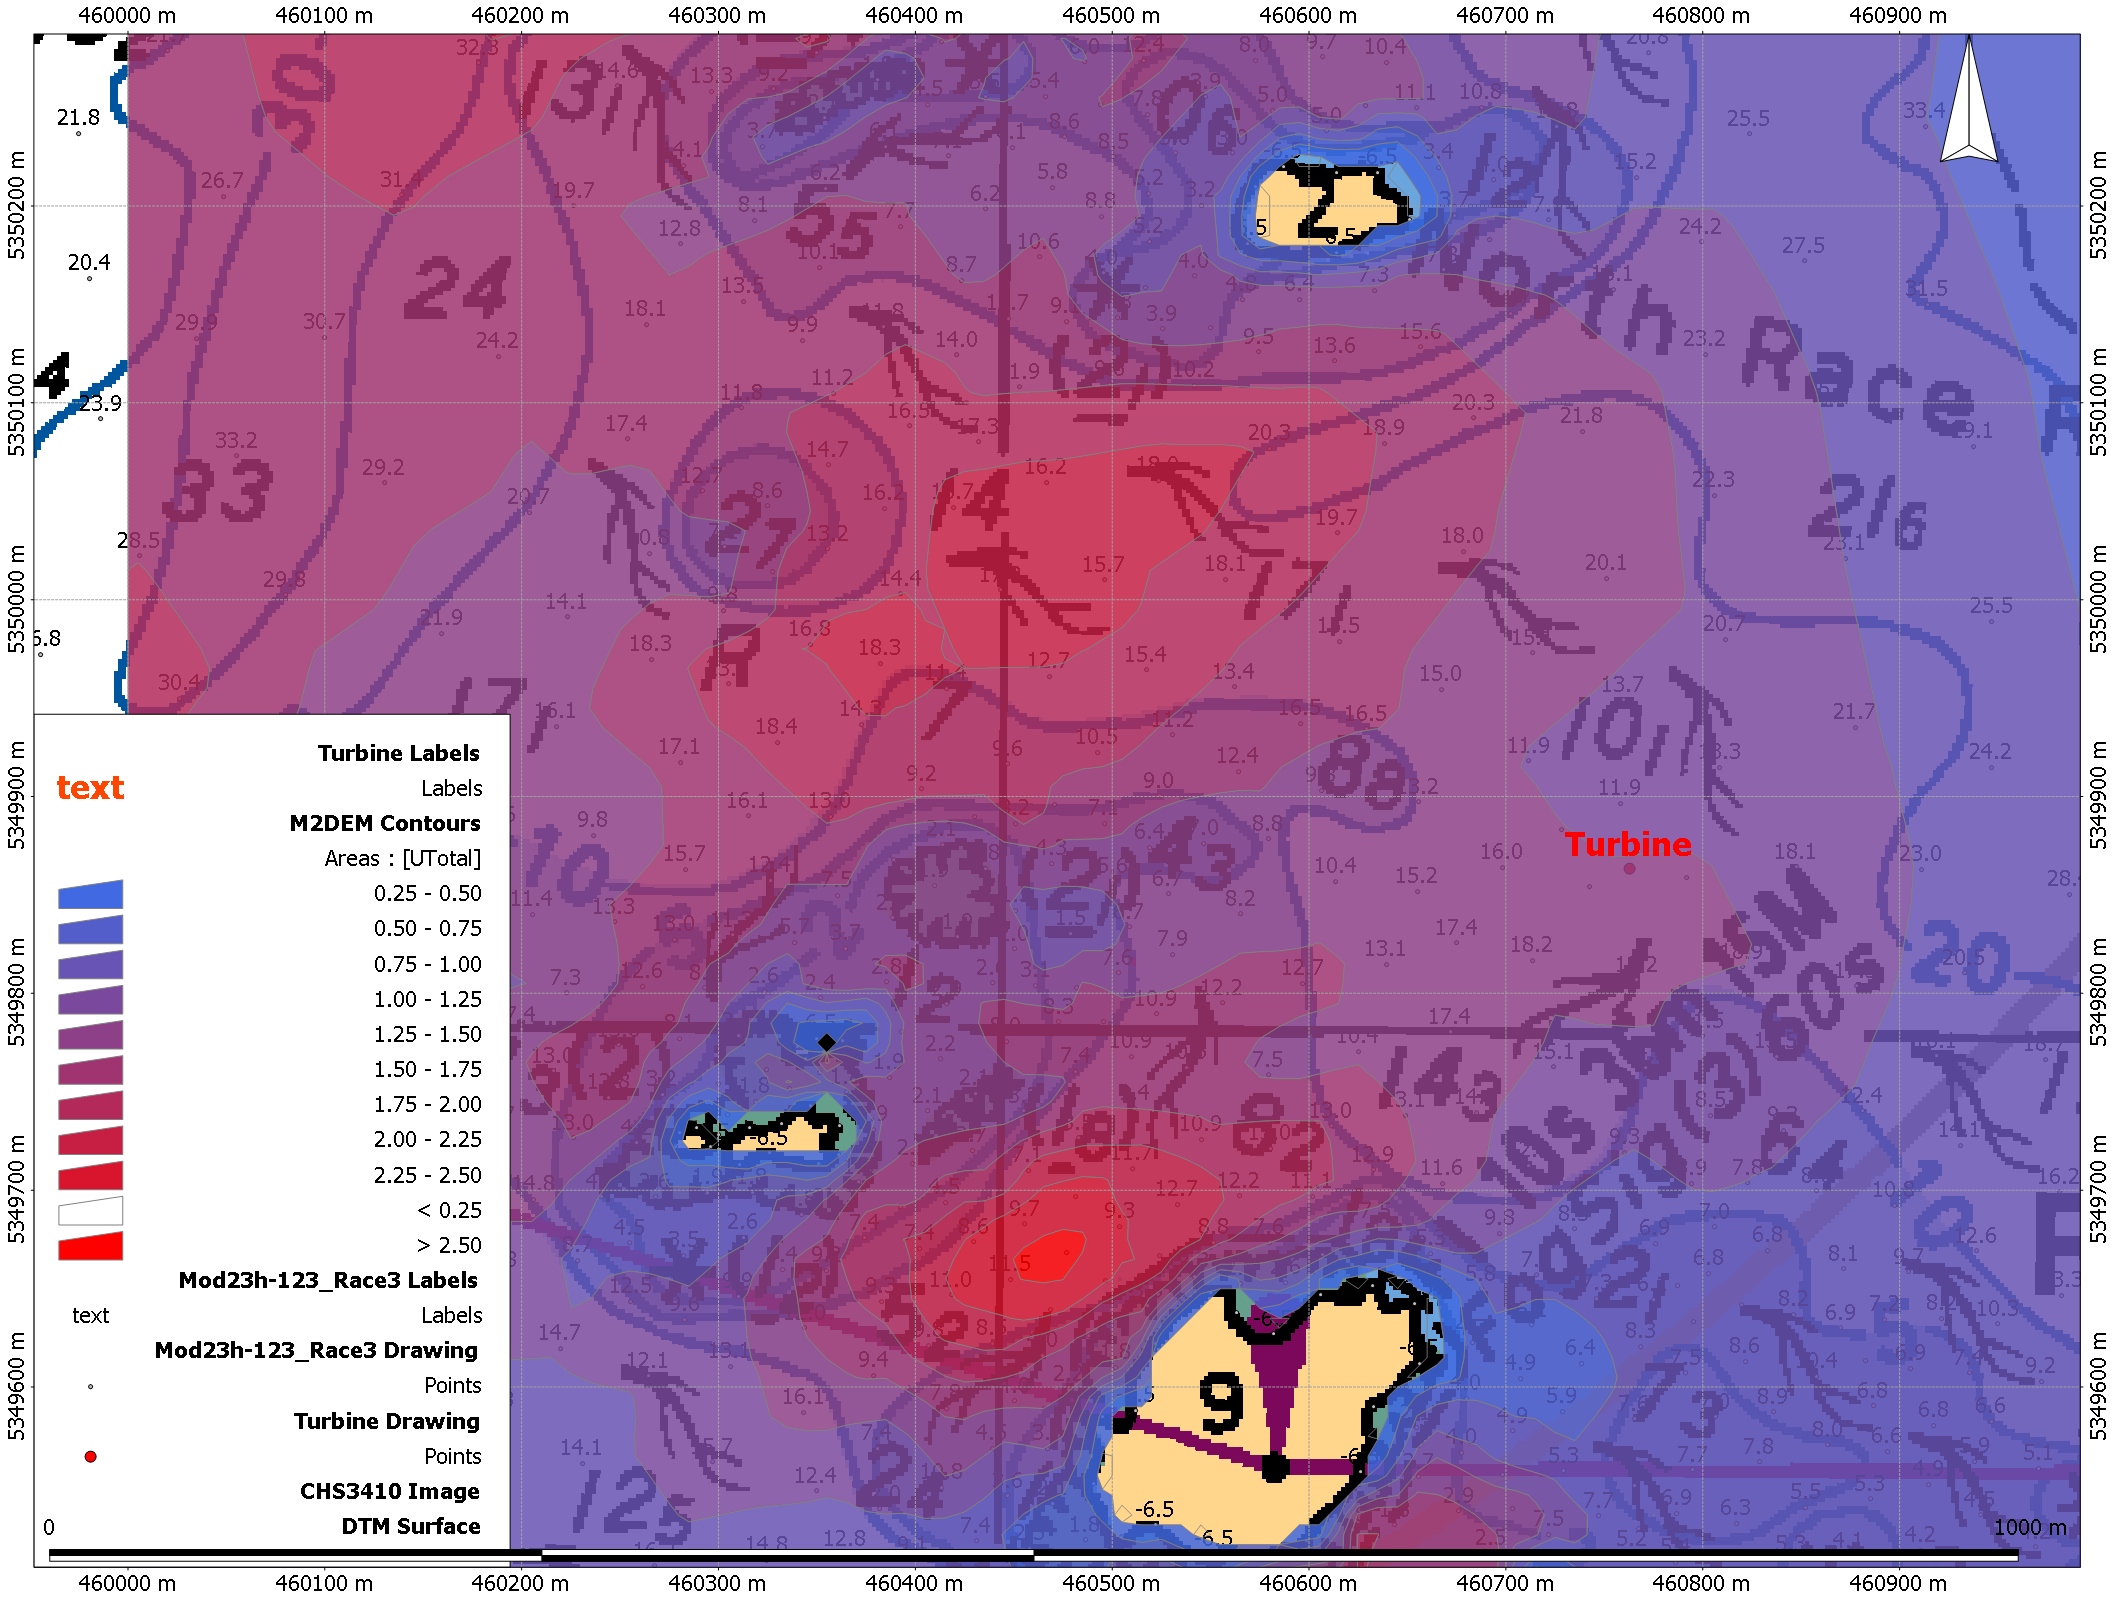
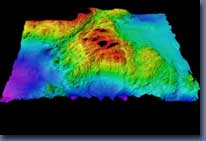
The small, rocky outcrops are home to seals, sea lions, elephant seals and birds, as well as the buildings and equipment of the Race Rocks Lighthouse. These outcrops are literally the tip of the ecosystem New leading-edge bathymetry reveals Race Rocks as a giant underwater mountain. The diversity of marine life is breathtaking and still not fully explored. The teachings of Salish elders merge with more recent science to explain the mysteries of nature at Race Rocks.

The Technology

Recent developments have made a complex real time streaming video site possible. Presently three and potentially up to seven digital cameras and an array of data sensors above and below the ocean at Race Rocks will collect information. The signal is compressed and transmitted by broad band radio from the top of the Race Rocks light tower direct to nearby Pearson College. From Pearson College, through high speed fiber links to the racerocks.com server, and then on to the AKAMAI network, the video and data will be available throughout the internet. Two-way interactive capability is being incorporated into the design to allow for specific educational programming.

The Partners

Lester B. Pearson College– is one of ten United World Colleges located around the world. Two hundred students from over 80 countries study the International Baccalaureate curriculum during their two years at Pearson College. Garry Fletcher, a faculty member teaching Environmental Systems and Biology at Pearson College, is the educational director of racerocks.com. Garry and his students will guide the educational content of the site. Pearson College operates the former Race Rocks light station facilities as a education centre under an agreement with BC Parks. Pearson College is the lead proponent and partner directing the racerocks.com project.


LGS Group Inc. – is one of Canada’s largest full service IT consulting firm with 2100 employees in 20 offices in Canada, Europe and the US. LGS is donating the time and resources to provide project management and web design services in the creation of racerocks.com. Along with their ability to capitalize on emerging Internet technologies to promote the project, LGS brings essential knowledge, skills, and expertise. 

Telus– a leading Canadian telecommunications company, is providing the bandwidth and server capability  to host racerocks.com. Skilled technical staff at Telus have assisted in the development and implementation of the project assuring high-speed delivery to the Internet and accessibility to a large audience. Telus is donating this component to racerocks.com.

Vancouver Aquarium Marine Science Centre-a leading organization in marine research and public education on the West Coast of Canada. The Marine Science Centre has committed a significant contribution of funds and expertise to the project. In return it will gain a new window for aquarium visitors into an ecologically sensitive marine world at the South tip of Vancouver Island. The most recent contribution is a hydrophone which will be installed subtidally at Race Rocks.

Apple Computers (Canada)The Computers that we use for the live video webcasts from Race Rocks are all made by APPLE COMPUTERS. In July of 2000, Apple Canada became a partner in the Millennium Partnership program with the donation of a Macintosh PowerBook G3. 500 MHz. It followed up with further support in April of 2001 with the donation of a G4 500 MHz portable computer. These new high speed computers have been essential in broadcasting the manually operated live programs from the islands.They have been a most valuable addition for our live video webcasting programs.

Apple and the Apple Learning Interchange:

The quicklime live video streams were hosted by the Apple Learning interchange over the Akamai Internet distribution network. In April of 2001, a set of three airport cards was provided by ALI in order to make all the cameras webcasting wirelessly from the island. Race Rocks support pages, learning activities, discussion forums, and scheduled chats.

Seapoint Sensors Inc. of Kingston New Hampshire has joined as a partner providing a turbidity meter for measuring turbidity or suspended solids and a Chlorophyll fluorometer for measuring chlorophyll a . Both are representative of a fine line of high performance oceanographic sensors. They are installed sub-tidaly in 8 meters of water off the docks on the North Side of Race Rocks .

CompuSmart of Victoria , B.C. has joined as a partner in providing the majority of the funds for the purchase of a new computer for the Database which is being produced to handle the  Phase 2 Environmental Data Sensors for Race Rocks.

Sorenson Media provided  software to assist in the production of the live streaming video and the improvement of the archived video on the website.

FRIENDS of ECOLOGICAL RESERVES-The “Friends” have been long time supporters of Race Rocks. They have given financial help for the purchase in 2000 of a camera for the project and in 2001, a SONY wireless microphone.


SONY of Canada Ltd.

joined as a partner in April of 2001, with the donation of a SONY Digital Video camera. This camera joins the three other SONY cameras that are used to provide the live streaming video from Race Rocks.

Government Agencies-racerocks.com has received assistance from the Department of Fisheries and Oceans in many aspects of the project development. BC Parks has provided the use of buildings and facilities at Race Rocks. Both levels of government are working cooperatively with local First Nations groups as well as other community groups to create the Race Rocks Marine Protected Area.


Millennium Partnership Fund– racerocks.com would not have been possible without major funding from the Canadian Millennium Partnership Fund of the Government of Canada. We are very grateful to the Federal Government and all those who assisted us in our application.

Graduate Students We are particularly fortunate to benefit from the services and support of a number of alumni of Lester B. Pearson College who have donated their time or have given direct financial assistance to racerocks.com

Ken Dunham ( PC year 9) has designed and implemented the advanced network at Pearson College, and recently
extended these facilities across the water to Race Rocks.

Giovanni Rosso (PC year 24) has provided the money for a digital camera which we use to document the project.

Jochen Kumm (PC year 10) has provided a computer for the Ecological Overview database and is assisting with the development of the Environmental Database for racerocks.com


Affiliated Organizations

  • Glentel

Continue reading

BC Parks Impact Assessment Process Preliminary Screen Report for Electrical Cable installation

File No:   85700-35/0210206

BC Parks Impact Assessment Process 

Level 1, Preliminary Screen Report

Name of Action:    Installation of Electrical Cable Channel and Conduits at Race Rocks. 

Proponent:               Lester B Pearson College and Clean Current Power

Review Date(s):         May 17, 2005                                                                Page:  1of 3

  1. Issues and Environmental Components
  2. List any issues of concern that have been or may be raised by BC Parks, other government agencies, First Nations, or the public.
  • No habitat loss should take place.
  • Impacts that could potentially be damaging to other wildlife and plant communities as a result of  demolition/construction activities.
  1. Identify any geographic “hots pots” at or close to the proposed action (e.g., areas of high use, concentrations of facilities, wilderness conservation zones, unique landscape features).

The proposed location of the cable entry to the water from the island is represented below.

This would allow construction in the intertidal area during mid-May to mid-June in a location where there is already extensive human-created infrastructure, and where there is no impact to nesting birds. It also enables us to provide needed repair of the dock structure.

  1. Identify any important environmental, recreational, social or economic values in the area of the proposed action and/or the area surrounding the proposed action (e.g., rare or endangered species, hiking experience, midden site). Include a rationale as to why the value is considered important.

There are none of the above values with this route along the docks that could be considered an impediment. Pam Thuringer of Archipelago Marine did a survey of the area at low tide on May 12. She found no rare or significant species in the area that will not recover in a short period afterwards. Link to her species list here

Preliminary Screen Checklist Page:  2 of 3

Complete the following based on information available and/or the experience of BC Parks staff at the time of the review.

  1. BC Parks has a responsibility to comply with the following Acts and regulations. Indicate that the proposed action complies with the following: Done ( or N/A)
    Park Act, Park Amendment Acts Yes
    Ecological Reserve Act Yes
    An order issued under the Environmental Land Use Act n/a
    BC Environmental Assessment Act n/a
    Waste Management Act n/aHeritage Conservation Act (i.e., Archaeological Impact Assessment Guidelines) n/a
    Federal Fisheries Act (Department of Fisheries and Oceans) n/a
    Other (specify):
    Comments:
    BC Parks should ensure that all actions comply with BC Parks policies. Indicate that the proposed action complies with the following: Done
    Approved management plan or management direction statement (MDS)Yes
    BC Protected Areas Strategy: Resource and Recreation Use Guidelines for Protected AreasYes BC Parks Policy including conservation and recreation goals (Striking the Balance) Yes
    BC Parks Policies (specify):Eco reserves set aside for protection and research Yes
    BC Parks ConservationProgramPolicies yes
    BCParksAnnualManagementPlan (i.e.,values and targets)n/a
    Other (specify):
    Comments:
    Page:3 of 3 3.
    Document which agencies /stakeholders that have been or should be notified and/or contacted: yes” Done ( or N/A)
    Conservation Data Centre n/a Ministry of SRM (specify branch):
    Ministry of Forests (i.e., Range Act) n/a

Ministry of Energy and Mines (Mineral Tenure Act) n/a
Ministry of Health Services n/a>
First Nations Yes
Agencies responsible for broader level plans (i.e., Regional District, LRMP) n/a
Other (specify):
Comments (include name and title of contact):
The proposed action is likely to result in the following impacts (check all that apply) Done
(U or N/A)

Adverse and permanent effects on the important conservation, recreation and/or cultural heritage values n/a

Adverse and permanent effects on the character and aesthetics of the protected area n/a

Adverse effects to endangered, threatened or vulnerable or regionally significant species, populations and  habitats (i.e., red/blue-listed species/habitats, biogeoclimatic representation) U

Adverse effects to critical or geographically unique characteristics U

Adverse effects to public health and safety n/a

Adverse effects to traditional use of the area by First Nations n/a

Adverse effects to local communities n/a

Adverse effects to the recreational use or enjoyment of the park (regardless of the intended benefits of the proposed action) n/a

Economic implications, such as operating costs, that cannot be maintained over time n/a

A high level of controversy or public concern regarding the action n/a

Effects of the action, which when combined with the effects of other actions in the region, may result in cumulative impacts n/a

Implications which may be precedent-setting and should therefore be considered in the context of similar future actions n/a

Comments (use corresponding letters to refer to specific impacts listed above):

  1. Level 1 report should recommend appropriate times and methods for construction to ensure birds/wildlife impacts are kept to a minimum.
    to ensure birds/wildlife impacts are kept to a minimum.The site where the cable would enter the sea, is on the west side of the Jetty. This area can receive concrete cladding of a reinforced conduit right down to the end of the jetty, if concrete is poured at one of the upcoming low tides in the next month, in order to avoid pouring underwater.
    The proposal involves a protective conduit that can be bolted to the wall of the jetty. This same conduit would enter the water and carry the cable down to the depths, where intertidal damage from rolling rocks would not occur.
    A further advantage of this proposal is that we would require that the west wall of the jetty would re-enforced with concrete in order to repair some of the undermining of the jetty. In some areas this has gone in as far as 60 to 80 centimeters. That part of this erosion of the jetty could be the result of it not being fully filled in with new concrete when the jetty was partly rebuilt in 1986. It looks very much like the older exposed loose concrete and fill was the part that has eroded. The dock was constructed sometime pre-1950 on a rock finger projecting seaward.
    By using camera 5 remote control at  you can see this area easily if you choose the pre-selection of “Jetty”. By zooming in at low tide, the base of the dock can be seen almost to the end.
    Construction Method: Roma Construction is being contracted for the above water portion of the job.This job consists of two parts:

    Part a) Consists of immediate work, to commence within the next week, in order to take advantage of the upcoming sets of low tides during the daytime. A 6 inch solid conduit in 25’ sections (HDPE )  will be embedded in concrete for the length of the docks shown here in magenta. Removal of the surface coating of algae and sessile invertebrates will be done only in the area of the new concrete addition. Any large motile invertebrates will be displaced manually from the immediate area prior to the cleaning. No chemicals will be used in the cleaning process as a directed water jet should be adequate. The dock will be repaired along this side in the process, with holes and unstable portions filled in. Also included in this operation will be the inclusion of a 4 inch conduit for telemetry and cables as well as a 1.25 inch poly hose for water intake.

    Concrete will be made on site from materials transported to the island. Any debris created during the process will be hauled off the island for disposal.

    Chris Blondeau, operations manager and Garry Fletcher, Ecological Reserve Warden, will be on site to oversee the environmental concerns. In addition, Pam Thuringer and staff of Archipelago Marine have been contracted to do an ongoing environmental assessment for the duration of the construction phase of the project during the next year.

Installation of Succession plates for the Tidal Energy project

This video shows the installation process for the tidal energy generator research project. This was carried out by Chris Blondeau and the Pearson College Divers in order to determine which surfaces discouraged growth in the waters at Race Rocks. As a result, Titanium was used in the construction of some parts of the generator as it was one of the metals most resistant to fouling.

See other archived video with Pearson College Divers

Link to the Integrated Energy Project

Deploy and Retrieve ADCP Instrument 2005

In order to predict the best location for the installation of the tidal power generator, an ADCP ( Acoustic Doppler Current Profiler) supplied by ASL Environmental Sciences was deployed. This instrument will collect current regime information for a period of one month. Rita Santos did the video and Angie Karlsen helped Chris Blondeau lift and position the concrete weights used to secure the device on the sea floor..

See other archived video with Pearson College Divers

Preliminary Screening: BC Parks Impact Assessment

                                                                                                               File No:   85700-35/0210206

BC Parks Impact Assessment Process

Level 1, Preliminary Screen Report

(See Users Guide, pp. 9 to 12)

Name of Action:       Expand generator shed for battery storage for Current Turbine Project  

Proponent:               Lester B Pearson College

Review Date(s):         March 17,05                                                                Page:  1of 3

A. Issues and Environmental Components

  1. List any issues of concern that have been or may be raised by BC Parks, other government agencies, First Nations, or the public.

Impacts of expanding sidewalk footprint. Impact on nesting birds.

ie: Construction should take place when birds aren’t nesting.

No habitat loss should take place.

Impacts that could potentially be damaging to other wildlife and plant communities as a result of  demolition/construction activities.

  1. Identify any geographic “hotspots” at or close to the proposed action (e.g., areas of high use, concentrations of facilities, wilderness conservation zones, unique landscape features).

The proposed footprint of the engine room expansion is represented below. Note the sidewalk extension is made more clear in following diagrams.

This would accommodate the floor plan represented following:
The outside wall with the double door in the technical diagram is the part that would occupy the small white square above.

This would accommodate the floor plan represented following:
The outside wall with the double door in the technicall diagram is the part that
would occupy the small white square above.

  1. Identify any important environmental, recreational, social or economic values in the area of the proposed action and/or the area surrounding the proposed action (e.g., rare or endangered species, hiking experience, midden site). Include a rationale as to why the value is considered important.

Ensure no endangered or rare plant species or other habitat is lost as a result of expansion of sidewalk. Reduce size to minimum needs.

This area has been surveyed on April 6 /05 by Pam Thuringer of Archipelago Marine and she has indicated there are no endangered plant species therein. Most of the grasses are introduced species, with a few invasive species. None of the rock outcrop up the slope is impacted by this extension.

“I have recommended that the sod that is lifted, should be transplanted to another area of the island, for instance to a corner of the top of the concrete covered cistern, which could support a grass community if  adequate soil depth was restored, or other areas which currently have concrete which could be moved such as the “sidewalk to nowhere!” below, located by the boat shed.   I think that restoration of this 17 by 4 foot area would be a suitable mitigation for the impacted area by the engine room, as it adds habitat in an area more suitable for nesting. ”
(Garry Fletcher)

Preliminary Screen Checklist Page:  2of 3

Complete the following based on information available and/or the experience of BC Parks staff at the time of the review.

  1. BC Parks has a responsibility to comply with the following Acts and regulations. Indicate that the proposed action complies with the following: Done ( or N/A)
    Park Act, Park Amendment Acts Yes
    Ecological Reserve Act Yes
    An order issued under the Environmental Land Use Act n/a
    BC Environmental Assessment Act n/a
    Waste Management Act n/aHeritage Conservation Act (i.e., Archaeological Impact Assessment Guidelines) n/a
    Federal Fisheries Act (Department of Fisheries and Oceans) n/a
    Other (specify):
    Comments:
    BC Parks should ensure that all actions comply with BC Parks policies. Indicate that the proposed action complies with the following: Done
    Approved management plan or management direction statement (MDS)Yes
    BC Protected Areas Strategy: Resource and Recreation Use Guidelines for Protected AreasYes BC Parks Policy including conservation and recreation goals (Striking the Balance) Yes
    BC Parks Policies (specify):Eco reserves set aside for protection and research Yes
    BC Parks ConservationProgramPolicies yes
    BCParksAnnualManagementPlan (i.e.,valuesandtargets)n/a
    Other (specify):
    Comments:
    Page:3 of 3 3.
    Document which agencies /stakeholders that have been or should be notified and/or contacted: yes” Done ( or N/A)
    Conservation Data Centre n/a Ministry of SRM (specify branch):
    Ministry of Forests (i.e., Range Act) n/a

Ministry of Energy and Mines (Mineral Tenure Act) n/a
Ministry of Health Services n/a>
First Nations Yes
Agencies responsible for broader level plans (i.e., Regional District, LRMP) n/a
Other (specify):
Comments (include name and title of contact):
The proposed action is likely to result in the following impacts (check all that apply) Done
(U or N/A)

Adverse and permanent effects on the important conservation, recreation and/or cultural heritage values n/a

Adverse and permanent effects on the character and aesthetics of the protected area n/a

Adverse effects to endangered, threatened or vulnerable or regionally significant species, populations and  habitats (i.e., red/blue-listed species/habitats, biogeoclimatic representation) U

Adverse effects to critical or geographically unique characteristics U

Adverse effects to public health and safety n/a

Adverse effects to traditional use of the area by First Nations n/a

Adverse effects to local communities n/a

Adverse effects to the recreational use or enjoyment of the park (regardless of the intended benefits of the proposed action) n/a

Economic implications, such as operating costs, that cannot be maintained over time n/a

 A high level of controversy or public concern regarding the action n/a

Effects of the action, which when combined with the effects of other actions in the region, may result in cumulative impacts n/a

Implications which may be precedent-setting and should therefore be considered in the context of similar future actions n/a

Comments (use corresponding letters to refer to specific impacts listed above):

  1. Level 1 report should recommend appropriate times and methods for construction to ensure birds /wildlife impacts are kept to a minimum.

The window of work for the sidewalk construction will be in the next few weeks. It is scheduled to start on April 18, well before the onset of nesting in late May. We have given the end of April as a deadline for the sidewalk extension and any other on land work that may compromise the bird nesting habitat to be completed.

Concrete will be made on site from materials transported to the island.

  Garry Fletcher and /or Chris Blondeau will be on site to oversee the environmental concerns and Brian Emmett and Pam Thuringer and staff of Archipelago Marine have been contracted to do an ongoing environmental assessment for the duration of the construction phase of the project during the next year.

  1. An on ground review of proposed sidewalk location and reduced sidewalk footprint recommended.

See photos above.