Baseline Study and Monitoring of the tidal current energy project at Race Rocks

March 04, 2005

Mr Garry Fletcher
Garry Fletcher Consulting:
4645 William Head Road
Victoria, BC.

Canada, V9C-3Y7

Re: Baseline Study and Monitoring of the tidal current energy project at Race Rocks

Dear Garry:

Our response to your request for baseline inventory and monitoring services for the Race Rocks tidal current project follows. Our response is slightly unorthodox in that I have taken each of your task requirements and provided comment on a proposed approach and, when possible, some idea of scope, effort and cost. We cannot provide an overall cost estimate for this project until we have further defined the monitoring requirements with yourself and the proponents, in particular the approach and degree of effort required for monitoring noise levels on land and in water. In addition there are partnering opportunities with Pearson College which could reduce costs. However, given the scope provided, I think that the overall project budget will be in the $40,000 to $70,000 range, with about 30-40% of costs attributable to noise monitoring.

We are very interested in working with the Person College-EnCana-Clean Current group on this project, both because of our long term appreciation of Race Rocks as a valued and sensitive marine ecological area, as well as our support for innovative and sustainable energy generation. If you have any questions with respect to this response please contact me early next week.

Sincerely

Brian Emmett, M.Sc.

Director, Marine Environmental Services Division

Horizontal Structure in Ecosystems

centrelargecompressedm
Introduction:In this file, we show the process and results of an investigation on some specific examples of horizontal structure of ecosystems
Objectives: After doing this lab, you will be able to:
a) Observe a species in its environment and determine its horizontal distribution.
b) Comment on the causes of horizontal distribution of vegetation at Race Rocks
c) Analyze how horizontal structure in your own ecosystem is determined by abiotic and biotic factors
d) Design your own protocol for analyzing the effects of horizontal structure on ecosystems.
e) Discuss the implications for Human built-up environments on Biodiversity of Ecosystems.
f) Quantify the amount of anthropogenic influence from human construction on the surface area of Race Rocks.

PROCEDURE:

1. Use the remote cameras at Race Rocks and scan around for one species: mammal, bird or plant. Probably there will be more than one of these animals or plants in view. Once you decide on the species, be sure you know its correct identification.

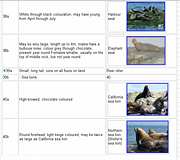
2. Go to this file for a dichotomous key to help in identification of birds and mammals.

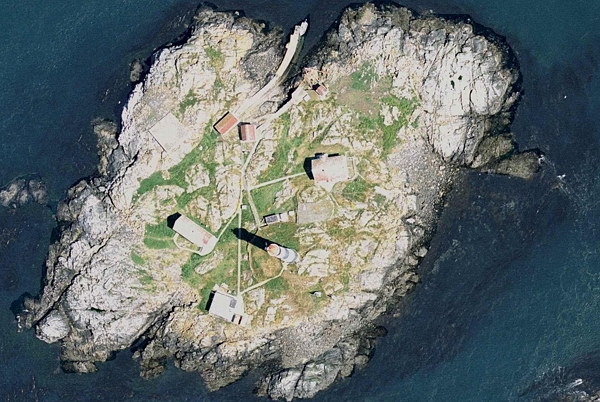
3. Look for patterns in the distribution of that species, the sector of the island in which it is located, whether it is near vegetation or on a rock, whether it is exposed to wind or not, or how closely it is located to the shore. See if you can add any ideas about how the horizontal patterns of the species are determined. Then add your sighting record summarizing these observations on the GIS database. Next observe the island from the air in the image above. This is part of the image of the GIS projection on OceanQuest. You can see just by the color, where pockets of accumulated soil have determined the horizontal distribution of vegetation on the islands. You can also see from this bird’s-eye view, how the surge and wave action producing salt spray and erosion around the edge of the island might have has produced this zone free of vegetation.
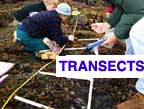
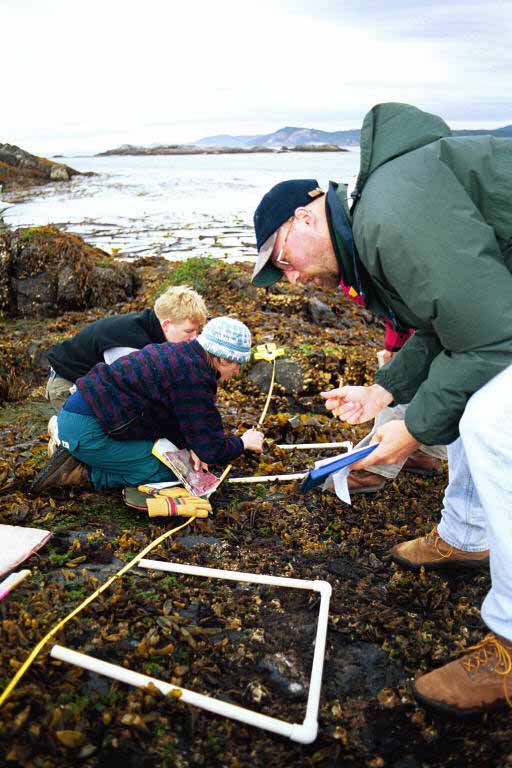
4. One of the field techniques of studying the horizontal distribution of organisms is also a technique which allows the production of baseline information about organism distribution. Go to this file on Environmental gradients, (which are determined by biotic and abiotic factors). It shows how a belt transect can be used to document changes of organisms through a specified distance. Describe the procedure used and indicate how records produced in this way may be very useful in measuring the effect of humans on ecosystems through time.( hint:Oil or other chemical spills)
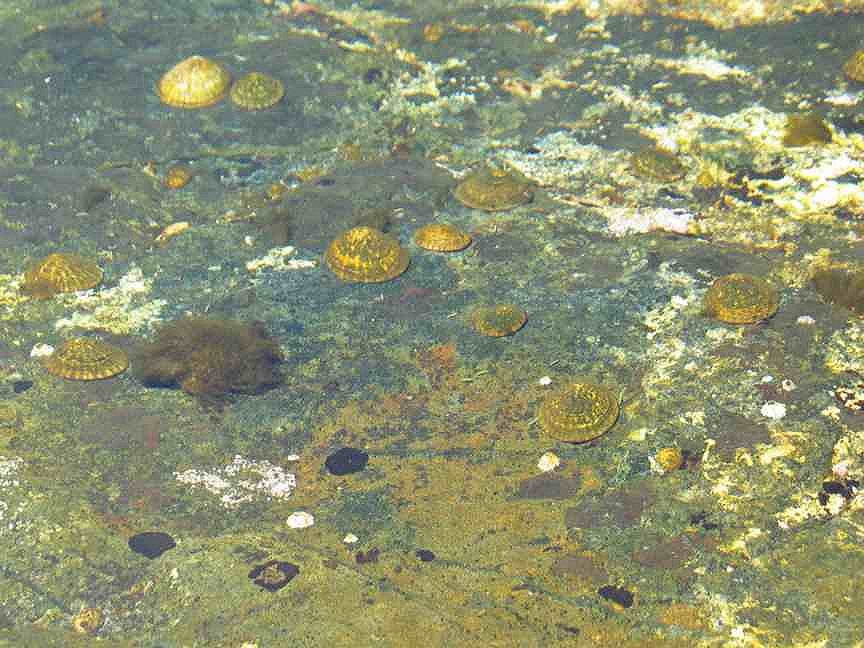
5.Organisms themselves often play the role of determining species distribution. Here in the artificial tidepool #13, limpets can be seen underwater grazing on an algal scum on the flat rock base of the tidepool. In this case, the limpet has determined the horizontal distribution of the algae, and vice versa, the remaining algal scum determines where the limpets will be distributed on the horizontal plane. Describe other examples of where organisms themselves determine distribution . Things to think of are: habitat and shelter, food sources, the presence of one species creating a “microniche” for another.
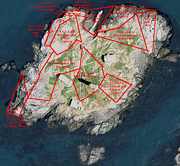
6. Biodiversity of Ecosystems often suffers as a result of human activities. One could say that humans are probably the most significant organism in the effect on biodiversity. Describe two ways in which humans have a negative effect on biodiversity and two ways in which humans have a positive effect on biodiversity. Go to this file for an exercise which allows you to determine the influence of human activity on the horizontal patterns of distribution of organisms on Race Rocks. In this exercise we take a critical look at the Race Rocks Ecosystem, and actually measure and calculate the Anthropogenic footprint. In it you might encounter some examples of bioremediation and restoration, some interesting history and some mysteries. Most certainly you will discover the history of how human activities can have a big impact on an island ecosystem.


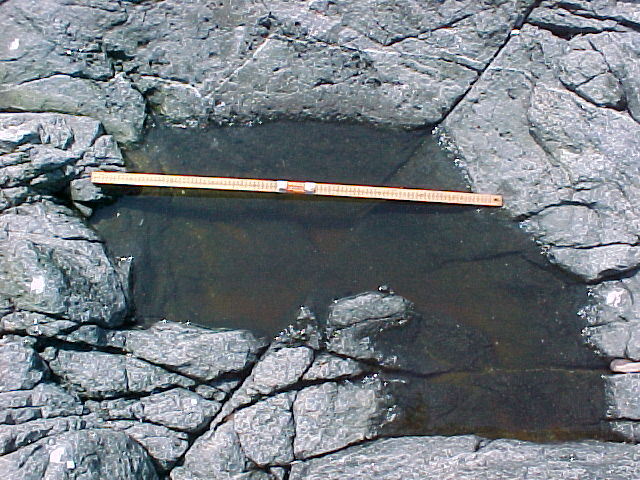
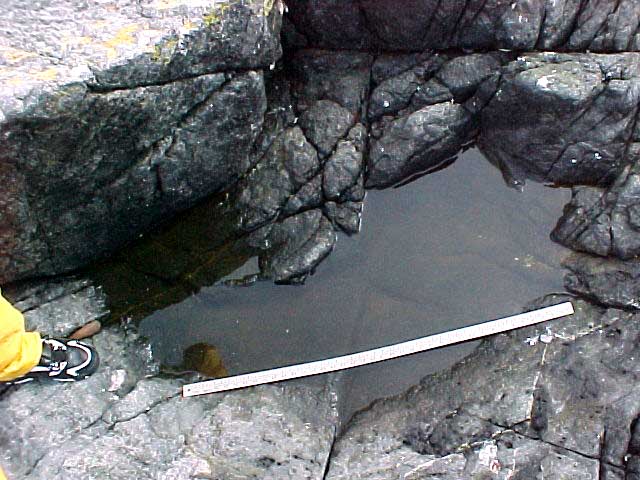
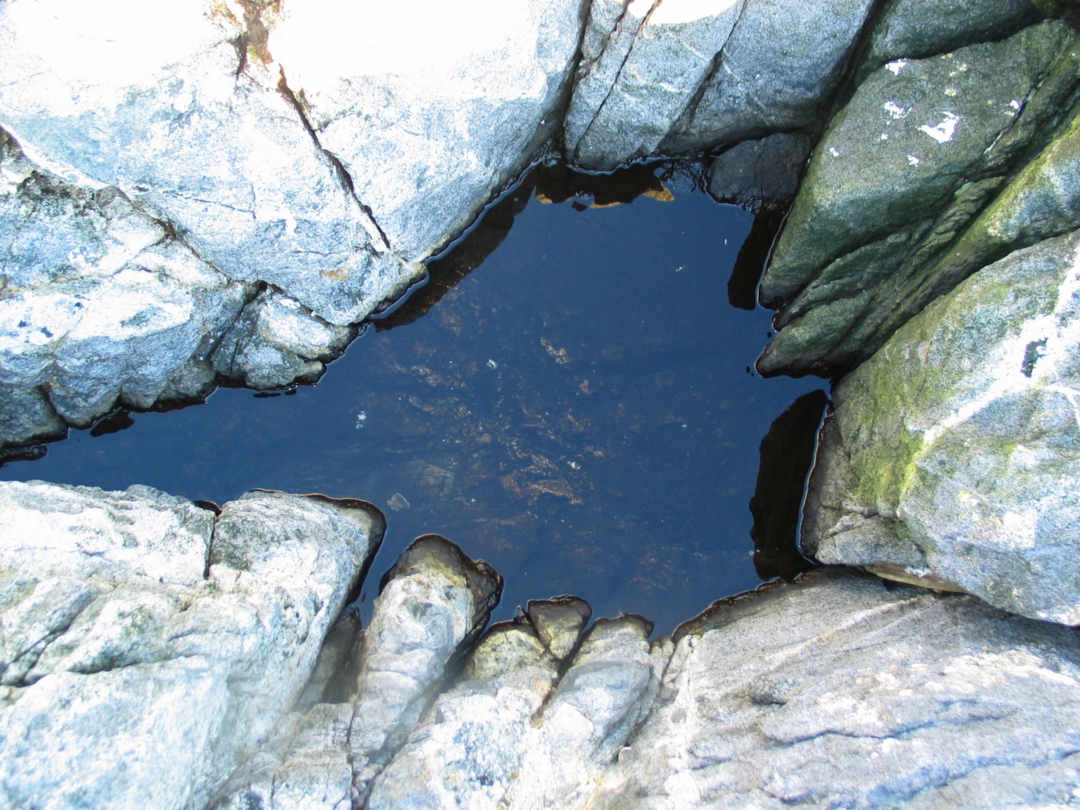
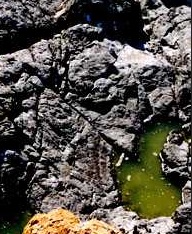
Tidepool # 12 at Race Rocks

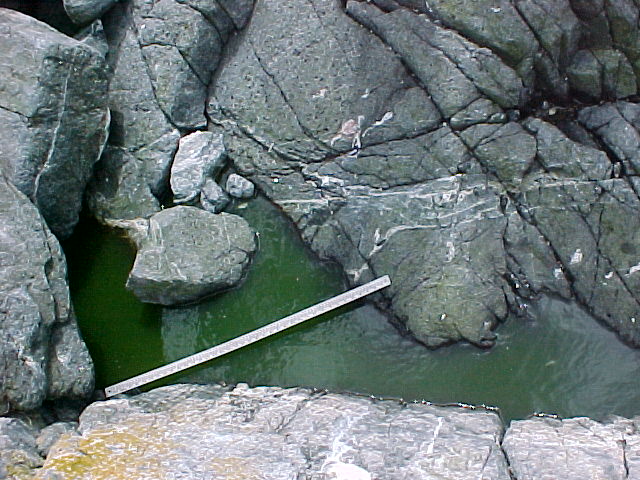
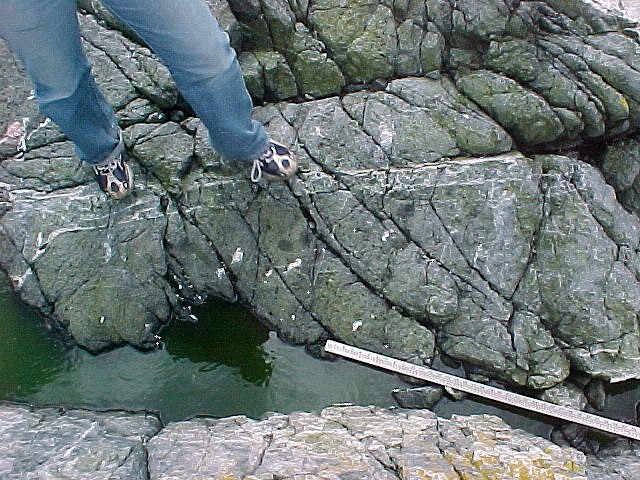
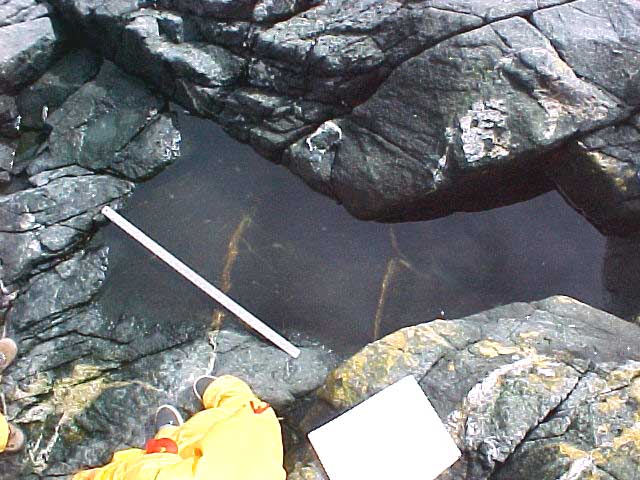
This pool is above the highest tidal level. It only gets replenished with sea water during a storm event with a high west wind and a relatively high tide.

Images Garry Fletcher

Some ideas to consider:
 Go to the Environmental Data page and using the data from the weather pages there, predict when such events may occur.

Tidepool # 7 at Race Rocks

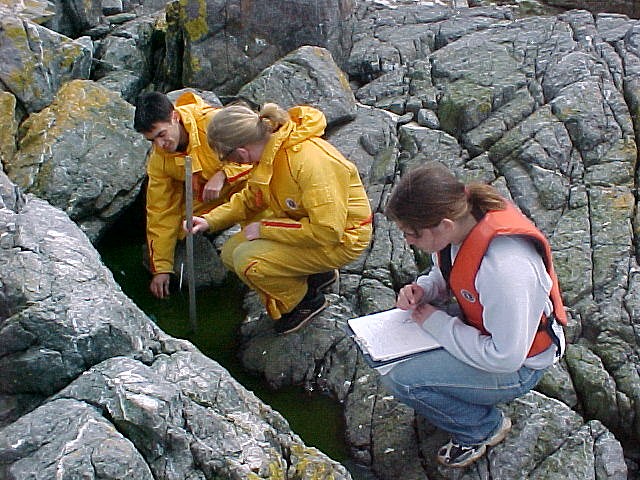
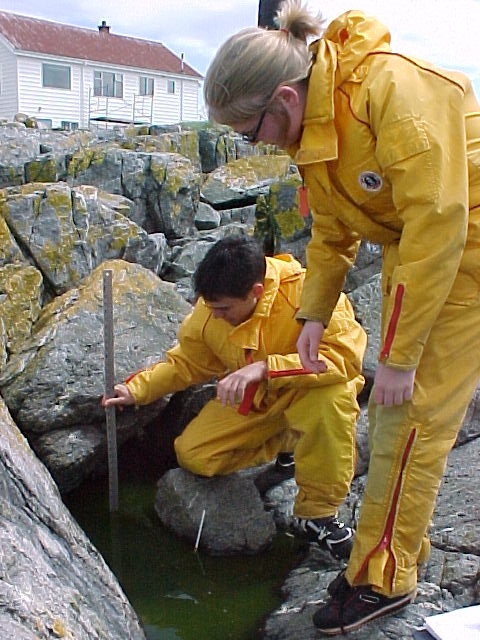
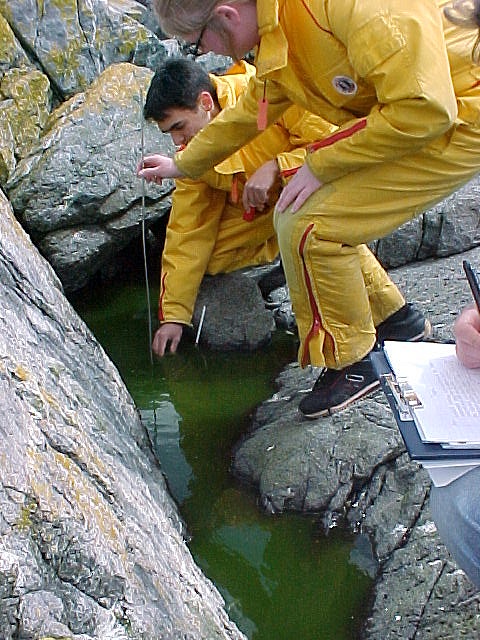
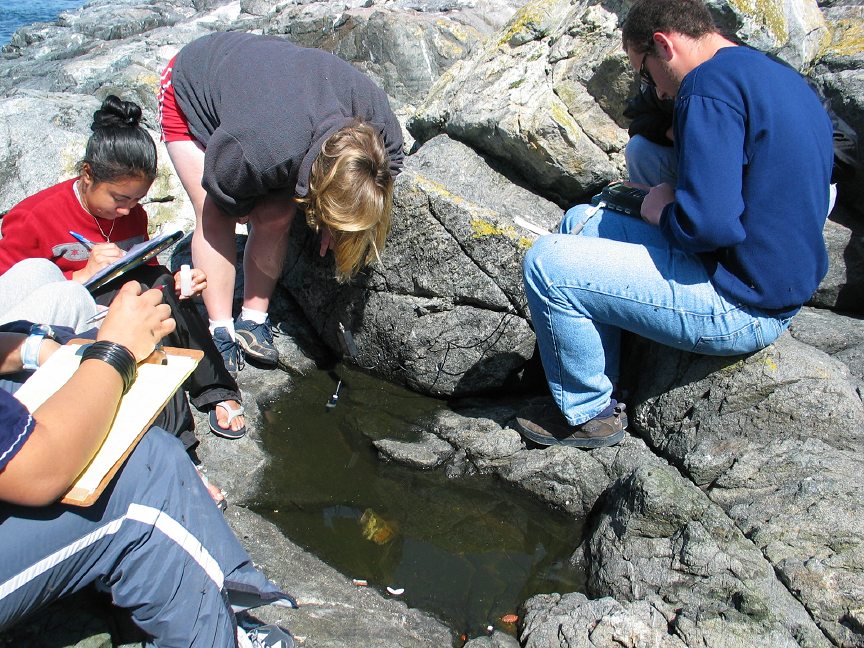
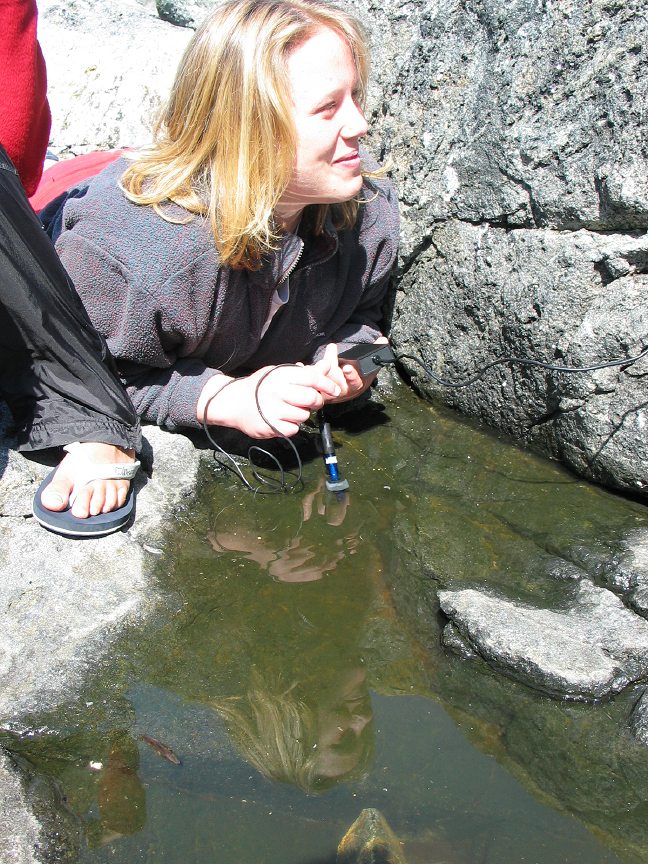
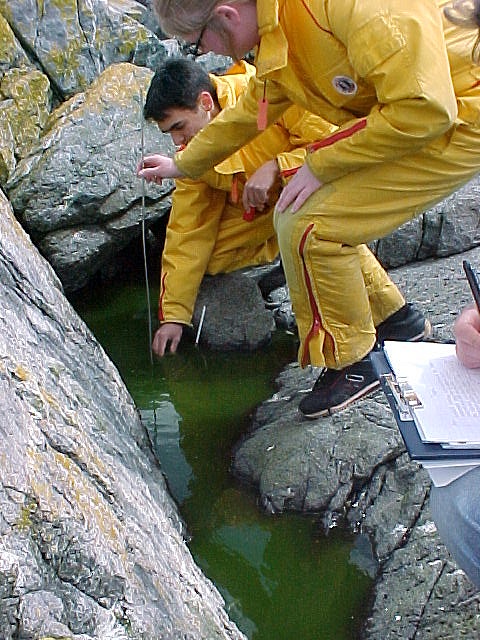
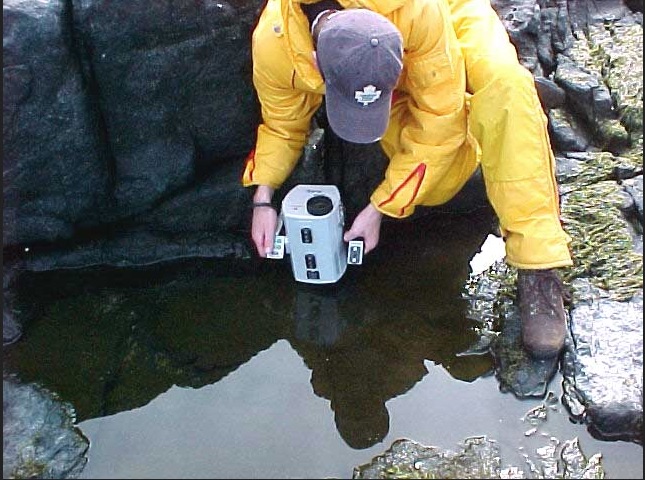
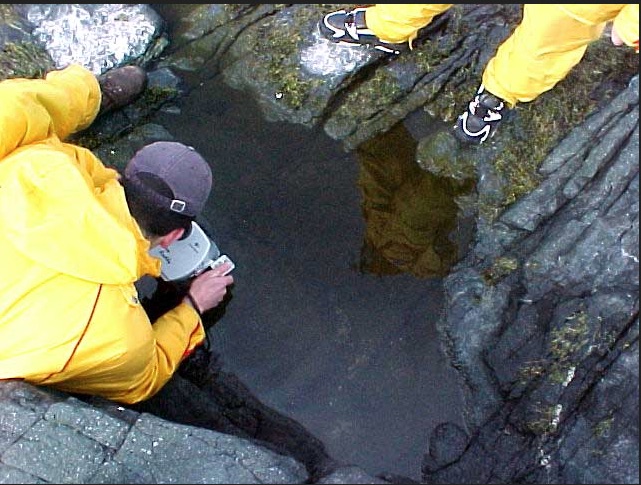
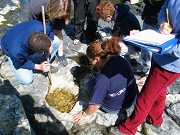
In May 2004, the biology class measures the abiotic factors in Pool 7.

Jen with the salinity probe.


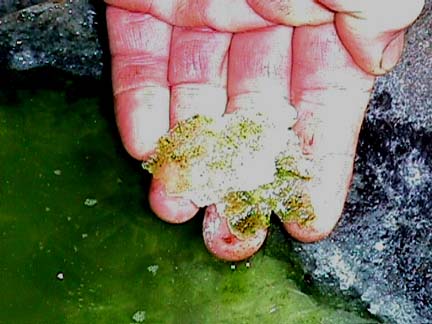
The most striking feature about this tidepool is that since it is at such a high level on the intertidal, in the heat of summer, there is evaporation which concentrates the salinity into a saturated solution even beyond the range of measurement on the salinometer. Even in that high concentration as can be seen in the following picture, a green algae lives among the salt crystals


Salt Crystals with algal growth form in Pool7 in the summer


Some ideas to consider:

Tidepools 7and 8 are situated very close together, differing only in a few centimeters in elevation. The salinity and temperatures of the pools may vary however. It might be worthwhile to document these variations and propose some explanations for the variation.


Lab on Primary Productivity of Pyramimonas


Lab on Primary Productivity of Pyramimonas

See the video on a discussion of the high tidepools and productivity

Background: (adapted from Vernier lab 23 of “Biology with Computers”)

Oxygen is vital to life. In the atmosphere, oxygen comprises over 20% of the available gases. In aquatic ecosystems, however, oxygen is scarce. To be useful to aquatic organisms, oxygen must be in the form of molecular oxygen, O2. The concentration of oxygen in water can be affected by many physical and biological factors. Respiration by plants and animals reduces oxygen concentrations, while the photosynthetic activity of plants increases it. In photosynthesis, carbon is assimilated into the biosphere and oxygen is made available, as follows:

6 H2O + 6 CO2(g) + energy = C6H12O6 + 6O2(g)

The rate of assimilation of carbon in water depends on the type and quantity of plants within the water. Primary productivity is the measure of this rate of carbon assimilation. As the above equation indicates, the production of oxygen can be used to monitor the primary productivity of an aquatic ecosystem.

One method of measuring the production of oxygen is the light and dark bottle method. In this method, a sample of water is placed into two bottles. One bottle is stored in the dark and the other in a lighted area. Only respiration can occur in the bottle stored in the dark. The decrease in dissolved oxygen (DO) in the dark bottle over time is a measure of the rate of respiration. Both photosynthesis and respiration can occur in the bottle exposed to light, however. The difference between the amount of oxygen produced through photosynthesis and that consumed through aerobic respiration is the net productivity. The difference in dissolved oxygen over time between the bottles stored in the light and in the dark is a measure of the total amount of oxygen produced by photosynthesis. The total amount of oxygen produced is called the gross productivity.

The productivity of an upper tidepool at Race Rocks, as with many aquatic environments, varies seasonally throughout the year. Rain washes down nitrogen and phosphates into the tidepool and increases the productivity. In a lake or river, human activities, such as fertilization of fields and the operation of sewage treatment facilities, can alter the natural balance of nitrogen and phosphates in water. In this lab, you will first learn the technique of using the Oxygen Probe to measure the primary productivity of a seawater sample, and then you will proceed to devise an experiment to quantify net and gross productivity of microalgae from an upper shore tidepool when you have manipulated a specific factor that may affect photosynthesis.

The identification and taxonomy of these organisms can be assisted by the internet site maintained at the University of Montreal by Charles O’Kelly. You should observe them under the microscope and describe their movements. See the Pyramimonas Index–U. of Montreal


Green single celled flagellated algae species from the Race Rocks Tidepools

OBJECTIVES: In this experiment, you will 1. Use a dissolved oxygen probe to determine the level of dissolved oxygen in a sample of sea water.

 2. Measure the rate of respiration in a water sample.

 3. Measure the net and gross productivity in a water sample.

 4.Design an experiment to compare the rate of productivity under two different environmental conditions.

MATERIALS:

Macintosh computer shallow pan
Serial Box Interface nitrogen enrichment solution
Vernier Dissolved Oxygen Probe phosphate enrichment solution
Data Logger( software-built in) scissors
two 1-mL pipettes siphon tube
aluminum foil or black plastic bag thermometer
BOD bottles

PROCEDURE:

This first procedure will be a practice run so that you can understand how the equipment and data logger work.

1.    Obtain a BOD bottle.

2.    The dissolved oxygen probe requires a 10 minute period to polarize before it can be used. Be sure it has warmed up sufficiently before use.

3.    Prepare the computer for data collection by opening EXP23.LXP from the Biology with Computers experiment files. Load the calibration file EXP23.CLB.

4.    Fill the BOD bottle with a sea-water sample from the jar provided.

To fill a BOD bottle

  • Obtain a siphon tube.
  • Insert the tube into the sea-water sample and fill the tube completely with water.
  • Pinch the tube (or use a tube clamp) to close off the siphon tube.
  • Place one end of the tube in the bottom of BOD bottle. Keep the other end in the water sample, well below the surface. Position the bottle lower than the water sample and above a shallow pan.
  • Siphon the water into the test tube. Fill the test tube until it overflows .Fill the BOD bottle completely to the top of the rim. Use the shallow pan to collect any water that spills over.
  • Replace the stopper on the BOD bottle. Be sure no air is in the bottle

5.  Measure and record the temperature of the water sample .

6. Before using the Oxygen Probe, Calibrate it according to the special directions provided by the instructor.

7. Remove the Dissolved Oxygen Probe from the storage bottle. Place the probe into the BOD bottles so that it is submerged half the depth of the water. Gently and continuously move the probe up and down a distance of about 1 cm in the tube. This allows water to move past the probe’s tip. Note: Do not agitate the water, or oxygen from the atmosphere will mix into the water and cause erroneous readings.

8. After 30 seconds, or when the dissolved oxygen reading stabilizes, record the DO reading .

9. Now you are ready to design an experiment to test some variable that affects productivity.

Processing the DATA

1.    Determine the respiration rate. To do this, subtract the DO in BOD Bottle 1(the initial DO value) from that of BOD bottle 2 (the dark bottle’s DO value).

2.    Determine the gross productivity in the BOD bottle. To do this, subtract the DO in the light bottle’s DO value from that of the dark test tube’s DO value.

3.    Determine the net productivity in each BOD bottle. To do this, subtract the DO in the light bottle’s DO value from that of the initial DO value .

THE PLAN FOR AN INVESTIGATION

Now that you understand the basics of recording Oxygen levels with an Oxygen Probe, I expect you to come up with an appropriate controlled experiment for the green algal water from the high tidepools at Race Rocks. You will have two periods to plan what you want to do and to carry out the investigation. You will probably need some extra time as well since the minimum time for Oxygen generation is about an hour.

Develop some hypotheses that you can then proceed to test using the technique.

You must provide a written proposal for approval before starting the actual experiment. Be sure to have this checked and initialled by the teacher before proceeding with the investigation.

Some broad hints and way-out ideas to consider:

1. There may be a connection between primary productivity and pH in a pond. See the video on the use of green ponds to provide sewage treatment.

2. Bottles of green algae hung at different levels in the ocean may provide different levels of productivity.( Or you may simulate this by different light intensities in the lab.

3.Turbidity or nutrient level may effect productivity.

4. Note the collection date of the green water sample on the storage jar: Fresh samples may differ in photosynthetic or respiration rates.

5. We have inorganic fertilizer available in the lab.

6. How much does temperature affect productivity and respiration?

7. From our preliminary measurements of the tidepools, we noticed that high salinity and low salinity were measured in pools that were clear or non-green on the upper intertidal.

8. The pools these samples come from are subjected to heavy rainfall at some times and salt water spray and even submersion at others. I wonder if the organisms and their ability to photosynthesize is affected? – right away— a half- hour later ??

9. If you are going to take a sample, be sure it has been covered with the dark bag for several hours before sampling, as it does not take very much time to saturate the water with oxygen.

10. Be creative: think of all the implications of photosynthesis and take advantage of this opportunity to do a controlled experiment on a specific variable.

11. If you have a good reason to re-sample from the pools, we may even be able to arrange it!

FOR FURTHER REFERENCE:

Race Rocks Transects : Sample

Tidal Levels
Procedures for Processing the Images
1998 Class Photo transects of PEG #15
North side of Great Race Rocks Island
Other transect images from different locations

BACKGROUND

The students and faculty of Lester B. Pearson College which is a member of the United World Colleges have used the ecological reserve and now the MPA of Race Rocks for studies of marine ecosystems, both subtidally and intertidally since1978. During that time a number of exercises have been developed to use in teaching ecological concepts in the International Baccalaureate Environmental Systems and Biology classes.

While using basic research techniques it has been possible to start to build up a library of information that can be more useful for determination of the effects of long term climatic changes or changes induced by humans, (anthropogenic). In addition this record may provide ideas to encourage others to apply the techniques to other ecosystems. In 1999 the Race Rocks Ecological Overview was added to help bring together the ecological information on Race Rocks.

NUMBERING SYSTEM

A numbering system had to be developed that reflected the concept that this was only one of many that could be referenced from this site if individuals from around the world were willing to collaborate with us in building the project.
LOCATION….PEG NUMBER…TRANSECT NUMBER….QUADRAT NUMBER..

A0………………….05………………………..01…………………………………..01………
Where:
A0 refers to the first site to be added to this WWW site
05 refers to the peg location ( we have 15 such locations permanently identified at the Race Rocks Ecological Reserve.)
01 refers to the first transect entered from this location.
01 refers to the first quadrat picture that you can access on this photographic strip.

SOME IDEAS FOR USE OF THESE TRANSECT PHOTOS

  • Quantify the distribution of organisms
  • Relate the distribution to the intertidal elevation
  • Find out how to capture these images
  • Use other technology to analyze the photos
  • Study the mussels in greater depth
  • Study other organisms from the transects in greater depth.
  • Students in environmental systems will use this as a source to prepare for investigations in the intertidal zone when we have the opportunity to do a field lab at the ecological reserve. The photo strips also could be used by those living far from an ocean shore to study the relationship between abiotic or physical factors and organism distribution. Also by noting the location of certain species, for instance the mussels, M. californianus and then seeing where they would fit on a tidal level chart for the area (using the Victoria Tide Tables) ,students could calculate the length of times for submergence and emergence of the species in a week, a month, or a year. In addition they could compare the conditions in the winter months, with the extreme low tides occurring in the night with the conditions in the summer months when the low tides occur every two weeks in the daytime. Students should be encouraged to discuss the results of their investigations and pose further questions about conditions in the intertidal zone. For a more in depth exercise on the Ecological Niche of organisms go here.
  • TIDAL LEVELS Since the location of organisms in the intertidal zone is partially determined by tidal levels, that is one of the essential measurements given with our transect images. It is important to understand that the levels given here are based on the Canadian tide tables
    Victoria Tide TablesThese are not calculated the same way as tables from the United States. To convert the elevations given here to conform to the US pattern in which 0.0 equals mean lower low water, subtract 0.8 meters from these Canadian readings.You may find further explanation on the operation of Tides in any marine Biology or Oceanography text. One that may be useful is:
    Seashore Life of the Northern Pacific Coast– by Eugene Kozloff, page 7-9.
  • For TIDAL Heights of Other LOCATIONS, use this link
  • THIS IS JUST A START!
    By looking here you might get a few ideas of how you can do some interesting investigations using these pictures. But don’t stop there, we would like you to collaborate with us by adding ideas and new transects to our list. It would be excellent if someone living on another ocean shore with different intertidal zonation patterns could supply a similar set of photographs for comparison.Go back to techniques for directions on how to contribute

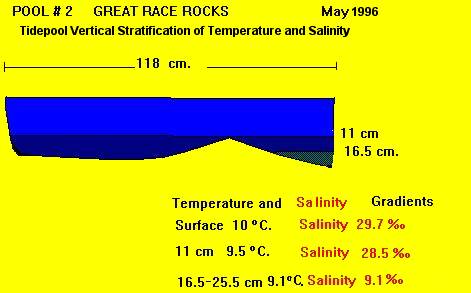
Tidepool #2 at Race Rocks

This file has been started to present some of the information we have accumulated on the pool in order to stimulate students to raise further questions and devise problems that can be investigated at the pool. It is also intended to be part of a cumulative digital legacy that those examining the pool can pass on to future students. A characteristic of the pool that is significant is that it is deeper than most of the other pools and it provides good variations in stratification of temperature and salinity.

Some ideas to consider:
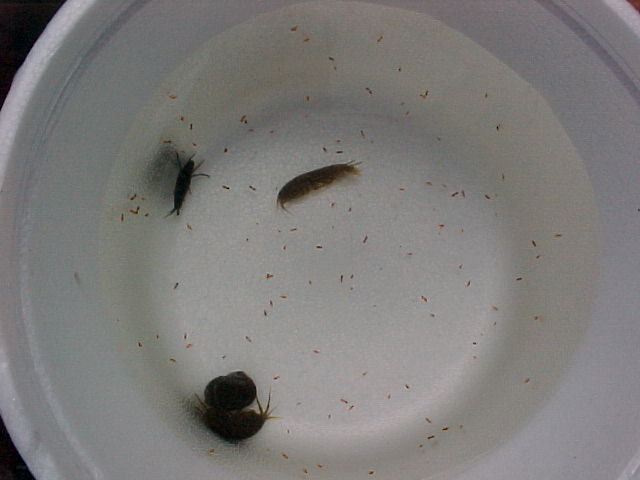
The stratification of Salinity and Temperature in this pool is quite distinct. More work could be done in gathering seasonal records of this. Also, the main organisms, harpacticoids are abundant in the late spring and summer. It may be interesting to identify their source of food, probably diatoms that form a thin layer on the walls. Since the pool only receives new salt water occasionally, temperatures can fluctuate. The pool is however usually shaded by the rock cliff to the South.

Tidepool # 1 – Near Peg 6

This file has been started to present some of the information we have accumulated on the pool in order to stimulate students to raise further questions and devise problems that can be investigated at the pool. It is also intended to be part of a cumulative digital legacy that those examining the pool can pass on to future students.

This pool is located beside Peg #6 and is one of the highest elevated tidepools of the set.

Tidepool Index

USE THIS INDEX INSTEAD

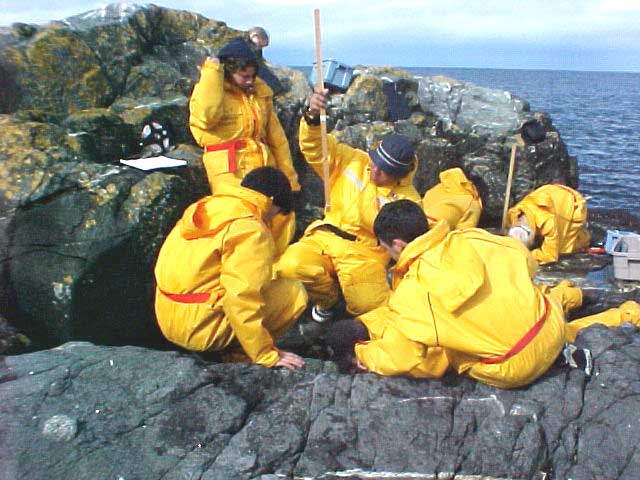
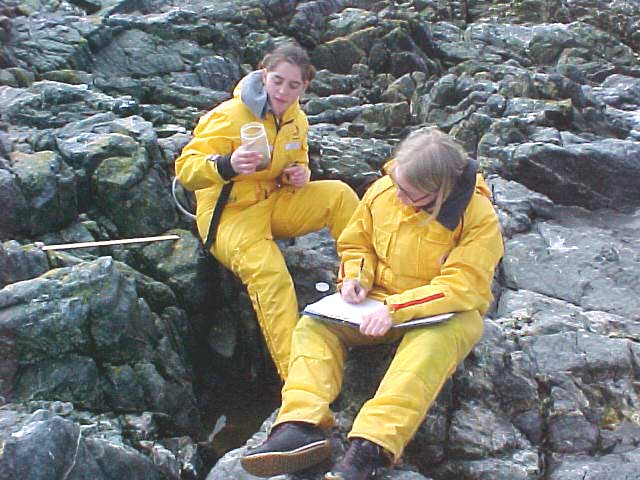
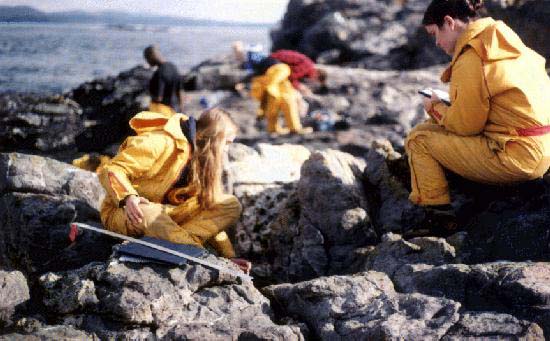
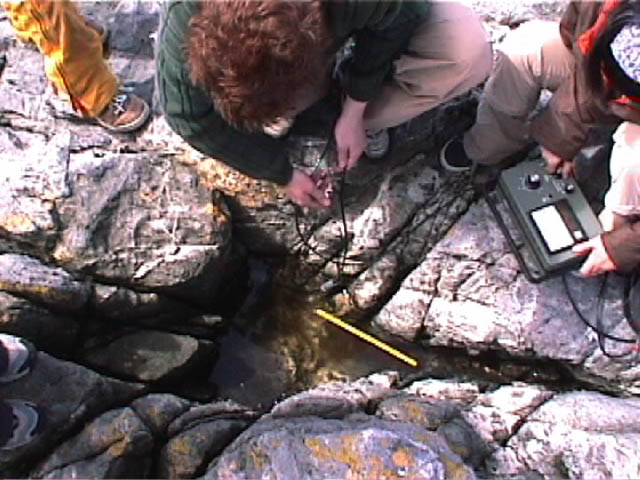
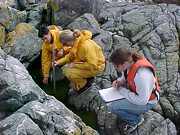
These pools are located 0n the West side of Great Race Rocks. They are located at slightly different elevations resulting in different abiotic factors in the pools and different life forms in the pools as well. Our students brave the elements to get some measurements in this video

Tidepool 1
Tidepool 2
Tidepool 3
Tidepool 4
Tidepool 5
Tidepool 6
Tidepool 7
Tidepool 8
Tidepool 9
not available
Tidepool 10
Tidepool 11  not available
Tidepool 12
Peg 5:
Tidepool 13
artificial

Underwater Transect at Race Rocks

The most difficult transects to do at Race Rocks Ecological reserve are those underwater. Through the years we have done a number of these, mostly in training sessions with the Pearson College Divers.  We experimented with various types of spools for laying out a line, types of weighted line, measuring tape, quadrat sizes, types of underwater paper on clipboards, types of pencils or writing devices  etc.  The best arrangement was using a 30- 50 metre long tape which could be attached to the peg on shore  and then taken out by the diver in a predetermined compass direction. The biggest problem other than the narrow window to get the work done was always the kelp cover, making the process very difficult in the later part of the year when the Nereocystis, (bull kelp) cover would make it impossible to access some areas.   The divers working in pairs would then proceed along one side of the line producing a record of the belt transect.  

Laura Verhegge and students of Pearson College doing an underwater transect off peg #1 at Race Rocks.


_____________________________________________________________

Return to the Contents page for Environmental modelling with Transects..