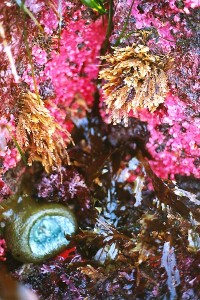
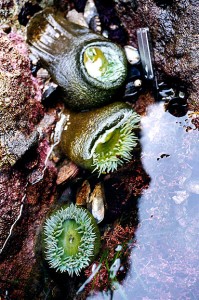
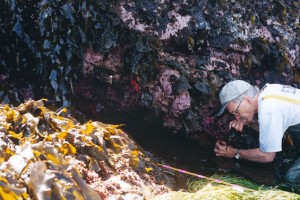
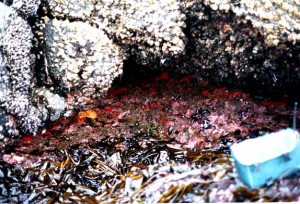
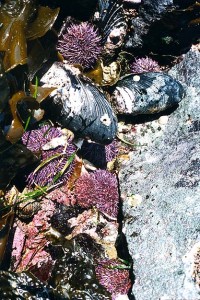
Already by March, the growth of algae on the environmental sensors and the aluminum bar has been prolific. Regular dives have to be made to keep the sensors free of algae. The predominant Genus here is Laminaria.
Category Archives: Ecology
Environmental Impact of the Diesel Energy System at Race Rocks-2001
Some preliminary comments contributed by:
Norm Healy , Environmental Officer, Lightstation Rejuvenation Project
DFO – Canada Coast Guard, Victoria, B.C. 250-480-2723– 2001
The primary reason for investing in alternate, or renewable, energy systems is to reduce environmental impacts.
The negative impacts of existing systems could be summarized as follows:
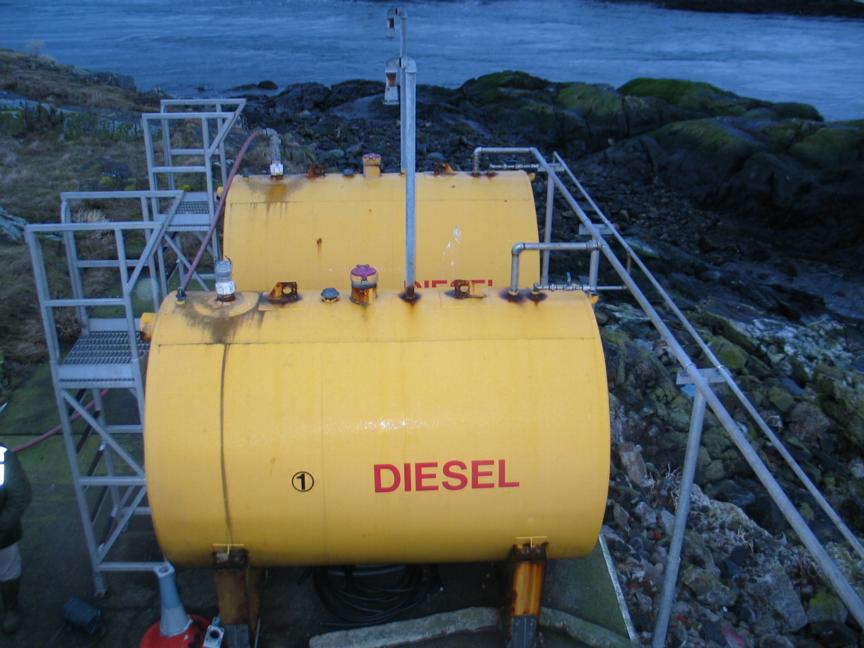 1) On-site diesel storage represents a significant risk.
Historically, these type of storage systems in harsh marine environments have been subject to frequent failure resulting in releases to the environment. The smaller domestic tanks have been as much of a problem as the larger bulk storage for generator engines. The capacity to respond to releases is limited because of the remote location of the lightstation.
2) CO2 emissions:
- Assuming 50,000L/year marine grade diesel combustion (rough average requirement for CCG lightstations) the diesel system contributes about 133,500 kg/year CO2 emissions (Carbon coefficient for distillate fuel (fuel oil): 161.44 pounds of CO2 per million BTU, or 22.29 pounds per gallon, or 2.67 kg/L. (U.S. Environmental Protection Agency, 1999. U.S. Inventory of Greenhouse Gas Emissions and Sinks: 1990-1997.))
- This, of course does not include the emissions associated with, extraction, refinement, and transportation of diesel to the point of consumption. The average US household CO2 emissions for oil heat and electrical is approximately 15,000 kg/year.
3) Diesel exhaust typically includes nitrogen oxides (NOx), volatile organic compounds (VOCs). (NOx and VOCs are ground level ozone pre-cursors, ground level ozone is phytotoxic), sulphur oxides (SOx), polycyclic aromatic hydrocarbons (PAHs), particulate matter (including pm 2.5), and dioxins and furans. The local effects of these emissions are unknown.
Impacts of proposed systems:
A more thorough evaluation is required here. For instance it may be concluded that a tidal energy system would likely have the least environmental impact due to smaller systems required. However caution is advised here. Just because the tidal system requires less physical space, does not mean that it will have the least impact. Potential impacts are determined by both the characteristics of the stressor (including size, but also magnitude, frequency, duration, timing, etc.) and the characteristics of the receiving environment (i.e. sensitivity of species present, habitat quality, etc.).
Ethology laboratory- Sample write-up
Sunny Ashcroft
September 22, 2000
Laboratory: A Sealion Ethology
Aim:
To become familiar with the process of preparing an ethology, including observation over a period of time, proper techniques of observation, and analysis of data collected. Natural animal behavior of sealions will be studied using field observations, and patterns of behavior will try to be identified and quantified using an ethogram and time budget. An ethogram lists behaviors observed by the subject, while the time budget gives the percentage of time that the subject engaged in the behavior.1
Introduction
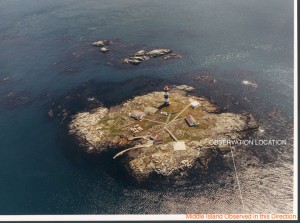
Data for this ethology was collected on Race Rocks, a rocky outcrop housing a lighthouse and several buildings, and now an ecological reserve, located in the Juan de Fuca Strait. Figure 1 shows the location at which the subjects were observed, with field binoculars, and the site of observation.
Figure 1: Photo of Race Rocks showing observation location and site of observation
The group of sea lions observed consisted of both species of sealion found at Race Rocks, California and Steller’s. The observations were taken over the period of one hour, with 6 minutes being allotted to each of the 10 sealions observed, 5 of the subjects being the darker and smaller Steller’s sealions, Eumetopias jubatus, and 5 of the subjects being the pale and larger California sealions, Zalophus californianus. Due to the distance that the observations were taking place, I was unable to identify the morphology of the sealions observed. This particular group of sealions was observed from 12:00pm to 1:00pm on September 15, 2000. The weather was fair, with sun and only sparse cloud cover, and a breeze.
Data Analysis
| Grooming behavior – scratching intermediately looking around, observing grooming (i.e. licking, smoothing self with tongue) stretching |
Observation sitting up on fins looking up at sky looking around |
Making noises Sitting up and random noise making (i.e. non aggressive barking) Socially aggressive no extensive movement of body (excluding sitting up or posturing) opened mouth aggression, may or not be making noise aggressive posturing |
| Movement:aggressive, or because of antagonism involves making noise (i.e. barking) aggressive charging or chasing movement away or towards an aggressor being aggressive towards others |
Movement:not aggressive moving for better position on rock, or sleeping position |
Resting laying down with intermediate head raising or barking yawning |
Part B: Sealion Time Budget
| Number of 6 min. observation periods |
10 | %E. Movement:aggressive | 8% |
| Number of individuals observed | 10 | % F. Movement:non aggressive | 24% |
| Total minutes of observation |
60 | % G. Resting | 13% |
| % A. Grooming behavior |
29 | ||
| % B. Observation | 16 | ||
| % C. Making noises | 8% | ||
| % D. Socially aggressive |
2% | ||
Evaluation
 According to Figure 2 it appears that most of a sealion’s time, in comparison with other behavioral categories identified, is spent grooming (29%). This is followed by non-aggressive movement (24%), and then by observation (16%) and resting (13%). Both at 8% of the observed hour are aggressive movement and making noises. The least part of the sealion’s hour, 2%, was spent in socially aggressive behavior. This data would suggest that at this particular hour of observation, from 12:00pm to 1:00pm, sealions perched on rocks can be said to spend their time at various activities, but that the majority of time is spent grooming, moving non-aggressively (for better resting position), and resting. This behavior can be attributed to the fair weather and amount of sunlight available at this time of the day.This data does not really relate to the energy requirements of the species as the sealions were not observed to be feeding or hunting on or for their food.2 In fact from the data gathered, it might be possible to postulate that the sealions, during that one hour period, did not require much energy at all since they were mostly at rest, and at activities related to their own well being that were not related to hunting or eating. Similarily the data collected also does not shed that much light on the adaptive strategy of the sealion.3 The data collected can be interpreted to say that sealions are adapted to lying and resting on the land, with such motor capabilities and lung capabilities as needed, away from possible predatory sources in the sea.
Several sources of error can be identified in this particular experiment. The first and perhaps most important is the failure of the group to return to Race Rocks at a similar time of day, during the same part of the year, to do another hour of observation of the sealions. This data would have been very beneficial in the compilation of both the time budget and the ethogram and would have made our observations more accurate. The observations, had they been taken during two different intervals, should be made at relatively the same time of day and year to keep the results as accurate as possible, as to relate what that species is doing at that particular point in time, during that time of day.
The sealions observed by the group were of different species. This fact is very interesting. Our observations can then be said to represent the behavior of “sealions” in general, but is not very species specific. To be entirely accurate and precise only one of the species should have been observed for the hour. In that manner our observations could be said to accurately depict the behavior of such and such species at such and such time in the day.
The groups method of recording data is judged to have been fairly good. In a group of two, the 6 min periods of time were alternated between us, and the one partner who was not looking through the field glasses at the subject was recording and timing the observations of the other. This proved to be a fairly efficient and effective manner of recording data. A source of error could be attributed to the amount of time taken for the next observer to pick up the field glasses and locate the new subject of observation. To improve upon this it is suggested that only one person take the observations the entire hour, and the other partner record everything observed. This would eliminate the time gap, but it wouldn’t be very much fun .
The distance at which our observations were taken did not allow the group to identify between the males and females of both species. This is unfortunate and would have added to our data. If we were able to the group should have pre-determined that half of the hour would be given to females of the species, and half of the hour to males. This would have allowed for more accurate and impartial data. The fact that the group was unable to determine the sex of the sealions also gives rise to the question, what other details did we miss out on because of the distance of our observations? If possible, the observations should have been made at a distance where important details could be observed, but the observers would have to keep in mind that they should disturb the natural environment as little as possible. As it was, our distance did not allow for disturbance of the sealions or their environment.
The temperature, wind direction, water temperature, and other related physical statistics about the area of observation were not noted down at the time of observation. The absence of this data is of particular importance when analyzing the reason for the behavior of the sealions being what it is, and why so much time was spent on a particular activity. For instance, I have postulated above that the sealions spent so much time grooming, resting, and moving to get into a better resting position, because the weather was so fair and sunlight in abundance. More accurate observations of temperature and the weather would have assisted in this analysis.
Our group’s method of observing a group of sealions at a particular physical location, with 6 min on each individual, is judged to have been a fairly good one. Our group moved from the individuals in the left of the group to the individuals to the right of the group, one sealion after another, spending 6 min of observation time on each individual. This resulted in impartiality and our data being a representation of the entire group of sealions at that particular hour. The data collected can only be said to represent the behavior at that particular location though:what about those sealions in the water, what are they doing? As this data was not gathered, our observations cannot be said to truly depict an hour in the life of a sealion, only an hour in the life of those sealions that were resting on that rock at that time.
As for the compilation of the data collected, the most objective descriptions can be said to be the sub-points in the categories A through G. The categories themselves, the category titles, and the grouping of the sub-points into their respective categories, can be said to be more subjective. My ability to judge what behavior belongs in which category, for example in the grooming category, which includes both elements of observation and the subject licking itself, I established that grooming behavior appeared to include periods of looking up from one’s grooming and observing one’s surroundings. This is my own personal interpretation, and while it may not be correct, is what I correlate with what I have observed. This makes such categories subjective in manner. Others may not necessarily categorize what I may categorize as a certain behavior the same way. As well my personal method of making an ethogram is quite interesting. I have clearly identified seven behavioral categories that include specific behavioral actions. These are my interpretations of what my group observed. In this way the ethogram itself can be said to be subjective.
Overall the laboratory, and results obtained, are judged to have been adequate for the aim proposed.
Resources“Race Rocks Website https://www.racerocks.ca accessed September 21, 2000
Appendix A,
“Ethology Laboratory“, prepared by Matt Rise
“Sealion Field guide”, http://www.lifestories.com/Spring99/field-guide/seal-field-guide.htm, accessed September 21, 2000
1. sentence adapted from Introduction in “Ethology Laboratory” handout
2. referring to question 7 in “Ethology Laboratory” handout
3. referring to question 8 in “Ethology Laboratory” handout
Turbulence and Mixing Estimates Using a Towed Horizontal microstructure Profiler
Paul Macoun: Turbulence and Mixing Estimates Using a Towed Horizontal microstructure Profiler
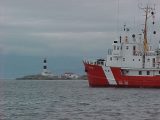
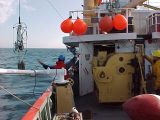
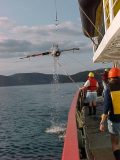
- On August 17, 2000, the CCG vessel Vector made a stop at Race Rocks to conduct research experiments with a focus on understanding mixing processes in the area
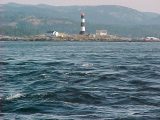
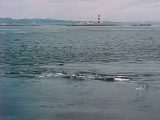
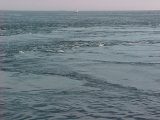
- The Race Rocks Marine Protected Area viewed from the South. Rocky Point and the Metchosin hills appear in the background on the North side.Turbulent surface water in foreground.
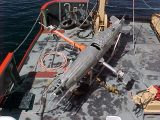
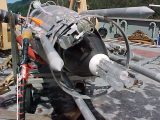
- On board was the Ocean Turbulence Lab’s (OTL) Towed Ocean Microstructure Instrument (TOMI). TOMI gives incite into the mixing processes that redistribute heat, salt and energy in the ocean
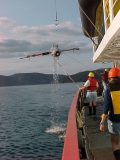
- TOMI was towed west of Race Rocks on the ebb tide and east of it on the flood tide . In these areas impressive surface eddies, upwellings and convergence zones were seen.
- TOMI supports an array of oceanographic sensors. The nose houses airfoil shear probes, thermistors, and conductivity and temperature sensors.
- Other data collected in the Race Rocks area were vertical profiles of the water column. Temperature, conductivity and relevant depth were recorded using a CTD.
- A former Lester B. Pearson College student Paul Macoun, (PC yr15) who is now studying oceanography at the University of Victoria, was aboard the expedition as part of a team of scientists doing oceanographic research. He provided these photos and some preliminary observations
- During both tides, significant levels of dissipation of turbulent kinetic energy were measured. This energy eventually turns, through the cascade of big eddies to smaller and smaller scales, into heat through friction. This vigorous cascade allows for thorough mixing and a measurable re-distribution of scalars such as heat, salt and momentum.
- Upwelling forms on the surface
Turbulence and mixing estimates using a towed horizontal microstructure profiler.
Paul Macoun
The Ocean Turbulence Laboratory
University of Victoria
The Purpose
Mixing is the key element in the redistribution of salt, heat and energy in the ocean. Understanding the mechanisms and magnitude of turbulence and other mixing processes is crucial to the improvement of models that predict oceanic and atmospheric change. Our elusive goal is the parameterization of the vertical fluxes of salt and heat based upon the physics of oceanic mixing processes.
The horizontal profiler TOMI (Towed Ocean Microstructure Instrument) is used to make simultaneous measurements of temperature, conductivity, vertical velocity, and their fluctuations. The measurement of vertical velocity provides a means of estimating the rate of dissipation of turbulent kinetic energy. The respective products of instantaneous velocity and temperature, and that of velocity and conductivity, provide a direct measure of the vertical fluxes of heat and salt.
Simultaneous vertical profiles of current and its shear from a ship mounted ADCP (Acoustic Doppler Current Profiler) provide a means to relate the measured fluxes to the Froude Number and the Buoyancy Reynolds Number over a wide range of these parameters. The efficiency of mixing, the ratio of buoyancy-to-kinetic energy production, reaches 0.5 in near coastal regions and is generally much larger than the value of 0.2 assumed to apply to the open ocean.
This analysis is to be the first task to undertake with respect to the data set collected at Race Rocks on August 17th, 2000. At present, the processing is at a preliminary stage.
The Instrument
TOMI is a towed oceanographic vehicle designed to measure turbulence in both shallow and deep water. TOMI can support a multitude of instruments, from sonar to underwater cameras. Its primary oceanographic and electronic sensors are as follows:
1) Four airfoil shear probes and two fast-response thermistors on the nose.
2) A seabird temperature and conductivity sensor adjacent to the nose probes.
3) A seabird temperature and conductivity sensor, and a flowmeter, on the upper mast.
4) A seabird temperature and conductivity sensor, and a flowmeter, on the lower mast.
5) A pressure sensor mounted mid-body, internally.
6) An inertial motion sensor package, internal.
The sample rates for these instruments vary from 64 samples per second up to 512 samples per second. The airfoil shear probe is a unique instrument that measures the cross-stream component of velocity. The force generated by cross-stream flow bends a tiny ceramic bi-morph beam, which generates a voltage that is amplified and recorded. The motion sensor contains accelerometers and gyros. Its presence is required because of low frequency body motion contamination that finds its way into the shear probe signals. By having a record of the vehicle’s behaviour, the probe signals can be decontaminated through processing.
(Photos to be added)
Return to P. Macoun- Oceanographic Research
A dive with Dr. Scott Wallace for the Discovery Channel,
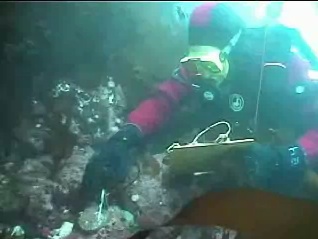 Scott Wallace did research in 1997 and 1998 at Race Rocks with Pearson College divers. He studied the population dynamics of the Northern Abalone,Haliotis kamtchatkana
His research was done as part of a PhD thesis in Resource Management from the University of British Columbia in Vancouver :
Wallace, S. S. 1999. Fisheries Impacts on Marine Ecosystems and Biological Diversity: The role for marine protected areas in British Columbia. Ph.D. Dissertation. The University of British Columbia. Pp. 198.
In May of 2000, he returned to Race Rocks for a dive with Garry and Hana and an interview with Stephanie Paine and Director Julia Nunes for the Discovery Channel. In this video he demonstrates the measurement technique he used in his research.
 Conservation Biology, Vol 13 No 4, August, 1999, pages 882-887.
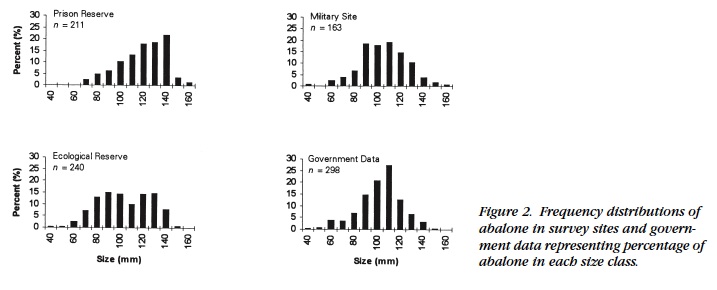
ABSTRACT: :Marine reserves have been suggested as tools for assisting the management of fisheries by protecting vulnerable marine species from overexploitation. Although there is a theoretical basis for believing that marine reserves may serve as management tools, there are few marine reserves in the world in which to test their effectiveness. My research evaluated three forms of marine reserve on the south coast of Vancouver Island, British Columbia, Canada. I used northern abalone (Haliotis kamtschatkana), a severely depleted shellfish in this region, as an indicator of the effectiveness of the reserves. Abalone populations in eight sites receiving different degrees of spatial protection were counted and measured in situ during the spring of 1996 and 1997. In all sites with enforced harvest closures, populations of abalone were greater, and one site with nearly 40 years of protection had on average much larger (older) abalone. Reproductive output, as a function of abundance and size, was also greater in the enforced reserve areas. Larval dispersal from reserves, and hence the benefit to exploited areas, was not formally surveyed. Nevertheless, the results of my study, combined with knowledge of present abalone populations, life history, and regional hydrodynamics, suggest that establishment of reserves is justified in the absence of perfect knowledge of larval dispersal.
This video was taken by Garry Fletcher of Scott as he was involved in measuring abalone at Race Rocks:
Articles published by Scott Wallace:
Wallace, Scott, S. 1999, Evaluating the Effects of Three Forms of Marine Reserve on Northern Abalone Populations in British Columbia, Canada. Conservation Biology, Vol 13 No 4, August, 1999, pages 882-887.
Out of Sight, Out of Mind, and Almost out of Time:
Tidepool # 8 at Race Rocks
This pool is one of the most highly elevated pools in the peg six area of Race Rocks. It has a south-westerly aspect, is relatively shallow (its maximum depth being nine cms). It is also fairly small, having an area of just 0.36 square metres, and a perimeter of 0.39 metres.
At certain times of the year, pool # eight is literally packed with life! Within its confines we were able to locate filamentous diatoms (a brown-gold, highly productive microscopic organism), small barnacles, and red harpacticoids..
On the day of our observations (in late April 2000) we found that the surface temperature was 13.5 degrees Celsius and a temperature at the deepest point 11.0 degrees Celsius. At 5cm, we recorded a temperature of 12.0cm. This is what we would have expected, because the temperature is affected by the heating effect of the sun, and the water forms stratified layers of temperature. These temperatures will vary with the season and time of day. In this relatively small pool, one would expect a large temperature range which will create a large variation in the life-cycles within the pool, changing as the seasons change. For organisms with a longer life-cycle, it will be necessary to have the ability to adapt to a high temperature range.
As temperature decreased as the pool became deeper, we observed the opposite effect with regard to salininty. At the surface, for example, a salinity of 13.5 parts per thousand was recorded, and at the depths, a salinity of 16.5 parts per thousand was found. This is fairly typical of a small, brackish pool in the inter-tidal zone. This is another example of stratification and this variation creates differences in productivity and affect. So we could day that this small pool on this particular day had both a halocline and a thermocline.
(Adapted from a student’s lab write up, 2000)
Some ideas to consider:
Tidepools 7and 8 are very close together, varying only a few cm in elevation. The salinity and temperatures of the pools may vary however. It might be worthwhile to document these variations and propose some explanations for the variation.
Environmental Restoration at Race Rocks
 In 1999, Lester Pearson College was fortunate to obtain the advice of the respected Canadian Environmental Architect Cornelia Oberlander. In a trip to Race Rocks, Cornelia gave us many ideas to help in planning the environmental restoration of Race Rocks. Chris, Garry and Angus accompanied Cornelia to the island.
Cornelia Oberlander with Mike and Carol Slater, the Marine Protected Area Guardians at Race Rocks since 1997. (photos by Angus Matthews)
One of the areas we were having to plan for was the concrete base and cradle which held the seven oil tanks in the old tank farm on the island. Cornelia was adamant that if the concrete could be removed, then it definitely should be taken away in order to restore the site by exposing the underlying rock and allowing for the return of vegetation as much as possible.
Link to the page on the old Tank Farm Restoration Project.
Cornelia agreed with us that we should allow the grass to return to native species wherever possible. Years of cutting with a grass whip had left invasive species such as brome grass thriving, but the native fescues were not being allowed to go to seed.
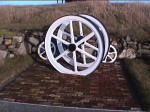 Areas with old artifacts were to be preserved in as natural a setting as possible. She saw that old bricks that we could dig out of debris piles were excellent for keeping grass suppressed in areas around artifacts, while still allowing good drainage of the area. The base of the old flywheel was one such area.
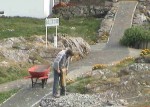
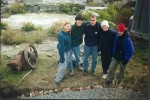 Another area to be set up was against the rock wall above the original concrete foundation of the old engine room. Hannah and Giovanni on one Project week did the digging out of soil, and replacement with crushed rock to create a natural looking corner for the old historic engine room equipment . See this file for the results:
 During the construction of the Tidal Current Project, attention is being given to the mitigation of environmental impact. These files detail some of the methods used.
I
Predation by the Black Oystercatcher….1999
In September of 1999, the students of the Environmental Systems Class collected the shells in the midden surrounding the nest of a pair of Black OysterCatchers at Race Rocks, They analysed the size, species diversity, and species frequency of the shells. The following data and charts are presented in order to provide information about the role of this seabird in the intertidal ecology of Race Rocks.
| Numbers of Shells Collected Near Black Oyster Catcher’s Nest | |||||
| Limpets: Mask, Shield, and Plate | 350 | ||||
| Limpets: Whitecap | 70 | ||||
| Limpets: Fenestrate | 19 | ||||
| Limpets: Rough Keyhole | 2 | ||||
| Chitons: Black Katy | 73 | ||||
| Chitons: Mossy | 13 | ||||
| Chitons: Lined Red | 7 | ||||
| California Mussels | 342 | ||||
| Ribbed Whelk | 5 | ||||
| Amphisia Snail | 1 | ||||
Average Size of the Oyster Catcher’s Food california mussels –5.2875 cm plate,mask,shield limpets–3 cm whitecap limpets 5.2875 cm 3 cm 2.985 cm Size of Oyster Catcher’s Food: Raw Data, in cm
| california mussels | plate, mask and shield limpets | white cap limpets |
| 3 | 2 | 1.7 |
| 4 | 2.2 | 2.1 |
| 4.2 | 2.5 | 2.3 |
| 4.5 | 2.8 | 2.4 |
| 4.6 | 2.8 | 2.5 |
| 4.6 | 2.8 | 2.6 |
| 4.7 | 3 | 2.7 |
| 5.2 | 3 | 2.8 |
| 5.25 | 3.1 | 2.9 |
| 5.3 | 3.2 | 3 |
| 5.5 | 3.4 | 3.2 |
| 5.5 | 3.4 | 3.2 |
| 5.5 | 3.5 | 3.2 |
| 5.8 | 3.5 | 3.2 |
| 6. | 3.5 | 3.3 |
| 6.5 | 3.5 | 3.6 |
| 6.6 | 3.6 | 3.7 |
| 7.5 | 3.8 | 3.8 |
| 7.8 | 3.8 | 3.8 |
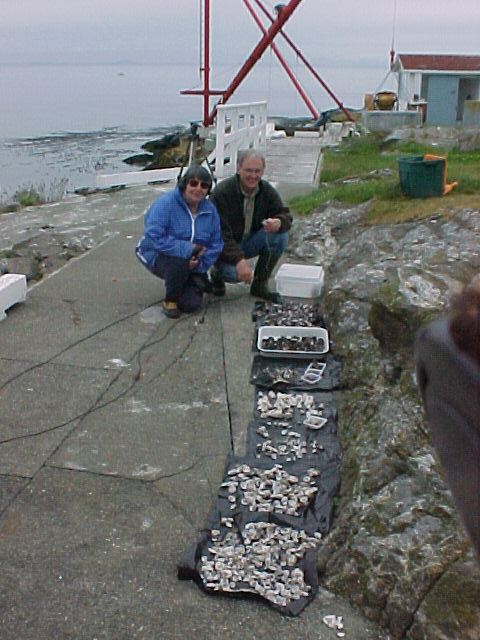
Garry Fletcher and Ecoguardian Carol Slater examining sorted shells of black oystercatcher prey from on midden.


The Race Rocks Ecological Overview Project Identification Information
LOCATION: L.B. Pearson College Library
CALLNUMBER : 577.7 Fle RREO CDROMlor
The Race Rocks Ecological Overview
ABSTRACT:
On September 1, 1998, the Minister of Fisheries and Oceans Canada, the Honourable David Anderson proclaimed the creation of the two first Pilot Study Marine Protected Areas in Canada. Race Rocks ecological reserve was designated as one of those area. As part of the pilot process following this announcement, the Department of Fisheries and Oceans has requested that a complete ecological overview would be done of each of the pilot areas. This metadatabase, the Race Rocks Ecological Overview was designed to assemble in one place a searchable database on the ecological research, education and other activities that have occurred at RaceRocks. Included also are references to the immediate surrounding marine area of the existing ecological reserve, the eastern entrance of the Strait of Juan de Fuca, and the adjacent shoreline of Vancouver Island, in particular the peninsula of Rocky Point. The time frame for these ecological references is from it’s use as an area by First Nations people through its establishment as a light station by the British Navy in 1860, to it’s designation as an Ecological Reserve by the province of British Columbia in 1980, up to the present time, 1999, as a pilot Marine Protected Area. Along with the database, a set of references has been assembled for the primary collection in the Norman McKee-Lang library at Lester B. Pearson College of the Pacific in Victoria. An additional set of reference materials has been made available to Fisheries and Oceans Canada, and CDs of this version are being distributed to workshop attendees. April 19,1999 Race Rocks, Metchosin , British Columbia, Canada
Keywords: Race Rocks, Juan de Fuca , MPA, Lester B. Pearson College,marine park,ecological reserve Author: Garry L. Fletcher
Ackknowledgements:
Many individuals have contributed to the construction of this metadatabase, and no doubt some will be omitted from this listing, but I deeply appreciate all their contributions. Norm Healey of Royal Roads University has played a major role in the design in MSAccess, and in programming the searching capabilities. He has dealt with problems inherent in my original database design and has patiently taught me along the way. For the provision of linked databases, I wish to thank Norm and the Metchosin Environmental Advisory Commission for the MEAC database, the Staff at the Canadian Conservation Data Centre, for the addition of the Database from CDC, and Ron Perkins of IOS for the Race Rocks Salinity and Temperature Database. B.C. Parks, Jacques Marc and Trev and Flo Anderson have kindly made their slide sets available to be catalogued in this database. The RBC museum, and Duane Prentice have also provided their copyrighted slides for the database with a permanent set being made available through our library. Also the switchboard page photo was derived from an image taken by Brent Cooke of the RBC museum. John Ford and Robin Baird provided a large portion of the marine mammal materials, Scott Wallace helped with a workshop presentation and research materials. Dee Walmsley provided contacts for references. Sylvia Roach of Lester Pearson College has provided many hours for the scanning, optical character recognition and html of the major references and the herbarium database. She has also done the OCR and Brailling for the selected references. Bette Kirchner, Pearson College librarian has catalogued the reference data and Jolanta Lisiewicz, has assembled the library references and typed abstracts for the database. Becky Macoun, a former student now in Vancouver has done library research for the database. Chris Blondeau, diving instructor at Pearson College has helped me to free up time by assisting with the diving and with the Race Rocks Schools program administrative duties that have been ongoing. Angus Matthews, college administrator has helped with contacts with First Nations and in making his correspondence and records available. Tom Sampson has assisted in educating us about the role of marine resources of the area in First Nations culture. The administrative staff of Pearson College has provided support throughout the project. Lester Pearson College students of the environmental systems and biology classes have provided me with support throughout the last two months on this project and will have a major role to play in it’s ongoing development and updating. In particular, students Martin Kryl and Victor Rakou helped with scanning and some of the data entry. Cynthia Wright of IOS has helped with editing.. Most importantly, my family has been patient and understanding with my preoccupation in getting the first version of this database completed, and Sarah and Alex have contributed greatly to the data entry in the slide collection.
-Garry Fletcher, April, 1999 —-Lester B. Pearson College
STATUS: Version, 1.5 , Completed Aug 4, 1999-
Updating: ongoing –Bio Dept. Lester B. Pearson College-
PUBLICATION INFORMATION: This publication, The Race Rocks Ecological Overview, Version 1.5 has been produced under Contract F1011-9-06 from the Department of Fisheries and Oceans, Institute of Ocean Sciences, Sidney, B.C.
Copyright 1999 Her Majesty The Queen in Right of Canada as represented by the Minister of Fisheries and Oceans.
Images Copyright 1999 by Lester B. Pearson College except as specifically noted.
ORIGINATOR: Garry L. Fletcher, faculty member in biology and environmental systems at Lester B. Pearson College. (retired 2004)
ADDRESS:
650 Pearson College Drive
Victoria, B.C.
British Columbia , Canada
V9C 4H7
DATE:08/08/99
Intertidal Invertebrates on the West shore of Great Race Rocks
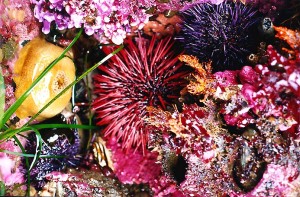
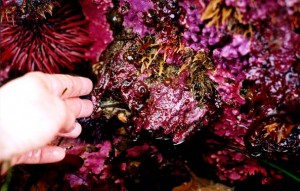
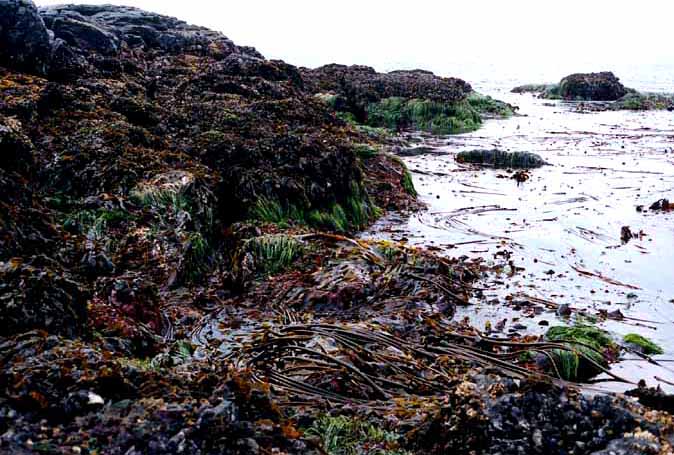 The intertidal zone on the West side of Great Race Rocks as viewed and photographed on June 12, 1999 at a minus 0.1 tide. The predominant macroalgae is Hedophylum sp. although immature bull kelp (Nereocystis luetkeana) is also anchored in this zone close to the shore.
 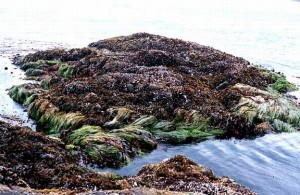 The small island on the North West corner is completely exposed at low tide but submerged at high tide. It contains a rich assortment of hydroids as well as other invertebrates where Dr. Anita Brinckmann-Voss has collected specimens at the zero tidal level.
Small pink dots of a Melobesia mediocris, a calcareous pink encrusting algae which grows as an epiphyte on the leaves of surf grass.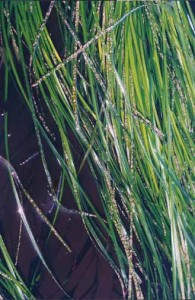
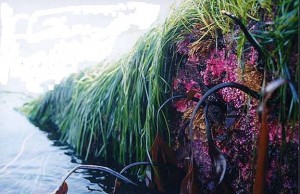 Just below the green fringe of surf grass, Phyllospadix scouleri, pink hydrocorals and other hydroid survive the current and wave swept zone.
|
|||||||||||||||||||||||||||||

