Animal Populations and Behaviors

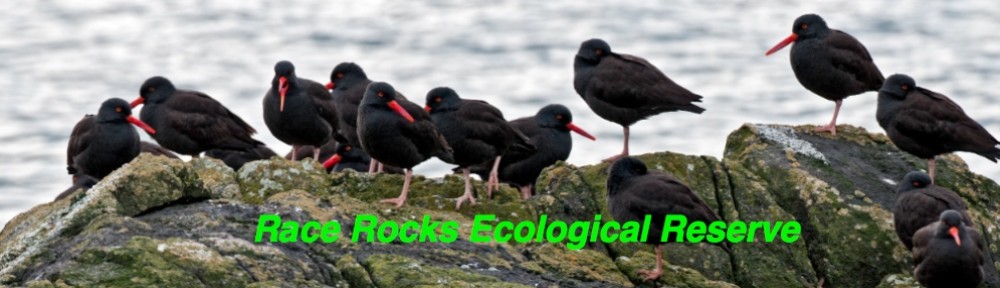
BACKGROUND: In the populations of animals which we encounter at Race Rocks, we see a good representation of the biodiversity of the area. For years we have wanted to get a better idea of the levels of the bird and mammal populations throughout the year and also from one year to another. We have had scientists record the Christmas Bird Count in recent years, but we also need to have an idea of the population levels throughout the year. Scientists can determine the health of an ecosystem by knowing the trends of the populations through time. You have an opportunity here to contribute to the body of knowledge about the changes in populations through time.
Objectives: After doing this assignment, students will be able to:

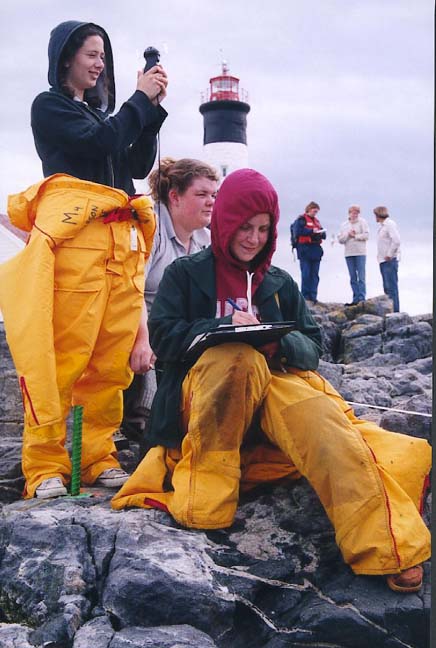
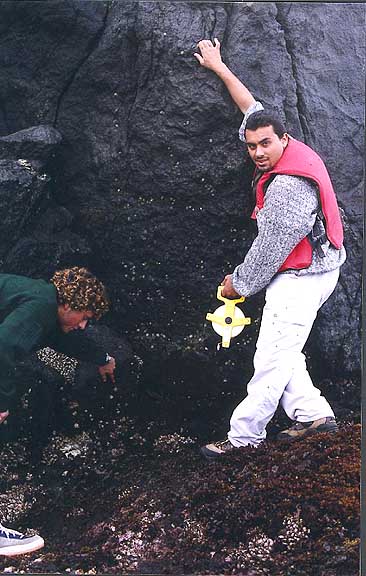
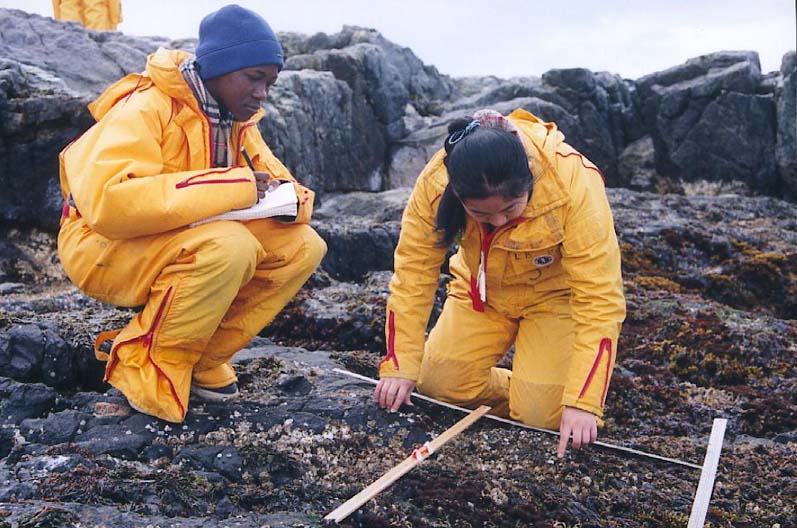
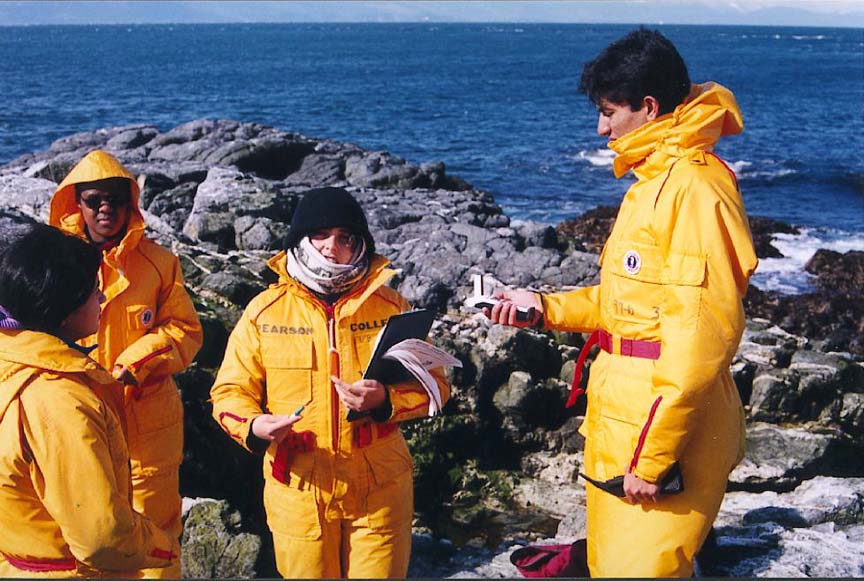
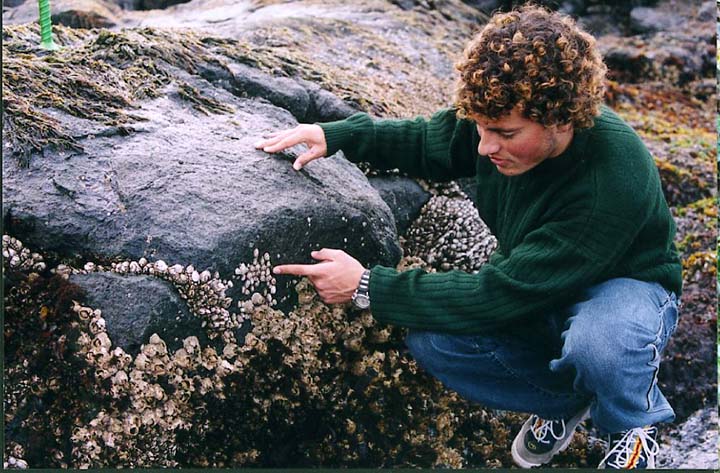
a) Gather census data on populations of animals at Race Rocks using the remote cameras.

b) Use a simple dichotomous key for the identification of species.

c) Analyze the seasonal trends in populations of birds and mammals from Race Rocks

d) Describe the correlations between population trends on a particular day, and climatic conditions.

(If you are on sight at RR) you can document populations of species closeup such as in the surge channel or tidepool areas. Also physical factors such as ph, Salimnity and temperature, along with stratification can be recorded. These change through the seasonsd. If there is no reference file set up for one of the areas , feel free to start one and contribute it here. )

Procedure:

1. Census of Population: We will be estimating the numbers of a particular species in the areas visible from the remote control camera 1 or camera 5 of racerocks.com. Choose a bird or mammal species while viewing the area through camera .Verify the identification of a species observed by using the Dichotomous key for birds and mammals of Race Rocks.

2. Estimate the numbers of individuals of this species in the various sectors of the island visible from camera 5 and or camera 1. Record these in your data book.The ecosystems of Race Rocks are identified below in Table 1.

( You do not need to cover all sectors, however, if you choose a few and monitor them several times, you will get some figures that can be used to establish correlations with time of year, time of day, weather conditions or whatever you define as a possible physical factor that determines population distribution.)

3.Record the location of the population on the Sector maps of Race Rocks. Click on the appropriate image below for the sector designation. Where possible, capture a photo and include it with your data report..

4. Record the weather conditions from the weather page, and indicate weather you think that they have any effect on the population levels and locations.

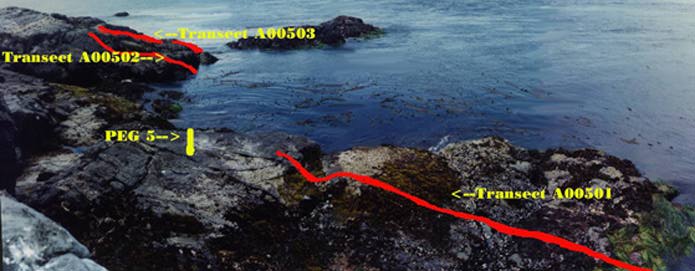
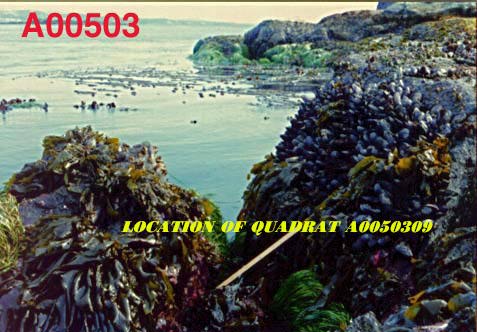
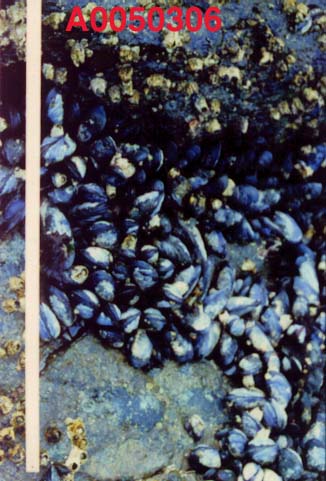
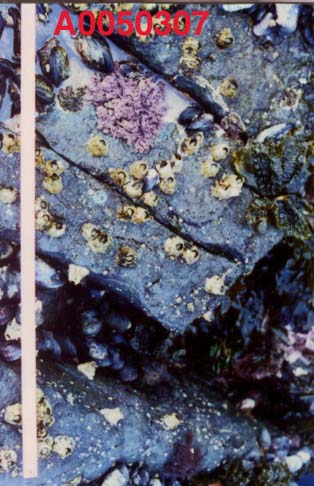
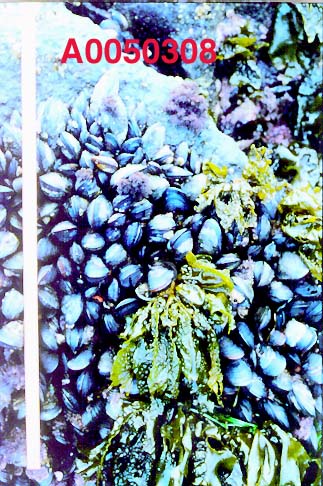
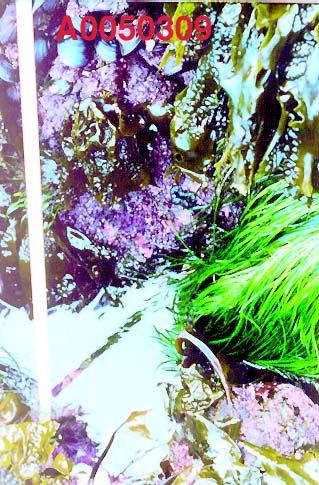
Note: In the table below other sectors not visible from the cameras such as the tidepools have been numbered. If you are doing research on the island you can link to thespecific tidepool file with the number referred to in the list below.
Great Race Sectors from Cam 1 Great Race Sectors Race Rocks Reserve Sectors
Great Race Sector Image Map for Camera 1 views
Click on the pink-outlined polygons to identify the extra views from camera 1 not visible from cam 5.
Great Race Sector Image Map for Camera 5 viewsClick on the red-outlined polygons to identify the views from camera 5. Race Rocks and Race Passage Sector Image MapClick on the red-outlined polygons to identify the outer islands views from camera 5
TABLE 1: Race Rocks Sector Designations:
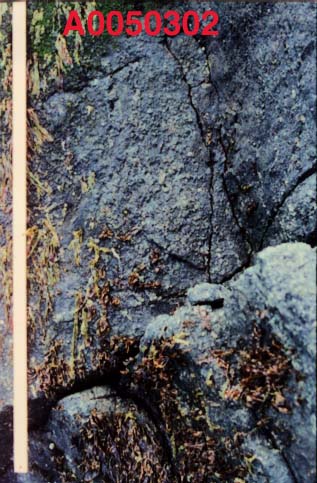
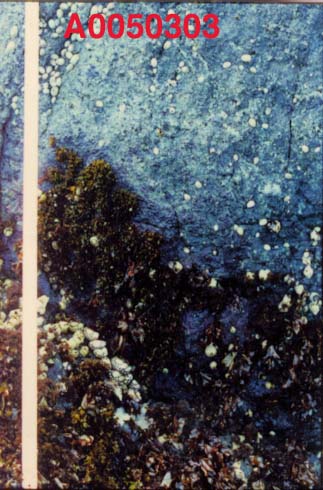
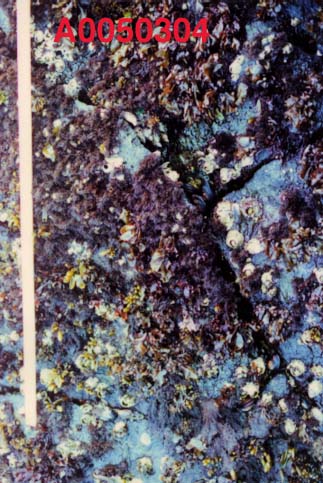
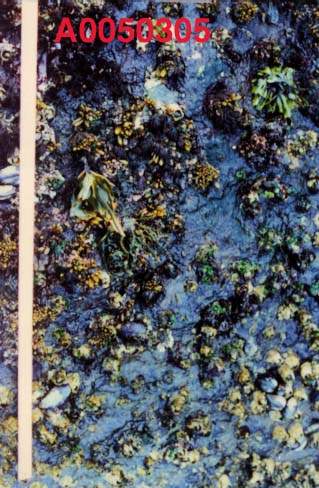
1.0.1.1.8 Race Rocks
1.0.1.1.8.1 Shore and Rock Rise North East of Jetty
1.0.1.1.8.1.1 East Rock rise
1.0.1.1.8.1.1.1 East of House and Bay

1.0.1.1.8.1.2 East shore
1.0.1.1.8.1.3 Water to East
1.0.1.1.8.1.3.1 within 1 km
1.0.1.1.8.1.4 underwater
1.0.1.1.8.28.6 Winch House and grass plain
1.0.1.1.8.28.7 North lawn to dock
1.0.1.1.8.3 Shore North of Jetty
1.0.1.1.8.3.1 Tidepool#14
1.0.1.1.8.3.2 Tidepool#15
1.0.1.1.8.3.3 Tidepool#16
1.0.1.1.8.3.4 Tidepool #17
1.0.1.1.8.3.5 Tidepool#18
1.0.1.1.8.3.6 Tidepool#19
1.0.1.1.8.3.7 Tidepool #20
1.0.1.1.8.3.8 Crevasse
1.0.1.1.8.3.8 underwater
1.0.1.1.8.4 Jetty and Jetty Bays
1.0.1.1.8.4.1 underwater
1.0.1.1.8.5 North Perch by cam 5
1.0.1.1.8.6 West Perch and cliff face
1.0.1.1.8.6.1 underwater

1.0.1.1.8.7 Rain Pools and close foreground -cam5
1.0.1.1.8.8 Heli pad and near camera 5
1.0.1.1.8.9 West shore and tide pool area
1.0.1.1.8.9.0
1.0.1.1.8.9 .1 Tidepool#1
1.0.1.1.8.9 .2 Tidepool#2
1.0.1.1.8.9 .3 Tidepool#3
1.0.1.1.8.9 .4 Tidepool#4
1.0.1.1.8.9 .5 Tidepool#5
1.0.1.1.8.9 .6 Tidepool#6
1.0.1.1.8.9 .7 Tidepool#7
1.0.1.1.8.9 .8 Tidepool#8
1.0.1.1.8.9 .9 Tidepool#9
1.0.1.1.8.9 .10 Tidepool#10
1.0.1.1.8.9 .11 Tidepool#11
1.0.1.1.8.9 .12 Tidepool #12
1.0.1.1.8.9 .13 Tidepool#13 artificial tp
1.0.1.1.8.9 .14 underwater

1.0.1.1.8.10 SW corner by surge channel rock
1.0.1.1.8.10.1 Surge Channel
1.0.1.1.8.10.2 South East Rise
1.0.1.1.8.11 South shore to Engine Room
1.0.1.1.8.11.1 Outfall surge channel
1.0.1.1.8.11.2 Shoreline
1.0.1.1.8.11.3 Underwater
1.0.1.1.8.12 Science House and lawn areas
1.0.1.1.8.13 Tower and Base area
1.0.1.1.8.14 Shore South and East of tower
1.0.1.1.8.15 South Rock Islands
1.0.1.1.8.15.1 Beyond South Rocks to Strait
1.0.1.1.8.15.1 underwater
1.0.1.1.8.15.2 underwater Rosedale reef
1.0.1.1.8.16 South-east rock beach bay
1.0.1.1.8.17 North side of the Keeper’s House
1.0.1.1.8.18 Water channel off docks
1.0.1.1.8.18.1 underwater
1.0.1.1.8.19 Middle Island
1.0.1.1.8.19.1 East islet of middles
1.0.1.1.8.19.2 Main middle
1.0.1.1.8.19.2.2.1 underwater
1.0.1.1.8.19.3 Turbine Channel
1.0.1.1.8.19.3 underwater
1.0.1.1.8.20 North Rock
1.0.1.1.8.20.1 underwater
1.0.1.1.8.21 North to Pedder Bay and Victoria

1.0.1.1.8.22 Race passage to Bentinck Island
1.0.1.1.8.23West ocean view area
1.0.1.1.8.24 West Race Rocks
1.0.1.1.8.24.1 underwater
1.0.1.1.8.25 Strait of Juan de Fuca West and South
1.0.1.1.8.25.1Within 1 km
1.0.1.1.8.25.2 Beyond 1 km

Lesson 2: Animal Behavior.Go to this file for the Animal Behavior lab.
Link to the Reference File for the Census Lab:

Directory of OceanQuest Assignment Resources:

Collage for OceanQuestOverview: Are you prepared to take on the challenge of OceanQuest? You are expected to be an active participant in helping to build a valuable resource database for a unique sensitive environment.

The basic starting resources you will use come from www. racerocks.ca but our vision for the future is that you may actively develop a set of internet resources for your own unique ecological area.

Link to The OceanQuest GIS With Curriculum Guide
NOTE: The link to the GIS which ran on an outside server arranged by the Open School has been discontinued.. The other curruculum materials are still valid however on this site.

Topic 1 :
BIODIVERSITY

Some of the folllowing files from www. racerocks.ca were used in the building of the OCEANQUEST website.
Lesson:Intertidal Race Rocks 1. Structure and Function of Ecosystems :
How can we model ecosystems in order to understand how they work ?
Student Activities: Objectives:
Procedure :
1. Introduction
2. Horizontal distribution

  • Objectives:
    Procedure:

    • 1. Use the remote camera.
    • 2. Use the dichotomous key for identification.
    • 3. Determine the sector from aerial view of horizontal distribution.
    • 4. Field techniques to quantify distribution.
    • 5. Describe the Role of organisms in determining horizontal distribution.
    • 6. Design your own horizontal structure analysis.
    • 7. How do Anthropogenic Impacts affect Biodiversity.
      • Objectives:
        Procedure:
3. Vertical Distribution

  • Objectives:
    Procedure:

    • 1. Use the remote camera.
    • 2. Use the Dichotomous key for identification.
    • 3. Vertical Stratification of Tide Pools
    • 4. Subtidal vertical stratification with seaweed canopy.
    • 5. Vertical Stratification in the water column.
    • 6. Vertical Stratification in Soil
    • 7. Design your own vertical structure analysis.
4. Biotic Components
List of birds and mammals most frequently observed from the remote camera 5.
5. Rare and Endangered Species
6. Coastal Classification System

  • Objectives
  • Procedure:
7. Abiotic Components (Topic 2 below)
8. Ecosystem Function

  • Objectives:
  • Procedure:
9. Biogeochemical cycles

  • Objectives:
  • Procedure:
10. Extension..Other ecosystems– structure and function.


Lesson:
2. Why not Adopt an Ecosystem?
pond Use the internet as a means to get groups to collaborate to provide an educational resource while ensuring the stewardship of their own local ecological resources.
Objectives:
Procedure:
1. Identify the area
2. Establish goals and time lines
3. Establish a baseline inventory
4. Class project to provide a taxonomy
5. Use technology to document the area
6. Monitor for Structure and Function: (See topic 1.)
7. Submit site for inclusion in GIS
8. Obtain tiff-referenced aerial photography
9. Assemble a web-site to carry the information.
10. Create a list of the Ecosystem Services and Natural Capital of the area.

  • Objectives:
  • Procedure

11. Set up a weather monitoring Station


TOPIC 2: ABIOTIC FACTORS
Lessons:Link to Abiotic Factors Assignment 1. Selected Abiotic Factors (such as Barometric Pressure) :

The effects of physical factors on the life of an ecosystem is often taken for granted. Here we give you the chance to investigate some of the unique ways that organisms have evolved in order to adapt to the physical conditions of their environments.

Objectives:
Procedure:
1.Introduction
2. Wind Speed and Direction
3. Barometric Pressure
4. Lightning
5. Change through time: Salinity and Temperature.

  • Objectives:
  • Procedure:
Lessons: bell curve 2. Limiting Factors and the Ecological Niche
Objectives:
Procedure:
1. Introduction
2. GIS activity
3. and 4and 5. Contrast limiting factors in two closely related species.
6. Natural Selection
7. The Ecological Niche as determined by limiting factors
8. Adaptation: A classic study of limiting factors: The Bumpus sparrows.
9. Extension: Central Tendency and Variability.
Topic 3 : ANIMAL BEHAVIOUR
Lessons
Population
1. Population Monitoring:
An activity which allows you to contribute to a scientific database for the census of animals
Objectives:
Procedure:
1. Census of the populations, and the use of the dichotomous key.
2. Race Rocks population numbers and sector designations.
3. Weather correlation to population levels.


2. The Ethology Assignment:
Lessons:Ethology An activity that may allow you to look at the behaviours of animals in a new way
Objectives:
Procedure
1. Preliminary Observation.
2. Collecting Data.. The ethogram and the time budget.
3. Using the dichotomous key for identification.
4. Compiling the Ethogram
5. Preparing the Time Budget
6. Doing a report and submitting results to the GIS
7. Extension material

Higher Level Biology field trip to Race Rocks-April 1999

The Higher Level Biology students traditionally have done several field trips each year to Race Rocks. On this trip in April of 1999, each of the groups in the class were documenting the profile and the populations of organisms along transects they had chosen in the Intertidal Zone.

Transects on the west side of Race Rocks-3

LOCATION….PEG NUMBER…TRANSECT NUMBER….QUADRAT NUMBER..

A0………..05………….01……………01………

Where:

A0 refers to the first site to be added to this website
05 refers to the peg location ( we have 15 such locations permanently identified at the Race Rocks Ecological Reserve.)
03 refers to the third transect entered from this location.
01 refers to the first quadrat picture that you can access on this photographic strip.

Transect A00503

Elevation 3.7 metres

See Transect A0050101
See Transect A0050102
See Transect A0050103