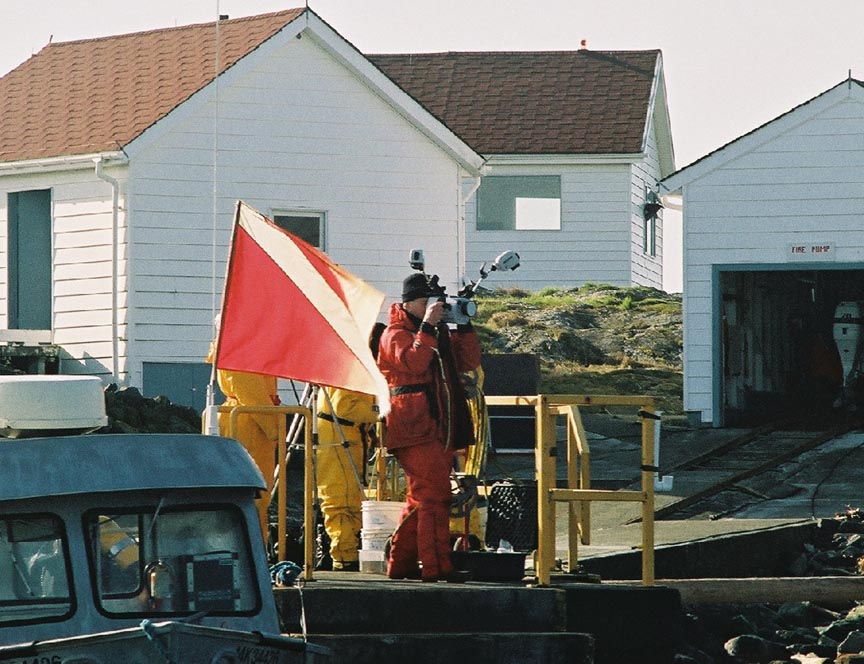
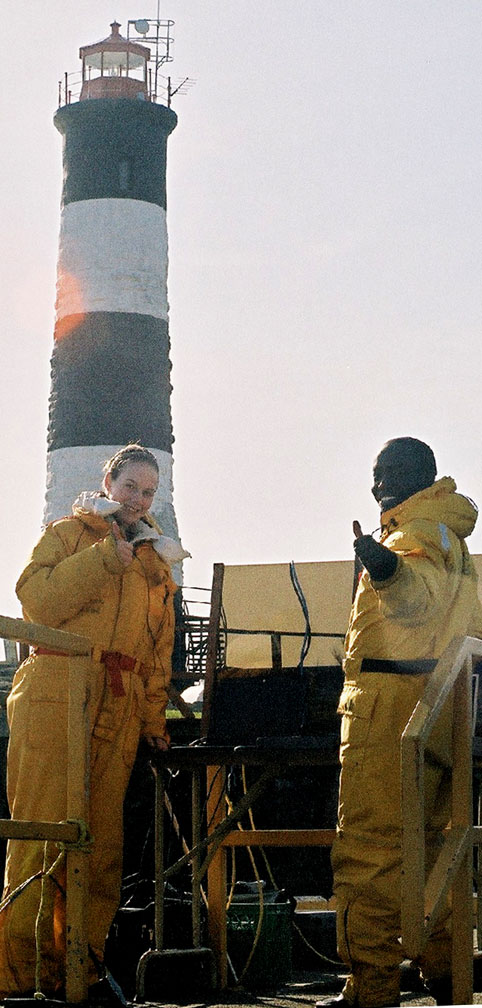
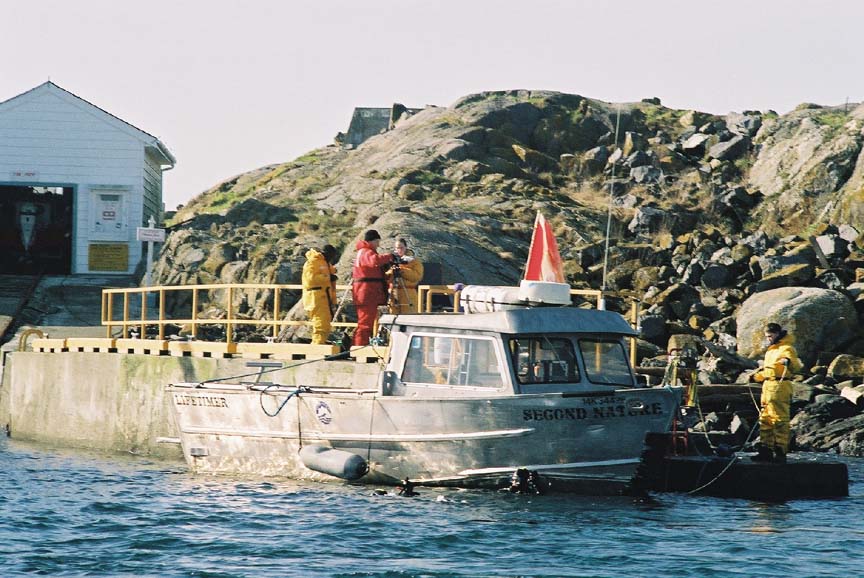
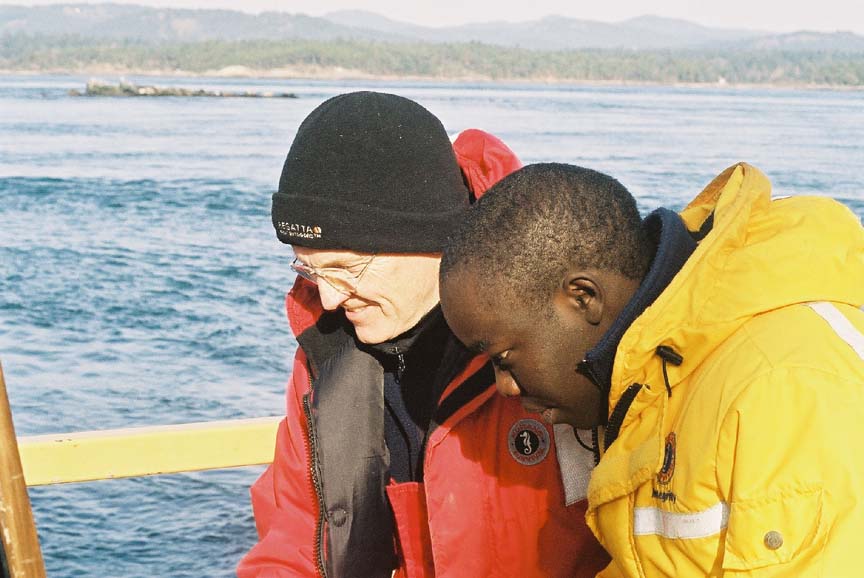
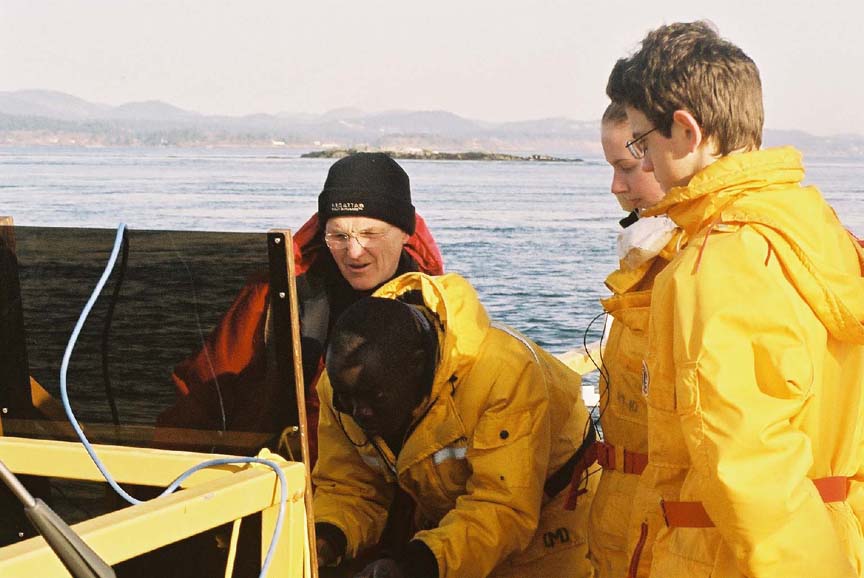
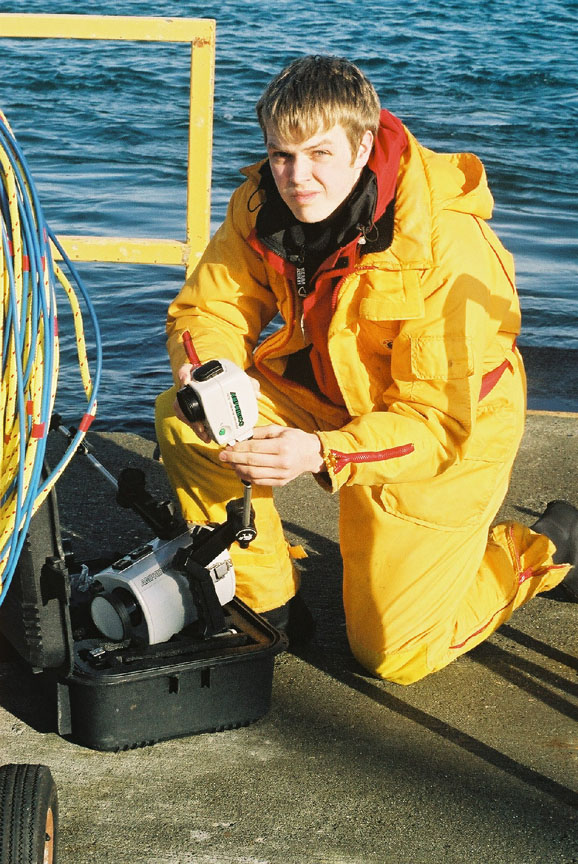
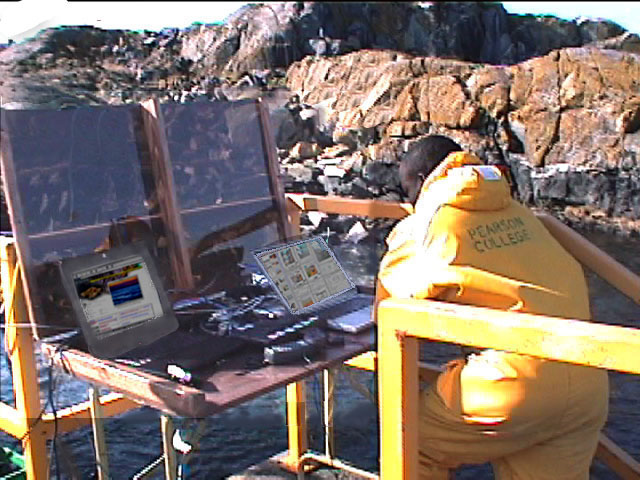
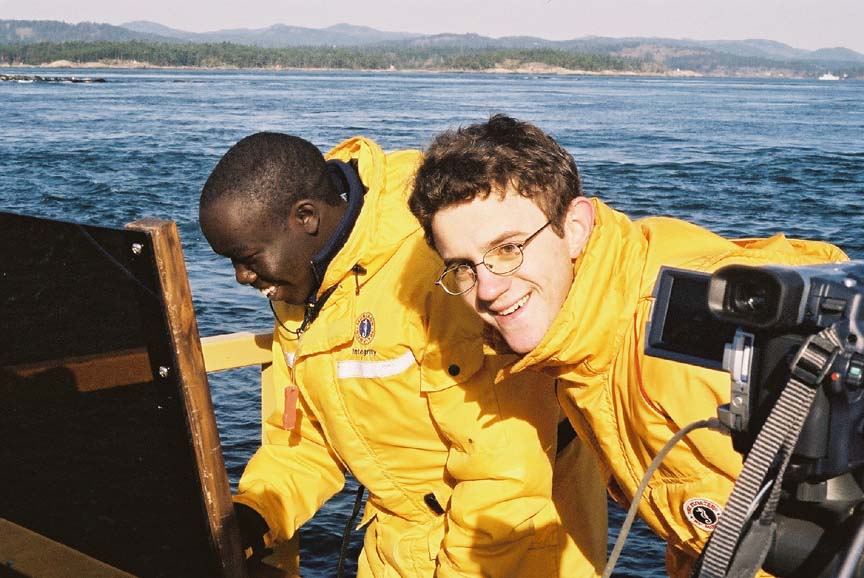
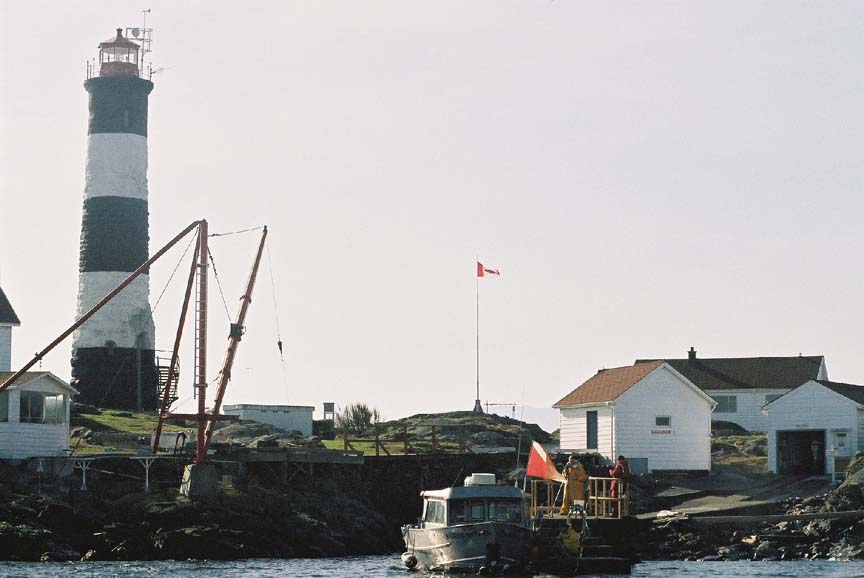
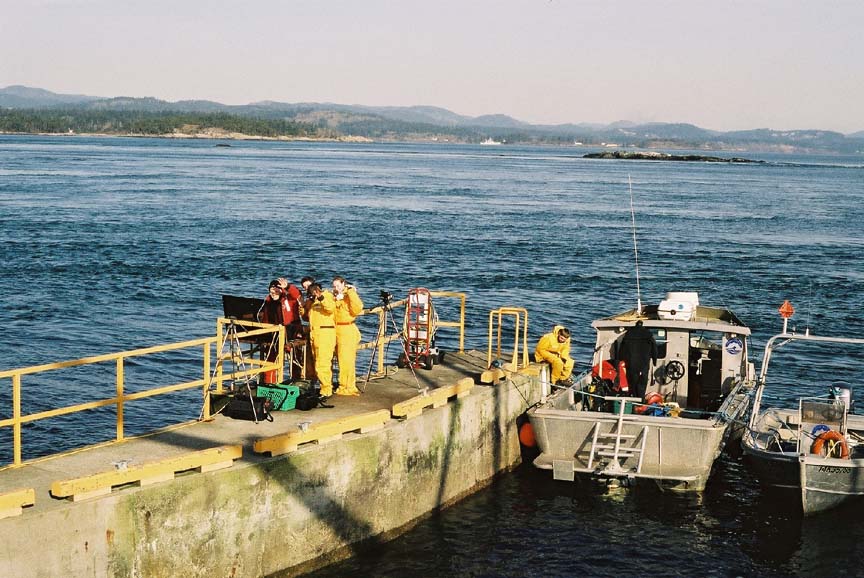
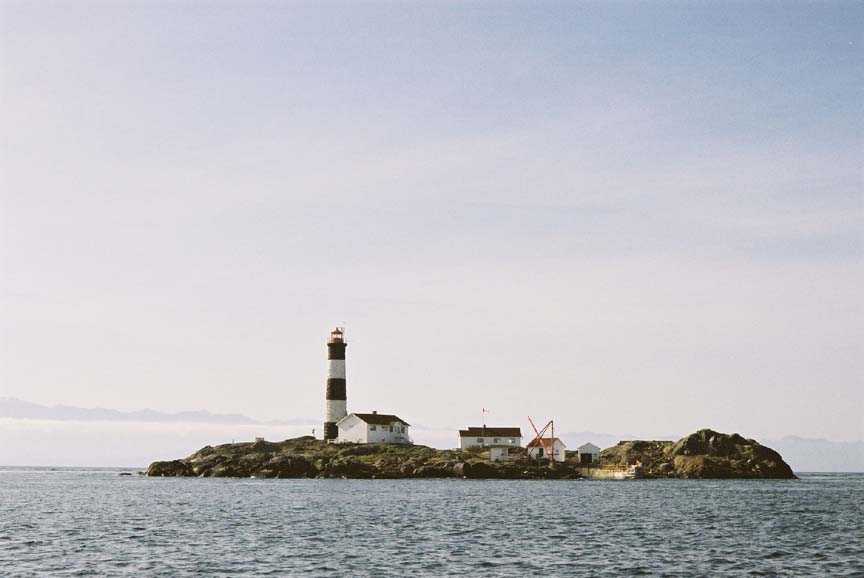
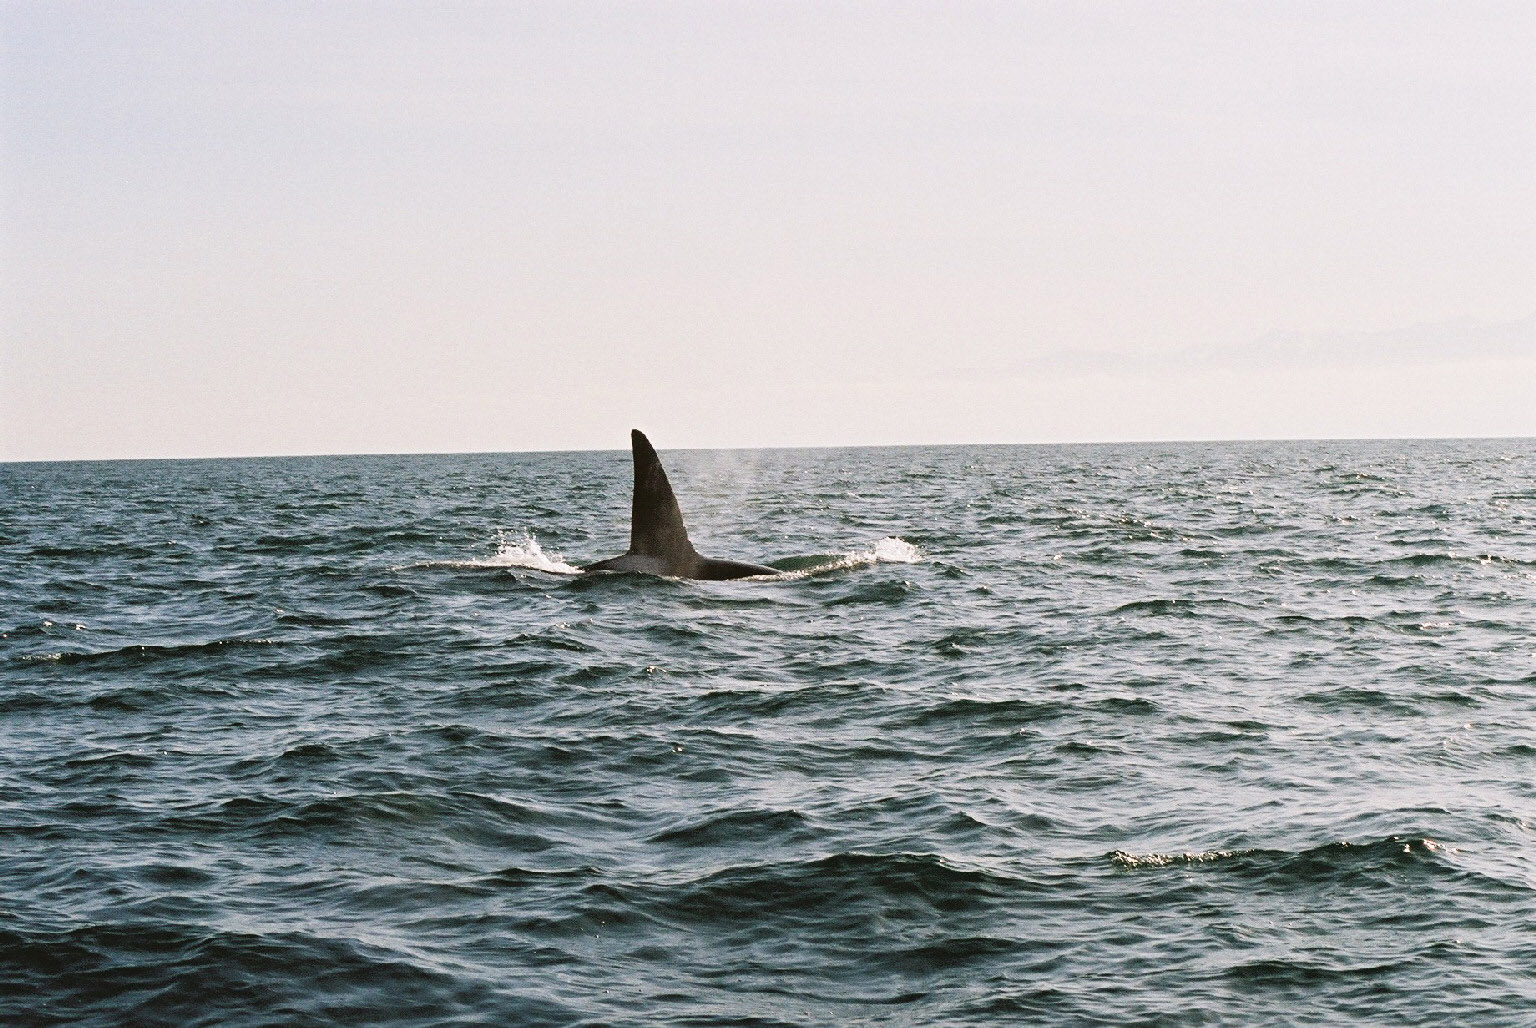
Pearson College students out to begin work project.

Thursday, May 30, 2002
Good Evening
TEMPERATURE: Max. 13.0 C Min. 8.9 C  Reset 11.9 C Rain 0.2 mm
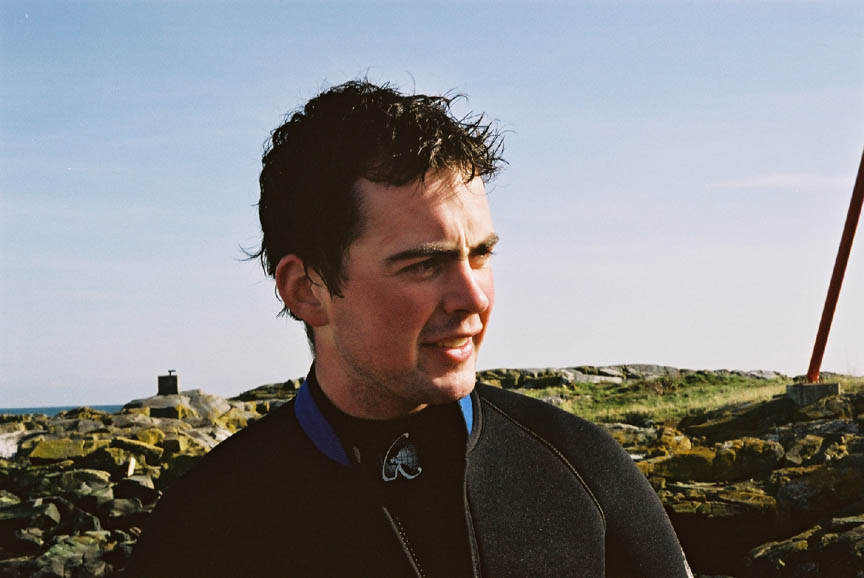
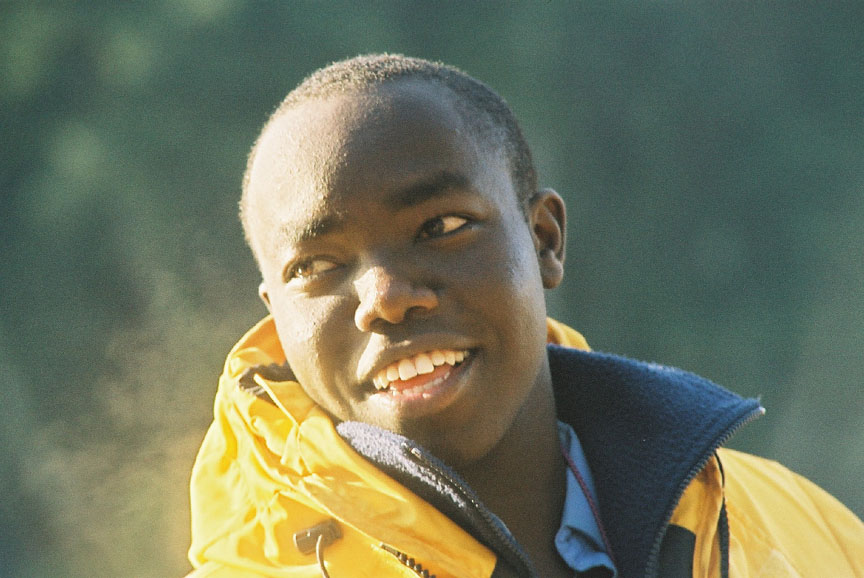
A very good evening to all of you. It has been a bright day out here at Race Rocks and we are looking forward to great days ahead. Our summer project is scheduled to last for 2 weeks. The students out here are Kiprop from Kenya, Ben from Australia, Ryan from Canada, Hiendrick from Poland and Joe from the U.K. We spend the better part of the day planning on a whole range of activities to carry out in the next two weeks. We are going to be carrying out daily live webcasts from Racerocks starting Tuesday. Our divers will also be in a position to bring you live images of marine life from the Race Rocks underwater.
Have a good evening.
Kiprop.
posted by Carol or Mike S at 6:20 PM

Northern and Calif Sealions still here.

Wednesday, May 29, 2002
Good Evening
TEMPERATURE: Max. 13.0 C  Min. 9.3 C  Reset 12.0 C Rain .06 mm
MARINE LIFE: 1 juvenile Bald Eagle which again arrived in the afternoon and made several unsuccessful attempts to land on Great Race.There is a group of about 9 Northern Sea Lions spending a lot of time swimming along the north and east shore of Gr. Race could be the same group I saw and heard in the early hours yesterday.Can hear the California Sea Lions barking off and on during the night,they are hauled out on Middle Rock and the sound carries over this way very well with the westerly.
HUMAN INTERACTION: 2 ecotour boats and 3 pleasure craft. Angus out in Second Nature with group from DFO. Late afternoon Chris out in Second Nature with the students who will be here webcasting etc. A full load with food,supplies and air tanks. Hope the weather gets a little nicer for them.
posted by Carol or Mike S at 6:59 PM

Good MorningWEATHER: Sky Cloudy  Vis. 15 Miles Wind West 15 Knots  Sea 1 – 2 Foot Chop
posted by Carol or Mike S at 5:45 AM

Environmental Systems First Year Exam at Race Rocks

For the last 24 years, the first year environmental systems students have had their final term exam at Race Rocks. In May of 2002, Laura Verhegge continued the tradition with her two classes. They endured the west wind and went through the six stations of the exam. In this video the students and Laura provide the commentary about the investigations.

Return to Education video archive index

enviro-systems field lab exam.

Monday, May 13, 2002
Good Evening
TEMPERATURE: Max. 15.1 C  Min. 7.9 C  Reset 7.9 C  Rain 1.0 mm
MARINE LIFE: 2 mature Bald Eagles -they moved from North Rocks to the Southeast Rocks ever ‘escorted’ by a group of gulls and often a couple of Black Oyster Catchers.There are still no hatched Oyster Catchers, maybe tomorrow. The 3 geese continue to graze the island often the the pair lets the loner within a couple of metres.A group of about 30 harbour seals are spending the day in the east bay area- they like diving into the swells.We see quite a few seals with scrapes that they get moving around on the rocks at low tide.The rocks are covered with thousands of barnacles, these flesh ‘gashing’ animals have very sharp shells – can’t imagine how the seals can get ‘comfortable’ stretched out on top of them but they do!
HUMAN INTERACTION:The Second Nature in ‘bright and early’. Unfortunately the weather was quite nasty this morning -not the greatest of conditions for the students to do their enviro-systems field lab exam.Usually this time of year the exam is a pleasant change from the classroom exams – even some time to relax in the sunshine and eat lunch,even a little socializing but not today strictly ‘business’ ! Late afternoon 3 ecotour boats- not a great day for boating!
posted by Carol or Mike S at 6:09 PM
Good Morning
WEATHER: Sky Cloudy Vis 12 Miles  Wind West 27 Gusting 37 Sea 4 Foot Moderate — With Low South West Swell
posted by Carol or Mike S at 5:49 AM

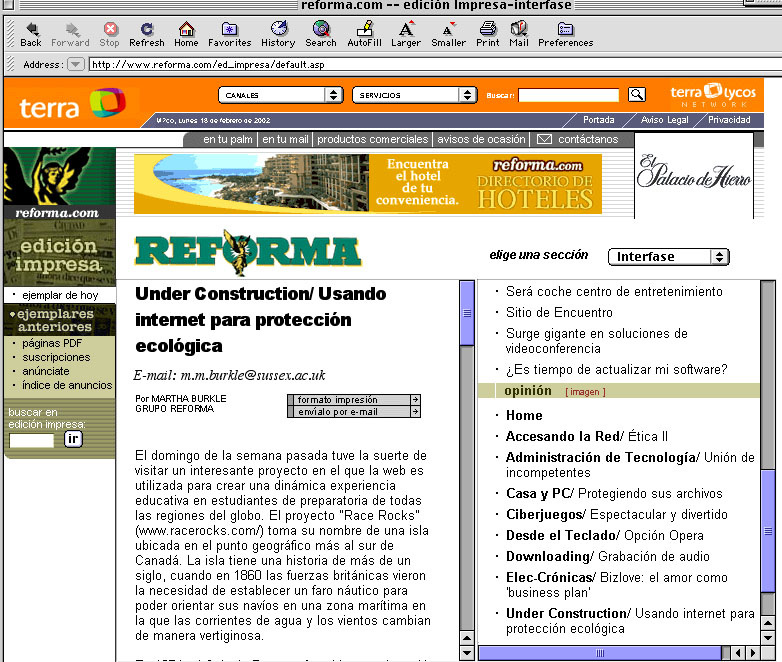
Usando Internet para Protección Ecológica

 Usando internet para protección ecológica
m.m.burkle@sussex.ac.uk

Por MARTHA BURKLE
GRUPO REFORMA


El domingo de la semana pasada tuve la suerte de visitar un interesante proyecto en el que la web es utilizada para crear una dinámica experiencia educativa en estudiantes de preparatoria de todas las regiones del globo. El proyecto “Race Rocks” (www.racerocks.ca/) toma su nombre de una isla ubicada en el punto geográfico más al sur de Canadá. La isla tiene una historia de más de un siglo, cuando en 1860 las fuerzas británicas vieron la necesidad de establecer un faro náutico para poder orientar sus navíos en una zona marítima en la que las corrientes de agua y los vientos cambian de manera vertiginosa.

En 1974, el Colegio Pearson fue abierto en la región de Victoria, Columbia Británica, como parte de un proyecto internacional llamado “United World Colleges” -Preparatorias Unidas del Mundo – (www.uwc.org/uwchome.html).

Fundado en 1962 con el soporte de la ONU, la misión del proyecto internacional es formar a jóvenes entre 16 y 19 años de edad, procedentes de todas las regiones del mundo, en los valores de responsabilidad, vida comunitaria, conciencia ecológica y en la promoción de los ideales de justicia, paz, comprensión y cooperación internacional. A nivel mundial existen solamente 10 colegios como este (dos en norteamérica, uno en sudamérica, tres en Europa, uno en Africa y tres más en Asia), y año con año, estudiantes de preparatoria buscan ser seleccionados entre los 100 mejores (cada colegio admite solamente a cien estudiantes por año), en el aspecto académico y de compromiso con la comunidad.

El proyecto de investigación de ‘racerocks.com’ nace prácticamente con la fundación del colegio de Pearson, al sur de Canadá. Diseñado para proveer contenidos y experiencias de investigación en los diversos programas educativos dentro del colegio, los profesores de Pearson College alimentan la página web con el propósito de motivar en sus estudiantes el interés por la vida marina en la isla.

Utilizando una interesante combinación entre tecnología de punta y cuadernos de notas, los creadores del proyecto (con el patrocinio de Apple y Sony) instalaron cámaras digitales en diversos puntos de la isla para la transmisión en vivo, 24 horas al día, de la actividad marina en la zona. Dos cámaras registran la ecología marina en las costas de la isla, una cámara transmite vida acuática en las profundidades del océano, y una más es utilizada para eventos especiales en vivo. Seguramente usted, querido/a lector, compartirá conmigo cierta fascinación al conocer este único lugar, si visita la web que le permitirá escuchar en vivo los diversos sonidos producidos por focas, leones marinos, elefantes marinos, gaviotas y demás habitantes de la región.

A pesar de ser una red tecnológica relativamente pequeña, la tecnología involucrada en el proyecto de Racerocks.com es bastante sofisticada. Prácticamente todos los aparatos que configuran la red pueden ser adquiridos en el mercado, pero lo que los hace únicos es la original visión que los integró. Ambos, el colegio y la isla, comparten una red local. La infraestructura de la red es provista de velocidad por switches y routers que utilizan módems rápidos para proveer video y audio. Como la isla en sí está ubicada a varios kilómetros de la costa del colegio, era importante que la red tuviera alta capacidad y lograr esto fue difícil. Al inicio del proyecto, tres eran las opciones más viables: el uso de una conexión vía satélite, la transmisión inalámbrica, o la fibra óptica marina.

El proceso de toma de decisión respecto a cual seria la tecnología más propia, tuvo que tomar en cuenta factores económicos y de conservación del medio ambiente. El uso del satélite apareció como una vía muy costosa y poco probable; por su parte, utilizar fibra óptica submarina, era costoso también y además presentaba algunos problemas técnicos y otros involucrados con la protección ecológica del área. Finalmente, la opción del uso de microondas apareció como la más viable.

Radios modelo “Tsunami” y equipos de construcción de la compañía de telecomunicaciones “Glen Tel” fueron adquiridos e instalados en la parte superior del faro náutico en la isla.

Esta mañana, y mientras escribo esta columna, Racerocks.com está transmitiendo en vivo imágenes submarinas desde la isla a un congreso que se lleva a cabo simultáneamente en California. Probablemente lo más interesante de estas imágenes es el hecho de que son los mismos estudiantes, chicos y chicas en edad adolescente, quienes se encuentran ahí, haciendo la transmisión debajo del agua. Los y las estudiantes involucrados en el proyecto, registran eficientemente los cambios ecológicos en la isla, y comparan sus datos con los obtenidos por previas generaciones en el siglo XIX y cuidan de los equipos electrónicos.

México tiene a dos de sus mejores estudiantes de preparatoria en el Colegio de Pearson. Fue emocionante platicar con ellos y ver su compromiso de trabajo y dedicación.

La autora es doctoranda en Políticas de Ciencia y Tecnología en la Universidad de Sussex, Inglaterra

Reprinted with permission of the author.

Webcasting for QuickTime Live

On February 14 , 2002, we did a live webcast for Keith Mitchell of ALI ( Apple learning Interchange) in his presentation at QuickTime Live in Hollywood California. This was the first time we tried out the new webcasting software “LiveChannel” from our new partners Channel Storm.


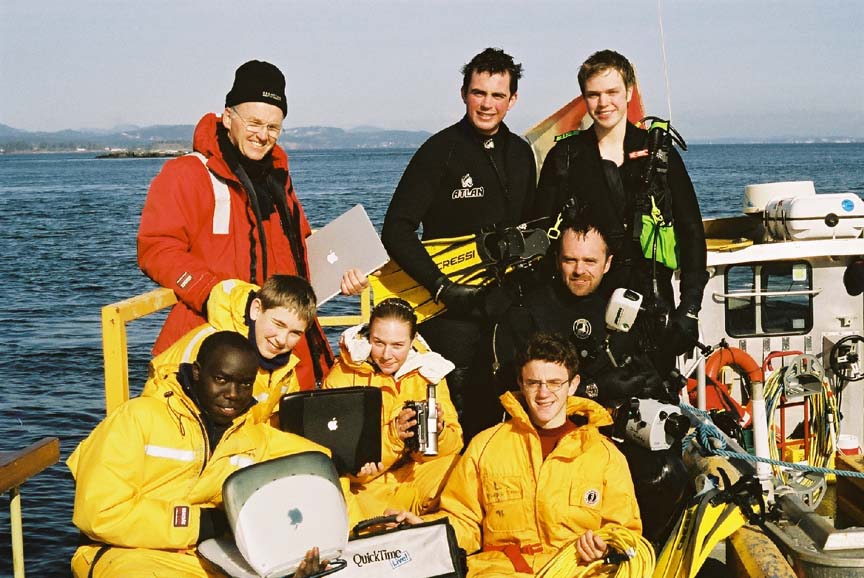
Webcast crew

(L to R back) Garry,Damien, Nigel (L to R front) Kiprop, Ian(visitor), Monica, Olend, Chris . Thanks to Angus Matthews for the photos– Monica claims full responsibility for the commentary on this page!! Also see this write-up which appeared in the Pearson College Newsletter

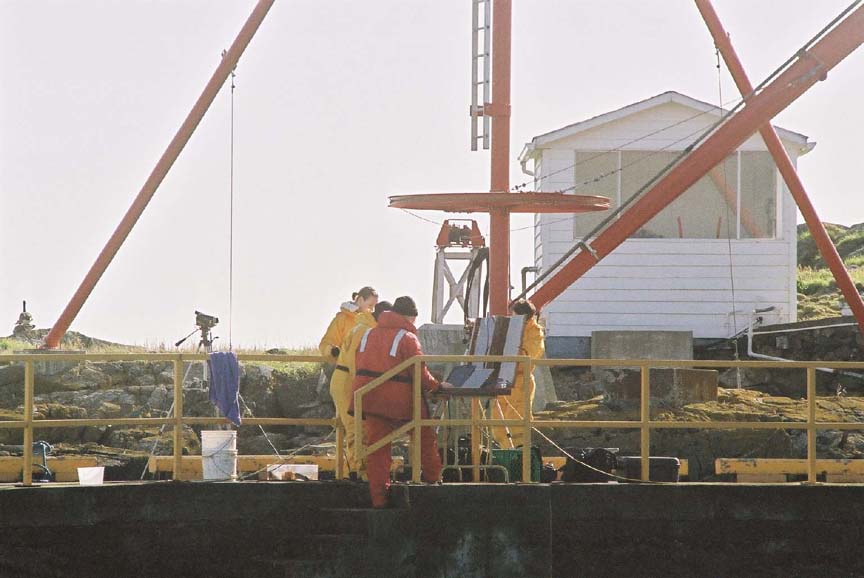
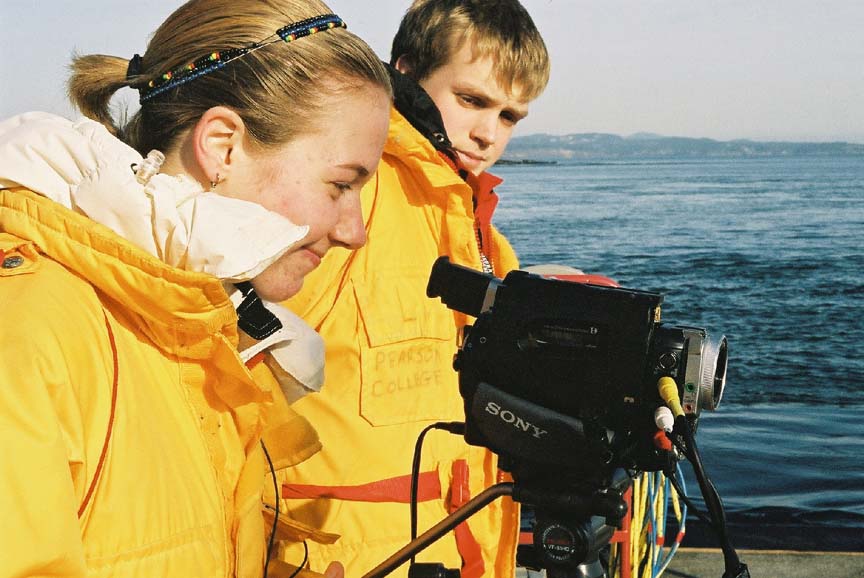
The Race Rocks group setting up before the big day! Monica and Nigel peer intently into the eye of one of the cameras and Garry tests out the underwater cam before the dive, looking a bit like Roger Rabbit in the process.

Webcasting from Under the Race Rocks Waves Direct to an Educational Conference in Hollywood

LIVE AND QUICK IN THE RACE:

WEBCASTING FROM UNDER THE RACE ROCKS WAVES DIRECT TO AN EDUCATIONAL CONFERENCE IN HOLLYWOOD

February 21, 2002. number 13.

Garry Fletcher and the webcasting activity group

On Thursday, Feb 14, several members of our racerocks.com activity group escaped mid-morning to Race Rocks to participate in a live webcast to the QuickTime Live conference in Hollywood, California. You could say they were “on stage Live in Hollywood!” Well , , , almost !

Chris, Damien and Nigel braved an ebb current off the dock to perform for the webcast from underwater . They developed a new technique of hooking themselves to a guide line to ensure we could get out live some good examples of underwater life at Race Rocks, even though the conditions were less than ideal. Garry, Monica, Olend and Kiprop manipulated images and video streams on the webcasting computer top side while they did a test drive of the new webcasting software called “Live Channel.”

“The exciting thing for us” said the students “was that we were able to make smooth transitions between the underwater camera and the camera on the docks while also inserting selected pre-recorded clips and still images.”

“The purpose of this exercise,” added Garry Fletcher, “was to demonstrate to our audience at the conference in California how we can use the technology of racerocks.com in a wide variety of educational applications.”

It was only a week earlier that the decision had been made by the group to go with the amazing, yet so far unproven webcasting software “LiveChannel”. A new partner, “Channel Storm”, a software company from Israel, has been impressed with our work with the live cameras and the Race Rocks web site and has offered to partner with us by providing their software. They came through with last minute advice by long distance and many reassuring e-mails from their software engineers. Further links with our co- presenter from the Apple Learning Interchange, the generous provider of the services of the Akamai network for our video distribution on the internet made all this possible.

“I think our students are beginning to realize what an incredibly unique opportunity they have to pioneer in this area. It just has such a great potential for many educational applications.” continued Garry. “We even use the International Affairs presentations each week with the two cameras to practise some aspects of webcasting and on- the fly editing. Those students who really wish to take advantage of it are able to gain experience with some real cutting edge technology.” The racerocks.com activity is adding a webpage this week to provide images of the venture.

A recent addition to the campus side of racerocks.com is a wireless aerial atop the academic building, just like that used at Race Rocks. This gives an added opportunity to cover wirelessly events from around the college campus, outdoors or in. As spring approaches, watch for notices on the webcast schedule page on the Pearson homepage for short-notice of events.

Intertidal Zonation of Halosaccion glandiforme:

EXTENDED ESSAY IN BIOLOGY
INTERTIDAL ZONATION OF HALOSACCION GLANDIFORME:
A FOCUS ON HEIGHT AND SLOPE AS FACTORS OF ZONATION

LESTER B. PEARSON COLLEGE

ALEX C. FLETCHER

JANUARY 14, 2002

ABSTRACT:
An intertidal study of the organism Halosaccion glandiforme was performed at Race Rocks Marine Protected Area a unique and undisturbed island located seventeen kilometres southwest of Victoria in the Strait of Juan de Fuca . Belt transects from three similar locations on the island were taken from the zero tide level up past the high tide mark. These transect photos were combined with other measurements and calculations to look at the variables influencing growth in the intertidal zone. The intertidal zone is unique in its numerous abiotic and biotic factors that influence life in the region. For the purpose of this study two of these factors were chosen in an attempt to quantify the possible relation that exists between them and the ecological niche of Halosaccion glandiforme. Vertical elevation from the zero tide level and angle of inclination of the rocky shore were compared with population density of the species. While analysis of slope and population density relation proved fairly inconclusive, simple statistical testing showed that a trend does exist between intertidal height and population density of Halosaccion glandiforme.  

Table of Contents

List of Figures and Tables

Introduction………………………………………………………………………1

The Problem

            Purpose and Background of the Study

            Hypotheses

            Limitations  

Review of Literature and Related Research…………………………..……….3

Introduction, Information about the organism

            The Theory

            Research Results in Related Areas

Research Design and Procedures……………………………………………7

The Setting and Population of the Study

            The Experimental and Control Groups Used

            Instruments Used

Analysis of Data…………………………………………………………….…10

Introduction

            Findings that Relate to Hypotheses 1 and 2

            Statistical Analysis

            Findings that Relate Hypotheses 3 and 4

Conclusions and Recommendations for Further Study…………….…….20

Interpretations and Implications of the Findings

            Recommendations

References Cited…………………………………………………………..…..…22

Appendix………………………………………………………………………..23

Transect-peg 5

            Transect-peg 5b1

            Transect-peg 6

List of Figures and Tables

Figure 1.   A small cluster of Halosaccion glandiforme, among barnacles, is shown growing next to a tide pool. …………………………………………………………………………. 1

Figure 3.   Areal view of Race Rocks Marine protected Area. Yellow markers indicate locations of study pegs and belt transect line ……………………………………………… 6

Figure 4. Working with H.glandiforme at the race Rocks Marine Protected Area…………………………………………………………………………………………………………7 
Figure 5.
  This image represents an example of a meter segment from the belt transect (taken from peg 6 at meter 4). …………………………………………………………………….. 8

Figure 6.   This image is an example of a meter segment from a belt transect (peg6, meter segment 4).  ………………………………………………………………………………………. 9

Table 1. Population density (in percent coverage of each meter segment) is shown in relation to the mean
of vertical height of the corresponding meter segment from measurements at peg 5. ………………………………………………………………………………………………………….. 10

Table 2. Population density (in percent coverage of each meter segment) is listed in relation to the mean of vertical height of the corresponding meter segment from measurements at peg 5b1. …………………………………………………………………. 10

Table 3. Population density (in percent coverage from each meter segment) is shown in relation to the mean of vertical height of the corresponding meter segment from measurements at peg 6. ……………………………………………………………………… 10

Figure 7. Graph of data from table one, peg 5.………………………………………… 11

Figure 8. Graph of data from table 2, peg 5b1.………………………………………… 11

Figure 9. Graph of data from table 3, peg 6……………………………………………… 12

Figure 10. Graph of population density in relation to mean of intertidal vertical height with

the three belt transects combined. ………………………………………………………….. 12

Table 4. Table of combined data of the significant values for the analysis of normal distribution from three pegs. …………………………………………………………………… 13

Table 5. Data table of expected normal distribution values and obtained distribution values used in conjunction to perform chi-squared test.………………………………………… 13

Figure 11. Graph of percent coverage vs. vertical height, comparing obtained values to normal distribution values………………………………………………………………………… 14

Figure 12. Graph of peg 5, belt transect terrain profile. ………………………………. 15

Figure 13. Graph of peg 5b1, belt transect terrain profile…………………………….. 16

Figure 14. Graph of peg 6, belt transect terrain profile………………………………… 17

Table 6. This data shows percent coverage in relation to the slope of the intertidal zone. …………………………………………………………………………………………………………..  18

Figure 15. Graph of table 6, the relation between population density and intertidal slope……………………………………………………………………………………………………..18

Introduction

image001

Figure 1. A small cluster of Halosaccion glandiforme among barnacles, ius shown growing next to a tidepool

The Problem:The purpose of this study is to try and quantify certain factors that are a part of the ecological niche of the sea sac Halosaccion glandiforme (figure 1) from the Rhodophyta division. From observing this plant on numerous occasions it is clear that this organism grows in a limited vertical range on the intertidal zone, the threshold between marine aquatic and terrestrial environments. It is likely that a specific physical setting exists for this species, and similarly with other intertidal species, where growing conditions are optimal. The main focus will be to look at the extent to which slope and elevation, in the tidal zone, affect the ideal habitat conditions of the Halosaccion glandiforme.

Purpose and background of the Study

image004

Figure 2. Picture showing Halosaccion glandiforme growing up to but not on a vertical surface.

Similar to all rocky intertidal dwelling species Halosaccion glandiforme is well adapted to survive the dynamic conditions presented in this ecosystem. This zone is characterized by the rapid changes and variability of temperature, light, moisture, salinity, and water movement. The aqua dynamics of the sea sac’s streamlined shape decreases the friction between it and the constantly moving marine waters. H. glandiforme are well anchored to surfaces (usually rock) by strong attachment devices as well as by growing in clusters of its own kind it is more protected. Being a water-filled sac the plant is less susceptible to the changes in moisture and temperature as a result of the tidal waters that are more limiting to other algae such as sea lettuce (Ulva fenestrata) and Purple laver (Porphyra perforata). From observations a growth trend along certain elevations, where the appropriate conditions of moisture and sunlight are found, appears to exist for H. glandiforme and other intertidal species. Also based on observation (figure 2) it seems as though the inclination of rock

surface influences the location of intertidal species including the H. glandiforme. This may be caused by the force of water movement along flatter, less restrictive surfaces, compared to steeper surfaces where friction between rock and water results in turbulence and a rough growing site for organisms. The characteristics and adaptations of each intertidal organism determine its niche. In looking at some of the many determining variables that exist along the seashore we can attempt to quantify this area.

Hypotheses

Hypothetically there is a measurable height at which this alga prospers as well as a preferred degree of inclination for its growth. A higher density population trend along the intertidal zone at this level would represent this.

  1. Ho- There is no significant relation between Halosaccion glandiforme population density and the vertical elevation on the tidal zone.
  2. Ha- there is a significant relation between Halosaccion glandiforme population density and the vertical elevation on the tidal zone
  3. Ho- There is no significant relation between inter tidal angle of slope and population density of the Halosaccion glandiforme.
  4. Ha- There is a significant relation between inter tidal angle of slope and population density of the Halosaccion glandiforme.

Limitations

This study is limited by only taking data at one point in the growing season of the plant and by not having the time to repeat collections of data several times over an extended period of time. The site of study, performed at Race Rocks Marine Protected Area is a prime location for flourishing intertidal life. However, taking measurements and data from three locations in one confined area is limiting in respect to the broadness of the viability of the results. Due to restrictions of time it was not possible to explore further relations and effects of abiotic and biotic factors. In addition many of the highly influential factors (such as wave motion, temperature, etc.) are not easily quantified and are not easily controlled thereby limiting the accuracy and broadness of the study and it’s findings.

Review of Literature and Related Research

Introduction, Information about the Organism

Specific information on Halosaccion glandiforme is limited beyond short physical descriptions and categorization. In Pacific Coastal marine texts Halosaccion is often referred to for its intertidal qualities while actual studies on the plant were not found while researching the topic. Typical descriptions of Halosaccion glandiforme depict the plant as a thin-walled elongated sausage-shaped sac found in the mid-intertidal region of rock dominated shores. The plant is identifiable by its rounded head and short stipe anchored by a small circular holdfast. Also, resulting from the water it contains, applying pressure to the plant produces fine sprays of water emitted from the pores.     In Common Seaweeds of the Pacific Coast (by J. Robert Waaland) it is stated that “Halosaccion glandiforme may reach lengths up to 25 cm and 3 to 4 cm in diameter; typical sizes are about 15 cm long by 2 to 3 cm in diameter.” The maximum length (25cm) is far greater than those studied in this paper. Typical sizes, in the populations and the physical vicinity of the study for this paper, were closer to a range of 1 to 10 cm in length.

The Theory

While theory in the area of inter tidal zone life is limited there is literature that states observations relating to the structured zonation that occurs in the intertidal zone. The slope hypothesis is related to a general description of the influence of shoreline gradient on intertidal zonation provided in Pacific Seashores A Guide to Intertidal Ecology (Carefoot, 1977). “Generally, where the range of the tides is small, or where the slope of the beach is steep, the bands are narrow; where the range of the tides is great, or where the slope of the beach is flat, the zones are wide.” From this statement it is clear that physical factors such as slope are influential on the intertidal zonation and banding of species. In Seashore Life of the Northern Pacific (Kozloff, 1996) it is stated that “On flat-topped reefs and rocks that do not have steep slopes, there should be plenty of Halosaccion glandiforme.” This provides a basis for the concept that shoreline gradient is plausible as a factor influencing the growth of Halosaccion. Therefore such factors of the intertidal zone directly affect the band of ideal growing conditions for organisms.

A theoretical description for universal zonation is presented by Stephenson’s “universal” scheme of zonation (Stephenson, 1949). This scheme is representative of the diverse zonal patterns around the world. It divides tidal shores into five main categories. From highest to lowest is the Supralittoral zone above the tidemark being mainly terrestrial however influenced by spray from waves and ocean mist. Below is the supralittorial fringe that encompasses the upper intertidal zone including the highest living barnacle and lowest limits of lichens. The Midlittoral zone is the whole intertidal area from the most elevated barnacles to the most elevated brown algae. The lowest edge of the intertidal zone represents the beginning of the Infralittoral fringe that continues to the lowest mark visible between waves at low tide. Bellow is the final tidal zone called the Infralittoral zone being almost constantly submerged. In this scheme Halosaccion glandiforme is situated between the extreme high water mark and the extreme low water mark somewhat centrally in the midlittoral zone.

Research Results in related areas

The most significant research results that relate to this paper involve work done on the abiotic features that affect the growth of intertidal organisms. While the research is not specific to Halosaccion glandiforme it is relevant to the intertidal zone occupied by this species.

The primary factor in determining growing location for algae results from the production of their many spores and the conditions that affect where the spores choose to settle. The few spores that survive and continue to develop into their gametophyte forms will only survive if they are in appropriate niche for that species.

There is much research that has gone into the effect of tidal levels and variation on zonation. The theory of zonation is based on the relationship between intertidal zones and tide levels. However it is not “universal” as it has been found (even by the Stephensons) to be inaccurate in certain situations. This comes from the influence of other factors that cause variance between intertidal zones and that must be considered when studying this area. The cycles that tides go through, in accordance with the sun and predominantly the moon, will affect the intertidal zone configuration by controlling the submersion of the intertidal zone and its organisms.

The upper limits of the intertidal zone are subject to temperature fluctuations and other abiotic terrestrial environmental factors such as air movement and fresh water that effect growth. Water retention enables certain species to survive for longer periods of time out of the water and therefore higher in the intertidal zone. The effects of exposure on seaweeds has been studied by Kanwisher (Kanwisher, J, 1957). In his article “Freezing and drying in intertidal algae” he measures water loss in certain algal species of the intertidal area. A brown alga Fucus vesiculosus was recorded as having lost 91% of its moisture to evaporation from solar heat. In laboratory work performed he found that this level of evaporation would occur in a period of about an hour and half. Similarly Enteromorpha linza demonstrated an 84 percent loss of water and Ulva lactuca a 77 percent loss of water when subject to terrestrial conditions. It is likely that the structure of Halosaccion glandiforme, being a water retentive sac, permits for lengthier exposure time with a higher level of water retention.

Light is a very influential aspect on intertidal life and zonation. As the source for photosynthesis it is vital to plant life. However it is also harmful in that ultra violet light can damage plant tissue. The sun’s UV rays can bleach marine plants that spend extended periods of time out of the water.

There is also the factor of competition for growing space amongst the many species and individuals occupying the limited space of the intertidal zone. As well predation and grazing by herbivores will affect the growing conditions of intertidal species.   The abrasive action by waves is a determinate in zonation separating stronger better-adapted organisms from those that are not able to endure the conditions. Some organisms have greater survivability in such conditions through growing in clusters, having streamlined shapes, sturdy holdfasts, and other such features.

Research Design and Procedures
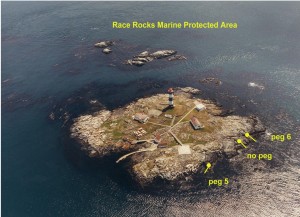
image008

Figure 3, Aerial view of Race Rocks Ecological Reserve. Yellow markers denote location of study pegs and belt transect lines.

The Setting and Population of the Study

The data collection for this study was carried out at Race Rocks Marine Protected Area located 17 kilometres southwest of Victoria in the eastern Juan de Fuca Straight. Of the nine islets in the area, the main rock (with the lighthouse) was the site of this study. Three locations on the West facing side of the island were selected for the belt transects. Two of the three locations were already marked with study pegs, pegs 5 and 6. The other site located in between peg 6 and peg 5 was not pre-marked and is therefore referred to as peg 5b1 for this and future studies. The peg locations are visible in the diagram of Race Rocks (figure 3). The transect photographs were taken consecutively from the waters edge (at low tide, approximately 0m tide) up perpendicularly to a point beyond the intertidal zone. This point varied with each transect as the intertidal zone varies with the height and slope.
image010

The author working with Halosaccion glandiforme at Race Rocks Ecological Reserve.

The Experimental and Control Groups Used  

In using three transect belts the correlation between variables is based on a wider average of results. By setting all three transects to begin at the zero meter tide level they can be accurately compared. In taking the transect belts in proximity to one another they are more likely to be of similar conditions. For example, all three transects were on the same side of Race Rocks facing the same swell and wind directions. Therefore more variables are eliminated that could make comparison amongst them more obscure.

Instruments used

In creating the belt transects, a measuring tape over 10 meters long with markers for every meter was placed along the tidal zone tight to the rocks. The photos were taken along the measuring tape with a Sony Digital Camera. The photos were taken from about 1 meter above the ground (approximately waist height). One photo would cover a section of about fifty centimeters. The photos were taken overlapping the previous so that they could be fit together appropriately at a later time.

With the measuring tape in place the next step was to measure the physical height of the rock slope along the transect line. Height was measured at every 50 cm interval. A meter stick would be held perpendicular to (for example) the 1 meter mark and the 1.5 meter mark. By placing a third meter stick with a liquid level attached perpendicular to the initial stick and butting up horizontally to the second stick the difference in height was obtained.

These values were recorded in a chart and then used in the making of a height and slope outline graph of the rock surface at the transect belts.  In collating the individual transect photos into one cohesive transect belt the computer imaging program Adobe Photo 4 was used. After splicing the pictures appropriately the meter marks were marked by a line and each cluster of Halosaccion glandiforme was outlined for further analysis (figure 5).
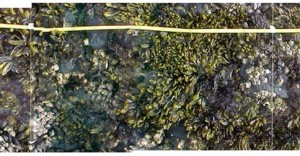
image013Figure 5. This image represents an example of a meter segment from the belt transect (taken from peg 6 at meter 4). The measuring tape is visible as yellow line at the top of the image. The meter segments can be seen marked by white vertical lines at the sides of the image.

Further computer analysis was carried out using Scion Image for Windows. This program provided the capability of measuring the population density of Halosaccion glandiforme along the transect belt. The area of each transect section was measured scaled to the according meter segment length. Each meter section on the belt transect varied slightly from the others, as did the area of each meter segment. This is because of discrepancies in the distance between the camera and the shore, a source of error that is hard to avoid completely with such rough rocky intertidal terrain. Finally the total area covered by Halosaccion glandiforme clusters, as seen outlined in orange (figure 6), was measured in each meter segment. When compared to the corresponding area measurements of their meter segment the population density of Halosaccion glandiforme could be determined as a percentage covering of that area.
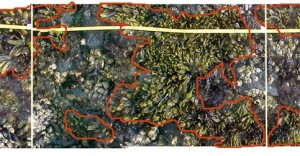
image015Figure 6. This image is an example of a meter segment from a belt transect (peg6, meter segment 4). The orange outlines represent the area covered by Halosaccion glandiforme. With measurements scaled to the according meter as presented by the measuring tape the area of the meter segment and the Halosaccion coverage was calculated and compared.(For complete belt transect of peg 6 see appendix.)

Analysis of Data

Introduction

With the data obtained from the belt transects of the intertidal zone the results of height and population density were compiled into tables and subsequently graphs to represent the possible relation. Also the data for the effect of surface slope on population density was converted into a graph.

Findings that relate to Hypothesis 1 and 2

Transect meter segment Mean of height Percent coverage of area
1 0 0
2 35 0
3 60 0
4 85 3.4
5 115 60.9
6 145 89.6
7 170 1
8 165 14.1
9 200 0

Table 1.  Population density (in percent coverage of each meter segment) is shown in relation to the mean of vertical height of the corresponding meter segment from measurements at peg 5.


Transect meter segment Mean of Height Percent coverage of area
1 5 0
2 17 0
3 21 0
4 70 1.6
5 110 23.8
6 160 46.8
7 190 10.7
8 230 0

Table 2. Population density (in percent coverage of each meter segment) is listed in relation to the mean of vertical height of the corresponding meter segment from measurements at peg 5b1.


Transect meter segment Mean of height Percent coverage
1 2 0
2 50 0
3 132 26.6
4 170 49.5
5 190 0
6 203 7.1
7 210 1.4
8 230 0
9 258 0

Table 3. Population density (in percent coverage from each meter segment) is shown in relation to the mean of vertical height of the corresponding meter segment from measurements at peg 6.image019
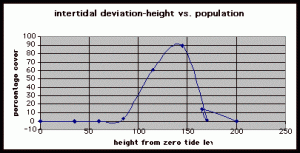
Figure 7.  Graph of data from table one, peg 5. This figure represents the relation between population density (in percent coverage from each meter segment) and vertical height.image022
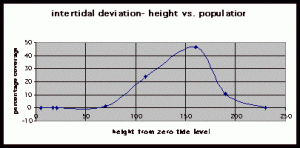
Figure 8. Graph of data from table 2, peg 5b1. This figure represents the relation between population density (in percent coverage from each meter segment) and vertical height.image025
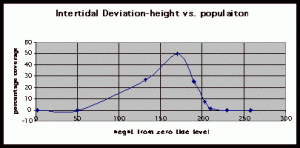
Figure 9. Graph of data from table 3, peg 6. This figure represents the relation between population density (in percent coverage from each meter segment) and vertical height.image028
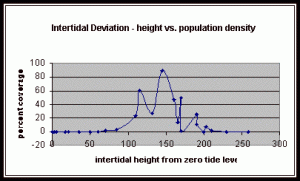
Figure 10. Graph of population density in relation to mean of intertidal vertical height with the three belt transects combined.

Statistical Analysis

Vertical height Percent coverage
70 1.6
85 3.4
110 23.8
115 60.9
132 26.6
145 89.6
160 46.8
165 14.1
170 49.5
170 1
190 25.4
190 10.7
200 0
203 7.1
210 1.4

From the compiled data the significant values, those values that fell within the extremes of the range of population occurrence (table 4), were used for further analysis by means of normal distribution calculations. To test the obtained values against the values expected of a normal distribution curve a graph (figure 11) was produced.   Of the fifteen obtained values for vertical height the mean is 154.33 meters. Therefore the standard deviation is 43.71 meters from the mean. In accordance with a normal distribution the first standard deviation (from the mean to 110.62 and 198.04 cm) is expected to hold 34% of the values. At the second standard deviation (at 110.62 cm and 241.75 cm) 13.6% of the values are expected to be present. Finally the third standard deviation (at 23.2 cm and 285.46 cm) is expected to contain 2% of the values. With 15 values in this data set (table 4) the expected number of values for each deviation can be calculated from the expected percent (table 5).

Expected percent 2% 13.6% 34% 34% 13.6% 2%
Expected 0.3 2.04 5.1 5.1 2.04 0.3
Observed 0 3 3 6 3 0

Table 5. Data table of expected normal distribution values and obtained distribution values used in conjunction to perform chi-squared test.

The chi-squared statistic was calculated from this table (table 5) as 2.864. When this number is checked with the chi-square distribution table at five degrees of freedom it falls bellow the critical 95 percent value of 11.1. Therefore, there is a 95 percent certainty that the results fit the expectations and that the obtained values represent a normal distribution.

Findings that relate to hypotheses 3 and 4

To obtain the angle of inclination for the terrain of the belt transects it was necessary to create three graphs (figures 12, 13, and 14) from the height measurements (see Instruments used) taken along the three transect lines. With the use of a protractor the angles were extrapolated from each graph (table 6). The angle measurements represent the mean of inclination for each meter segment from each transect. The calculated angles were compared to the percent coverage values that they represented. The angles are only calculated from the meter segments where a significant population density of Halosaccion glandiforme is present as slope will only be influential in the identified zone where H. glandiforme usually grows. Therefore it is mainly from the 100cm to 200cm vertical height sections of each transect belt that angle of inclination is measured.

Figure 11 (To be scanned and added later)

Figure 12 (To be scanned and added later)
Figure 13 (To be scanned and added later)
Figure 14 (To be scanned and added later)

Angle of inclination Percent coverage
10 25.4
10 49.5
15 46.8
15 89.6
15.5 60.9
20 23.8
20 10.7
21 26.6

Table 6. This data shows percent coverage in relation to the slope of the intertidal zone. Slope is measured to represent the mean slope of each meter transect segment. Slope is only taken from the segments of the three transects where there is significant population density of Halosaccion glandiforme. Therefore it is mainly from the 100cm to 200cm vertical height sections of each transect belt.image031
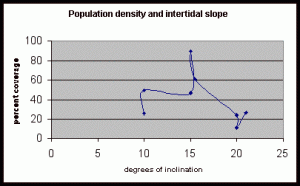
Figure 15. Graph of table 6, the relation between population density and intertidal slope.

Conclusions and Recommendations for Further Study

Interpretation and Implications of the Findings

The three individual transect graphs (Figures 7, 8, and 9) show a trend between the relationship of vertical intertidal height and the population density of Halosaccion glandiforme. The majority of Halosaccion glandiforme were found to grow between vertical heights of 100 cm and 200cm from the zero tide level. The highest recorded level of population density in each belt transect varied slightly, ranging from 145 cm vertically to 160 cm vertically. When the distribution of obtained values for height and percent coverage were compared to the normal distribution it was found that the observed results fit with 95% confidence of the expected. This suggests that the observed results are not distributed by chance occurrence but are due to a trend. The null hypothesis (Ho) is disproved and the hypothesis (Ha) is accepted, as a significant relation does exist between Halosaccion glandiforme population density and the vertical elevation on the tidal zone. It is important to place this in context however as the results are based on data from a close proximity as to decrease the variability of results. It is likely that H. glandiforme populations even on the opposite side of Race Rocks, subject to different lighting, swell action, and other possible conditions, could demonstrate a different set of results.   Therefore this part of the experiment could be repeated and produce similar distribution results in the same vicinity and perhaps exhibit similar trends in a wider range of locations.

The slope percent coverage relation graph needed more data taken at more specific intervals to produce significant results. Since this relation could only be studied at heights where predetermined growth was expected it limited the data to eight significant values.   The graph suggests that growth is optimum on gradients of 10 to 20 degrees with the higher population densities at 15 degrees. Yet this is not reliable as it is clear from the terrain profile graphs (figures 11, 12, and 13) that there is not a great level of variance in shoreline slope at the sites of the belt transects. There was no data collected from terrain that exhibited more extreme angles. Slope most likely affects the growing conditions of Halosaccion glandiforme however it is only one several variables that together create intertidal zonation and is therefore difficult to quantify. This study was not sufficient to come to any conclusions concerning the hypothesis and the hypothesis (Ha) is not accepted.

Recommendations

While trends were observed in this study there are many conditions that must be taken into account. The data was collected at Race Rocks in July and cannot be considered relevant for the whole year. While the H. glandiforme populations are anchored to the rock and are not likely to vary extensively in position over time, the data would be of greater accuracy if it were collected and compared over an extended time. The data collection, as previously stated, is from one limited range and has not been tested or compared with intertidal zones in any other area. For further study it would be interesting to compare growth trends in different locations. Also the percent coverage values, that were vital to findings, were calculated (using Scion Image pro.) are covered by the species. For a more in depth study, population density calculations would be more accurate if they took into account the size and number of the individual organisms. One of the most limiting factors encountered in the analysis resulted from the scale of the measurements taken. For both hypotheses the results were based on data collected from intervals of one meter along the belt transects. Any discrepancy or variation that occurred in vertical height, slope, or population density inside the transect meter segment could not be taken into account. If repeated the data analysis would be far more conclusive had measurements been taken at smaller intervals of, for example, 10cm instead of 100cm.   This study focused on the intertidal organism Halosaccion glandiforme and the effects of elevation and slope on its population density. There are, however, many other variables and species that affect and grow in the intertidal zone and could be considered and tested similarly to analyze and quantify the intertidal area.

References Cited

  1. Waaland, Robert J. 1977, “Common Seaweeds of the Pacific Coast”. J.J. Douglas Ltd. Vancouver.
  2. Stephenson, T. A. and Stephenson, A. 1949, “The Universal features of zonation between tide-marks on rocky coasts.” Journal of Ecology. 37, 289-305.
  3. Kanwisher, J. 1957, “Freezing and drying in intertidal algae.” Biological Bulletin 113: 275-285.
  4. Carefoot, Thomas. 1977, “Pacific Seashores A Guide to Intertidal Ecology”. J.J. Douglas Ltd. Vancouver.
  5. Kozloff, Eugene N. 1996, “Seashore Life of the Northern Pacific Coast”. University of Washington Press. Seattle.
  • Appendix
PHOTO STRIP OF BELT TRANSECT FROM PEG#5 PHOTO STRIP OF BELT TRANSECT FROM PEG#5b1 PHOTO STRIP OF BELT TRANSECT FROM PEG#6


Other Transect Files
Sitemap Location and Maps Educational Resources Index Contact webmaster:
Garry Fletcher
Copyright

Report on Pearson College and Race Rocks Activities Dec 2002

December 16  Report
Race Rocks Marine Biology Project
By Garry Fletcher
Faculty Member, Lester B. Pearson College
Ecological reserve Warden for Race Rocks.
Education Director, racerocks.com

This report outlines the activities of the Race Rocks Marine Biology Program at Lester Pearson College from December 15, 2001 to December 15, 2002. During this second year of the Richard Ivey Foundation’s three-year commitment to this project, there has been  on-going advancement in our project objectives. Additional funding has been forthcoming this year from the World  Wildlife Fund,  the Georgia Strait Alliance, a private dive charter group and a member of our Race Rocks Advisory Board.  The provincial government has completed a long term lease agreement with us and is assisting us to upgrade the sewage system to a composting system and with repairs to buildings at the islands.
Project Objectives Report
Objective 1: To provide appropriate staffing and a pool of skilled volunteers who are dedicated to monitoring the local marine environment.
    I have continued to devote part of my teaching schedule to educational work involving Race Rocks. I am in constant communication with Mike and Carol Slater, the eco- guardians at Race Rocks as they provide assistance in monitoring the cameras and computers and alert us to any issues involving enforcement of the guidelines of the reserve.
    A further improvement to our Daily Log kept by Mike and Carol was developed this year. We were fortunate to have the volunteer services of Alec Matthews of the software design company WhiteAtom Design, work with us in the development of a database into which the daily observations of Race Rocks are entered. This now runs on a server on the island, with the added advantage being that in the database form, we are able to do reports on selected fields of the database. This makes our reporting to BC Parks and Fisheries more efficient, and allows us to link the content of the database to the resources on the web pages.

    Chris Blondeau, our seafront manager, has been active with the college divers, teaching them underwater camera skills and adding to the underwater video library for the college.  We have made a video of one of the incidents that Chris was involved with while assisting with the ongoing public education role which we conduct with the local community in the monitoring and enforcement of infractions in the reserve. http://www.racerocks.com/racerock/archives/vidfishing.htm
    My two colleagues in the biology and environmental systems department Catrin Brown and Laura Verhegge have incorporated a number of the resources of the website and Race Rocks into their teaching program. We were able to webcast live two of their low-tide field labs last spring. A video was added to the education section of the archives that shows Laura’s first year environmental System classes doing their final exam at Race Rocks. http://www.racerocks.com/racerock/archives/videxam2002a.htm
    The popularity among the students of the “new media” approach in education has led to an increase in demand for facilities to do video editing on campus. Examples of producing video on-line provided by the racerocks.com experience, led one of the students in the racerocks.com activity to produce video clips of our annual “One World Show .
I gave this same student a video camera when he went home to Kenya this summer. He was able to take his skills learned in the webcasting experience from racerocks.com activity and produce several excellent videos of the life of the children in rural Kenya. In the new year, the students of the activity  will be live webcasting a bi-weekly program presenting events of the week at Pearson College.
    The college has been able to set up a new computer media room for students to work on other video editing projects.  Adding this option for our students has been a valuable spin off of the racerocks.com program. Sylvia Roach, another science faculty member is supervising the students involved with this option.  We were also fortunate to be able to hire Scott Nichol this year. He is a software and web specialist who also helps us in sorting out some of the technical problems with the computers at Race Rocks.

Objective 2. To supplement environmental monitoring through 24 hr video monitoring through the racerocks.com website.  Our cameras and computers set up in the Millennium project have served us well in providing continual live access to the islands resources through live streaming video.
    In January of 2002, we were introduced by our contacts in Apple, to the computer software company Channelstorm and their software “LiveChannel” which  we now use in webcasting on several of the cameras. http://www.racerocks.com/racerock/rrcom/livechannel/livechannel.htm
I worked extensively in collaboration with the software engineers of the company to adapt the webcasting software to our application. They have freely provided us with the software as they are able to use our site as a valuable example of the success of their software.  After going through several Beta versions of the software, we now have a very useful tool for involving creative input from the students for our webcasts.  On campus we have used it to broadcast the weekly International Affairs program and have webcast two evening performances for the International Day presentations on campus. At Race Rocks, we use it in the live webcasts from the portable camera and the students of the racerocks.com activity have developed expertise in this software and are now interested in expanding their use of it to provide a bi-weekly live web cast which will be a presentation of events of the week at the college.

Objective 3: To educate Pearson College students about the marine environment and to involve these students in a direct stewardship experience.  
    In October, our college hosted the CISTA  schools conference. Four of the students of the racerocks.com activity gave 6 workshop presentations to the delegates.  Their topic was the use of technology for Environmental Conservation as a method of Community Action. Since the delegates were made up of teachers and students from across Canada, the US and Latin America, they experienced a great interchange of questions and ideas. It was clear that the “ownership“ of the racerocks.com process, gave our students confidence in their role as environmental stewards, and this was clearly evident to the participants.
    During our November Project week, this year, three of our first year students stayed at Race Rocks producing daily programs about the wildlife and the ecosystems of the island. They also were trained at  that time to operate the MPA when our eco- guardians are on leave. As a result of their work several videos have been added to the archives. Two of the students had been in the racerocks.com activity , and the other student was already familiar with the editing video program so that they were able to do the video and editing work in the making of the following QuickTime movies.

Daily Duties For Assistants to the MPA Guardian
http://www.racerocks.com/racerock/archives/viddailyduties.htm
Tidal Variation at Race Rocks at http://www.racerocks.com/racerock/archives/vidrrtides.htm
Race Rocks Tour: with an English Version,  an Arabic Version , and a German Version at http://www.racerocks.com/racerock/archives/vidrrvirtourara.htm
    For some time we have been concerned with the effects of the demolition blasting at the nearby Department of National Defence facilities on the marine mammal and bird populations at Race Rocks.  It has been our belief that mitigation of this impact could be done by controlled levels of blasting and proper timing. On November 7, 2002, the DND were still doing their demolition blasting exercises at Bentinck Island. These students were able to video the images of the impact of these blasts on the first day from the science centre window and on the second day from the top of the light tower. In the tower, they interviewed Mike Demarchi of LGL who is currently doing a contract for the Department of National Defense to monitor the impact of these blasts and to compare them with other disturbances at Race Rocks. This video will help in public education and is now included in our marine mammal archives at: http://www.racerocks.com/racerock/archives/vidlionblasts.htm  In doing the work, they had a keen sense of the role that they were providing in terms of our on-going stewardship of the island  and they felt they had contributed by this process.
    The spring 2002 field lab program was completed with involvement of the following students in direct contact at Race Rocks.
    Spring 2002- 40 Biology first year students in three classes were involved in field research at Race Rocks. They did a population study in tidepools and an invertebrate survey.
    Spring 2002- 30 students of Environmental Systems did  several field labs on intertidal transect methods.
    Fall 2002- In orientation week ten students  were involved in a program of interpreting Race Rocks Live by webcasts for an afternoon at Race Rocks.  These webcasts were viewed by other students as an introduction to Race Rocks
    These environmental systems students also did their final exam on the island in May of 2002 and
    Fall 2002 – 36 students in first year biology did an introductory field survey at Race Rocks.

    In May 27 of 2002, I was invited to participate as a finalist in the New Media Awards ceremony in Toronto, having been nominated in the category of Educator of the Year.
    While there, I was able to visit the offices of the World Wildlife Fund  in support of an application for funding from this organization. Visits were also made to the Ontario Science Centre  and the Royal Ontario Museum to investigate the possibility of getting our educational resources available through the internet to these institutions.

Objective 4: To lead environmental field trips for local school children to Race Rocks.  Our school trips have been reduced to lessen the impact on the island but we have continued with using a system of student “reporters” from a school :
    In June three groups of such  students went with us to Race Rocks  where our students provided an informative introduction to ecology of the organisms at Race Rocks. This 17 minute video shows the kinds of experiences they have while out in the field, http://www.racerocks.com/racerock/archives/vidwestmont2a.htm
The complete webcast went live to their schools and to other schools who could be on line. We also re-webcast the tapes of the sessions several times.
Objective 5: To facilitate marine education programs for schools across the country and internationally through racerocks.com
    In March a major project was undertaken at the request of the Apple Learning Interchange. Apple Computers were planning to set up a “Gallery of Best Practices” on their website.  We were invited to provide the resource materials detailing our innovations at Race Rocks for this special website.  Race Rocks  is currently the featured exhibit and can be found from the education links to the Apple Learning Interchange at http://ali.apple.com/
The gallery is set up to encourage others to try to incorporate this form of resource into their own instructional program.
An outline of the exhibit follows:
Introduction:  I provide an introduction by video of the way that Apple Learning Interchange is providing the distribution network making it possible for thousands of student connections per week.  I explain that this exhibit will provide you with a glimpse of our educational programs, the technology that makes it possible, as well as ideas to help use our resources in your classroom.
The Lesson : Here you will find an example learning activity that we use in our curriculum entitled: “A Project to Establish a Digital Taxonomic File.” We have also included a learning activity contributed from the Apple Learning Interchange which may give you ideas on how to use our live video streams and web resources in your classroom.  A weblink to an index of files that may be useful for statistics labs in biology or environmental systems and a link to the new section on resources for the Jason project are included.
Assessment : As well as showing the video on the environmental systems exam, a video with Garry and Laura discussing assessment is included: “ Every Field Lab in which the students are involved at Race Rocks becomes part of a portfolio of student work which is graded according to a number of criteria, as suggested by the International Baccalaureate Science Syllabi. We are particularly concerned with observational and interpretational skills, although manipulation, attitude, and planning skills may also be assessed. This first video presents a short discussion on assessment between Garry Fletcher and Laura Verhegge, faculty members in Biology and Environmental Systems at Lester B. Pearson College.
Student Work : In this file Example Student Research videos are highlighted. Rocks Island is a valuable component of the IB Environmental Systems and IB Biology curriculum at Pearson College of the Pacific. This island research center makes it possible to immerse students in real inquiry as they investigate ecosystems both on the surface of the island and below the surface of the surrounding water. Students work in small groups often with visiting scientists adding to the growing knowledge about life at Race Rocks. It is also possible for students at remote schools to participate in observational research and to join live reports by the students and staff at Pearson
Reflections : Video segments of students  and the faculty discussing their experiences  are provided.
Administrative Support: Angus Matthews provides an administrators perspective on the program, encouraging other educational administrators to take the leap and get involved in programs like this because of the spin-offs possible to other aspects of education.
Resources: This site summarizes the links to the racerocks.com website which relate to education in four areas
A)    Race Rocks Ecosystems
B)    B) History of Race Rocks
C)    Video
D)    Communications
http://www.uwc.ca/racerock/aliassets/resources.htm

Technology: I use an annotated slide show, to explain how one can use Apple streaming technology to share their local ecosystem with the world. By following through the process of how we use technology on the islands,  a model is presented for similar projects as part of educational programs elsewhere.
Background :Maps showing location and a profile of the history of the racerocks.com project are provided in this section.

    In the fall of 2002 we took on an added responsibility, that of being the Canadian content provider for the Jason Project . http://www.racerocks.com/racerock/jason/jasonproject.htm
With Assistance from the Jason Foundation, we hired Jane Johnston, to do the middle school level curriculum level work to bring together the resources of our site into Lesson Plans. These are now being made available on our website and are linked to the Jason website which is subscribed to by 70,000 teachers in the US.

Special curriculum guides are being developed for:
1.    Geology and Geography (Abiotic Characteristics at Race Rocks), http://www.racerocks.com/racerock/jason/abiotic/t_instr.html
2.    Preserving the Past and Present Culture of Race Rocks (The Thirteen Moons), http://www.racerocks.com/racerock/jason/firstnations/t_intro.html
3.    Maintaining our Coastal Ecosystems (An Ethology),
4.    The Northern Abalone, http://www.racerocks.com/racerock/jason/abal_seastar/t_info.html
5.    Pinnipeds, http://www.racerocks.com/racerock/jason/pinnipeds/seal_sealion_differ.htm
6.    Conservation.

    The production of the Race Rocks taxonomy is a curriculum development event that has consumed a great amount of my time this past year. http://www.racerocks.com/racerock/eco/taxalab/taxonomy.htm
This is a collaborative project with students and we have the goal of eventually achieving  a comprehensive linking of all the information and media resources for all the organisms of Race Rocks.   In the late fall and early spring terms 44 biology students contributed their records and 21 Environmental Systems students. This is currently being added to with another 48 biology students and a further 30 environmental systems students in the next term. By the end of next term, our taxonomy index will have grown to almost 150 species.  I emphasize to the students that this “digital legacy” which is a valuable addition to the management of this ecological treasure. These students are all exposed to a varying degree of research in doing these assignments, and it is anticipated that the end product  after several years will be a unique addition to the efforts for conservation of Biodiversity in the area.

Objective 6: To facilitate marine research projects by providing facilities and volunteers at Race Rocks.
    Three current first year students from Pearson College and Ryan Murphy, who graduated last year stayed at the Marine Science Centre for the first two weeks of June 2002. http://www.racerocks.com/racerock/rrcom/june02/webcrew.htm
Ryan had returned  to Race Rocks assisted by a research grant from Mt.Allison University  to do research on the macroalgal community. He was able to amass over 400 digital images of the macroalgae of Race Rocks in his underwater and intertidal photography for a digital herbarium project he is doing for the unversioties biology department . He also produced two algal videos  for our archives: http://www.racerocks.com/racerock/archiveplants.htm
The students conducted daily live and prerecorded webcasts with me from the intertidal and from underwater using camera 4.
    For one of the webcasts we were joined by Sean LeRoy, Graduate Researcher, Georgia Basin Futures Project Sustainable Development Research Institute, University of British Columbia and Dr.James Tansey also of UBC. They came to participate in the webcast with Garry and Ryan on Marine Protected Areas in New Zealand and Canada with Tim Langlois, Leigh Marine Laboratory University of Auckland, and Anne Saloman, University of Washington, Zoology Department.
Two university students have completed their Master’s Thesis on Race Rocks with our assistance over the past year.
    Sean Leroy  of the UBC School of Community and Regional planning UBC, mentioned above, did research on Public Process and the Creation of a Marine Protected Area at Race Rocks British Columbia http://www.interchange.ubc.ca/aleroy/Portfolio/549C.html
As members of the Race Rocks Advisory Board, myself and Angus Matthews had provided our insights into the process in interviews he had conducted in the spring of 2002.

    In 2002, Taco Niet finished his Masters degree in the Engineering Department’s Institute for Integrated Energy Systems at the University of Victoria (IESVic)
http://www.racerocks.com/racerock/archives/vidtaco2a.htm
As a result of his work, several visitations have been made with  Individuals and Companies who are interested in promoting the use of Alternate Energy at Race Rocks.  Currently the Friends of Renewable Energy, BC (forebc.com) has taken up with the considerable enthusiasm the idea of a renewable energy cooperative and representatives will be making a site visit with me next week.

    We have continued to provide assistance to Dr. Anita Brinckmann-Voss for her hydroid research. In July, I assisted another researcher who was working on hydrocoral to get samples from Race Rocks.  Alberto Lindner is a Brazilian student in a Masters program in Duke University. He is now involved in analyzing the samples to determine if through DNA evidence, the two color morphs of Allopora can be designated as separate species or whether as can be determined by standard methods, they are actually the same species. His report and his masters thesis on this will be linked to this website when he is finished. http://www.racerocks.com/racerock/archives/vidlindner.htm

Objective 7:  Facilitate marine research projects by providing data from video cameras and data sensors that can be accessed through racerocks.com.
Some progress on this objective has been achieved, although accessing of all the environmental data through the internet is still being worked on. It is anticipated that this feature will take on added impetus in the next term.

Two other reports that also give an indication of our role in the operation and stewardship of the MPA  may be found on-line at:
http://www.racerocks.com/racerock/admin/may02update.htm
and at
http://www.racerocks.com/racerock/admin/aug02update.htm


Ocean’s Alive: A Marine Life Weekend

“OCEAN’S ALIVE: A MARINE LIFE WEEKEND” Webcast Event from Race Rocks 

Originally published in The LINK, the college newspaper on January 10, 2002. number 7.

At the end of November, students gained the experience of live webcasting to contribute to a major marine educational project run by the Royal BC Museum. They were able to apply their own recently acquired technological skills to show in real time the Race Rocks Marine Protected Area.

GARRY FLETCHER GIVES US A REPORT

On the weekend of November 24-25, 8 students and Garry Fletcher participated in ” Ocean’s Alive – A Marine Life Weekend ” at the Royal BC Museum. Pearson College had been invited along with a dozen other marine interest groups to provide on-going displays over the two days of the weekend of projects designed to promote education and research in the local marine environment.

For half of Saturday and all of Sunday, Michael Kiprop and Olend Kondakciu operated the mobile camera 4 at Race Rocks while Garry and the students ran four computers and two projectors with the four live video streams coming from Race Rocks. Thanks to the loan of two Apple computer G4 Powerbook, one from from Soho Computers and from Westworld Computers in Victoria, they were able to present some of the on-line resources of the colleges racerocks.com website to some of the 2300 members of the public who went through the turnstyles of the museum over the weekend. Initial problems of receiving webcasts inside on the museum’s network were solved by bringing in and installing in the rafters our own Apple Airport Base station which allowed wireless transmissions of four video streams to the museum hallways.

Julia Clark and Virginie Lavallee , both second year Environmental Systems helped set up the equipment for the display and answer the public’s questions on Saturday morning while Damien Guihen of the racerocks activity helped Garry on the Saturday afternoon. For the Sunday presentations, Michael Cameron, Jaffar Saleh and Molly McKay, all members of the racerocks.com group each put in half a day for the presentations. It was a great opportunity to get out with the public to help promote the work we do at Race Rocks.

We at the college now almost take for granted the 24 hour live webcasts from Race Rocks and the weekly live webcast of various college presentations such as International Affairs. There was surprise and amazement from many visitors, however, who never realized before that they could get such interesting live images of the sea lions and seabirds right in their own nearby Strait of Juan de Fuca. Two couples touring Victoria from Great Britain were excited to know that from home they could now see the wildlife of the local area live on the internet. For times of webcasts from the campus, see the link to the webcast schedule from the college home page.