Introduction:In this file, we show the process and results of an investigation on some specific examples of horizontal structure of ecosystems
Objectives: After doing this lab, you will be able to:
a) Observe a species in its environment and determine its horizontal distribution.
b) Comment on the causes of horizontal distribution of vegetation at Race Rocks
c) Analyze how horizontal structure in your own ecosystem is determined by abiotic and biotic factors
d) Design your own protocol for analyzing the effects of horizontal structure on ecosystems.
e) Discuss the implications for Human built-up environments on Biodiversity of Ecosystems.
f) Quantify the amount of anthropogenic influence from human construction on the surface area of Race Rocks.
PROCEDURE: 
1. Use the remote cameras at Race Rocks and scan around for one species: mammal, bird or plant. Probably there will be more than one of these animals or plants in view. Once you decide on the species, be sure you know its correct identification. |
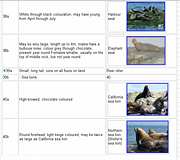
2. Go to this file for a dichotomous key to help in identification of birds and mammals. |
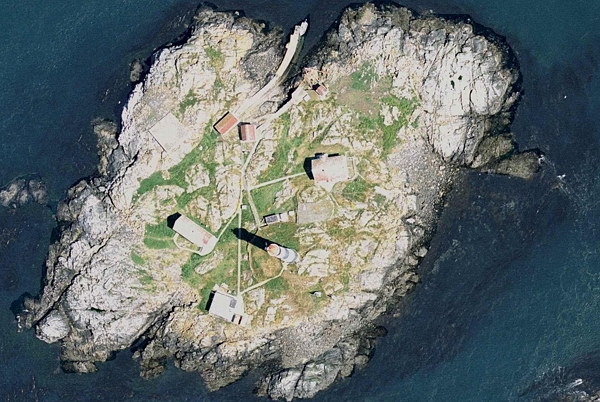
 3. Look for patterns in the distribution of that species, the sector of the island in which it is located, whether it is near vegetation or on a rock, whether it is exposed to wind or not, or how closely it is located to the shore. See if you can add any ideas about how the horizontal patterns of the species are determined. Then add your sighting record summarizing these observations on the GIS database. Next observe the island from the air in the image above. This is part of the image of the GIS projection on OceanQuest. You can see just by the color, where pockets of accumulated soil have determined the horizontal distribution of vegetation on the islands. You can also see from this bird’s-eye view, how the surge and wave action producing salt spray and erosion around the edge of the island might have has produced this zone free of vegetation. 3. Look for patterns in the distribution of that species, the sector of the island in which it is located, whether it is near vegetation or on a rock, whether it is exposed to wind or not, or how closely it is located to the shore. See if you can add any ideas about how the horizontal patterns of the species are determined. Then add your sighting record summarizing these observations on the GIS database. Next observe the island from the air in the image above. This is part of the image of the GIS projection on OceanQuest. You can see just by the color, where pockets of accumulated soil have determined the horizontal distribution of vegetation on the islands. You can also see from this bird’s-eye view, how the surge and wave action producing salt spray and erosion around the edge of the island might have has produced this zone free of vegetation. |
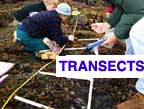 4. One of the field techniques of studying the horizontal distribution of organisms is also a technique which allows the production of baseline information about organism distribution. Go to this file on Environmental gradients, (which are determined by biotic and abiotic factors). It shows how a belt transect can be used to document changes of organisms through a specified distance. Describe the procedure used and indicate how records produced in this way may be very useful in measuring the effect of humans on ecosystems through time.( hint:Oil or other chemical spills) 4. One of the field techniques of studying the horizontal distribution of organisms is also a technique which allows the production of baseline information about organism distribution. Go to this file on Environmental gradients, (which are determined by biotic and abiotic factors). It shows how a belt transect can be used to document changes of organisms through a specified distance. Describe the procedure used and indicate how records produced in this way may be very useful in measuring the effect of humans on ecosystems through time.( hint:Oil or other chemical spills) |
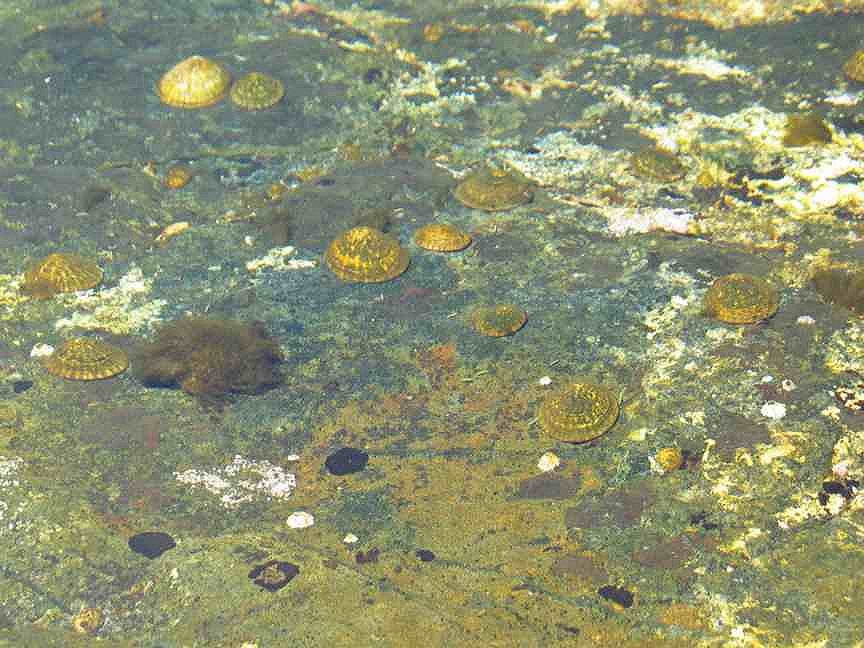 5.Organisms themselves often play the role of determining species distribution. Here in the artificial tidepool #13, limpets can be seen underwater grazing on an algal scum on the flat rock base of the tidepool. In this case, the limpet has determined the horizontal distribution of the algae, and vice versa, the remaining algal scum determines where the limpets will be distributed on the horizontal plane. Describe other examples of where organisms themselves determine distribution . Things to think of are: habitat and shelter, food sources, the presence of one species creating a “microniche” for another. 5.Organisms themselves often play the role of determining species distribution. Here in the artificial tidepool #13, limpets can be seen underwater grazing on an algal scum on the flat rock base of the tidepool. In this case, the limpet has determined the horizontal distribution of the algae, and vice versa, the remaining algal scum determines where the limpets will be distributed on the horizontal plane. Describe other examples of where organisms themselves determine distribution . Things to think of are: habitat and shelter, food sources, the presence of one species creating a “microniche” for another. |
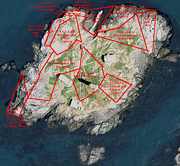
6. Biodiversity of  Ecosystems often suffers as a result of human activities. One could say that humans are probably the most significant organism in the effect on biodiversity. Describe two ways in which humans have a negative effect on biodiversity and two ways in which humans have a positive effect on biodiversity. Go to this file for an exercise which allows you to determine the influence of human activity on the horizontal patterns of distribution of organisms on Race Rocks. In this exercise we take a critical look at the Race Rocks Ecosystem, and actually measure and calculate the Anthropogenic footprint. In it you might encounter some examples of bioremediation and restoration, some interesting history and some mysteries. Most certainly you will discover the history of how human activities can have a big impact on an island ecosystem. Ecosystems often suffers as a result of human activities. One could say that humans are probably the most significant organism in the effect on biodiversity. Describe two ways in which humans have a negative effect on biodiversity and two ways in which humans have a positive effect on biodiversity. Go to this file for an exercise which allows you to determine the influence of human activity on the horizontal patterns of distribution of organisms on Race Rocks. In this exercise we take a critical look at the Race Rocks Ecosystem, and actually measure and calculate the Anthropogenic footprint. In it you might encounter some examples of bioremediation and restoration, some interesting history and some mysteries. Most certainly you will discover the history of how human activities can have a big impact on an island ecosystem. |