Today is my first day as the Ecoguardian at the Race Rocks Ecological Reserve. I was dropped off at 8:30 am with my personal gear, bags of groceries and a reminder to monitor the solar panels, batteries and the electric fence – there are more duties and responsibilities but a source of power is one of the essentials.
Power
I unpacked, put groceries away and set off to tackle the my first chore – clean the panels. The solar panels are mounted on the roof and on the side of the Energy Building which houses the diesel generator. At this time of year, with the long sunny days and daily cleaning, it is possible to power the house systems just on solar power. Why the daily cleaning? There are hundreds of gulls nesting here and what do we will do at least once a day? Poop!
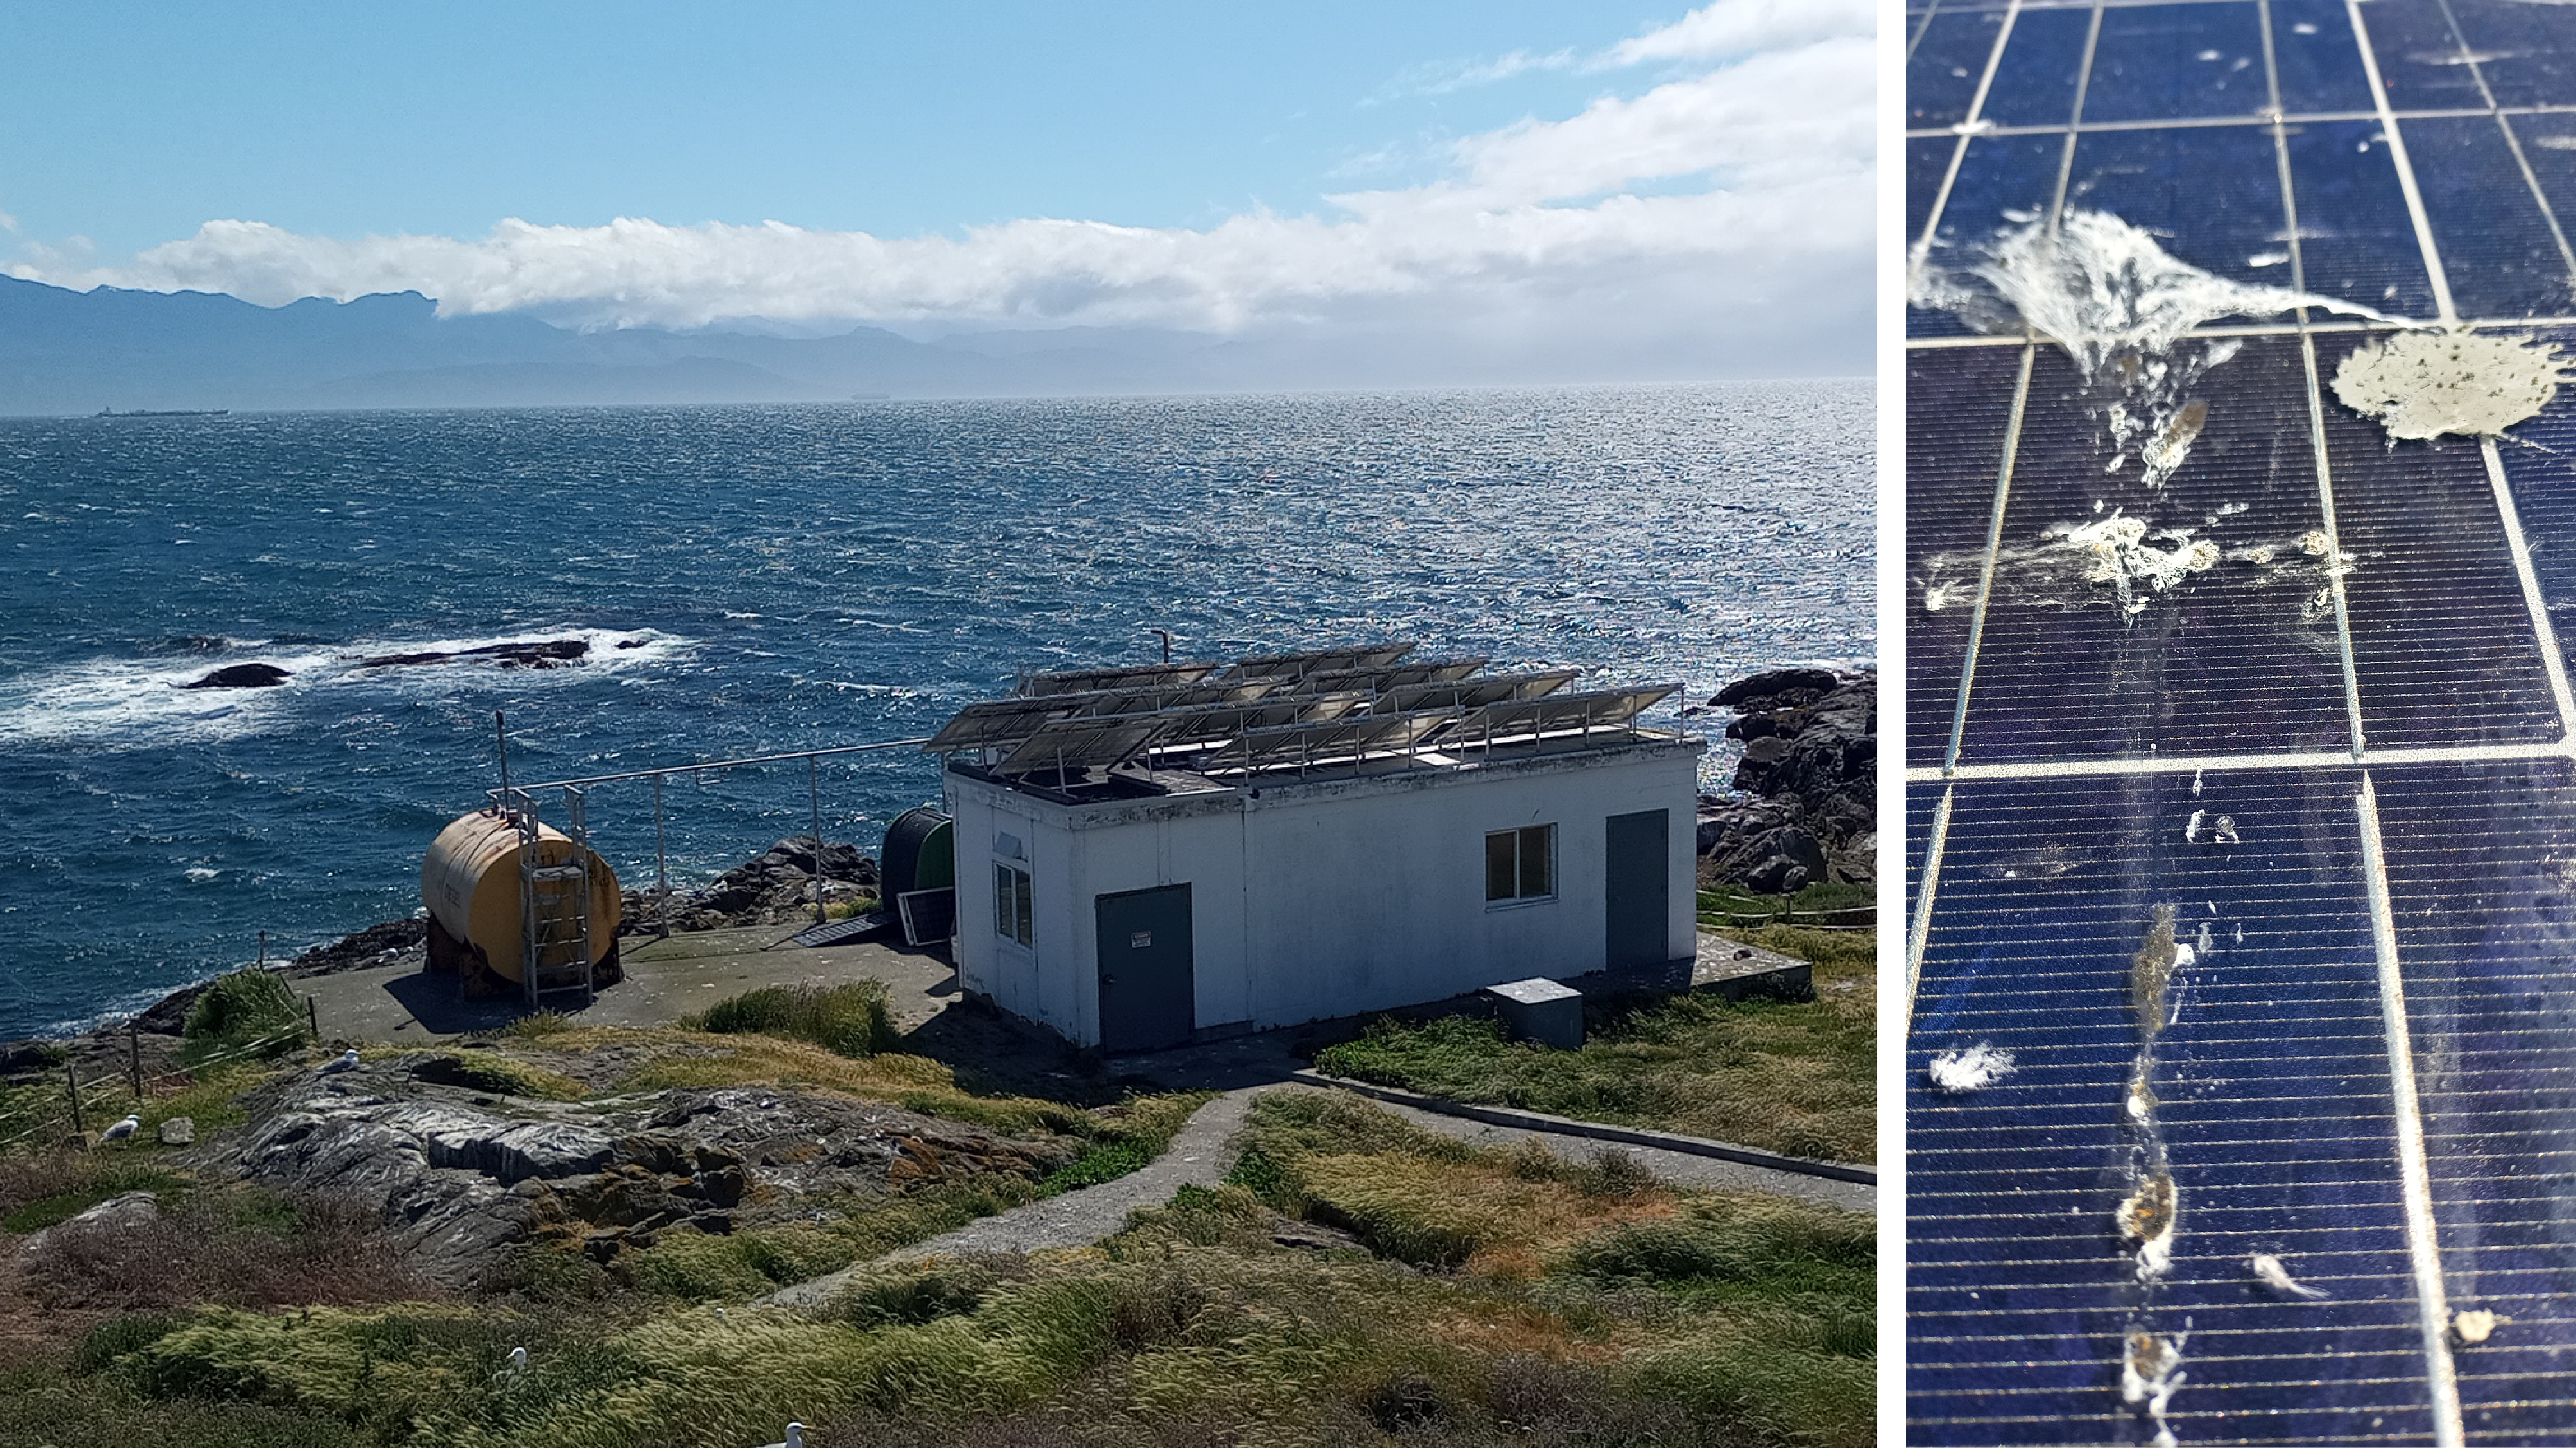
Panels on the Energy Building roof
After hauling the cleaning supplies up to the roof and turning on the water, I thought a methodical approach would serve me best. I climbed back down and noted my “starting point” of 3.1 kW of energy being produced by the panels. After cleaning four panels, I climbed down to check the display. It was up to 3.4 kW. Cleaning is one of those tasks that provide instant gratification and now, doubly so. With all the roof panels cleaned they were producing 4.2 kW and with lower side panels it was up to 4.8 kW! I tell myself “what a worthwhile task and job well done Christine”
Well, later in the day I have some time to sit down and familiarize myself with OPTICSRE, the software package that lets you visualize your energy system production (solar or generator), storage (battery bank) and consumption levels. It turns out that in the long time it took me to figure out the best way to clean the panels and finally get the job done (between 10 am and noon), the sun was moving, as it does everyday, and with the clear skies, was naturally approaching its peak midday production levels (see graph below). Silly me, it wasn’t all my doing! Shame there is no easy way to determine the added benefits of cleaning the panels.
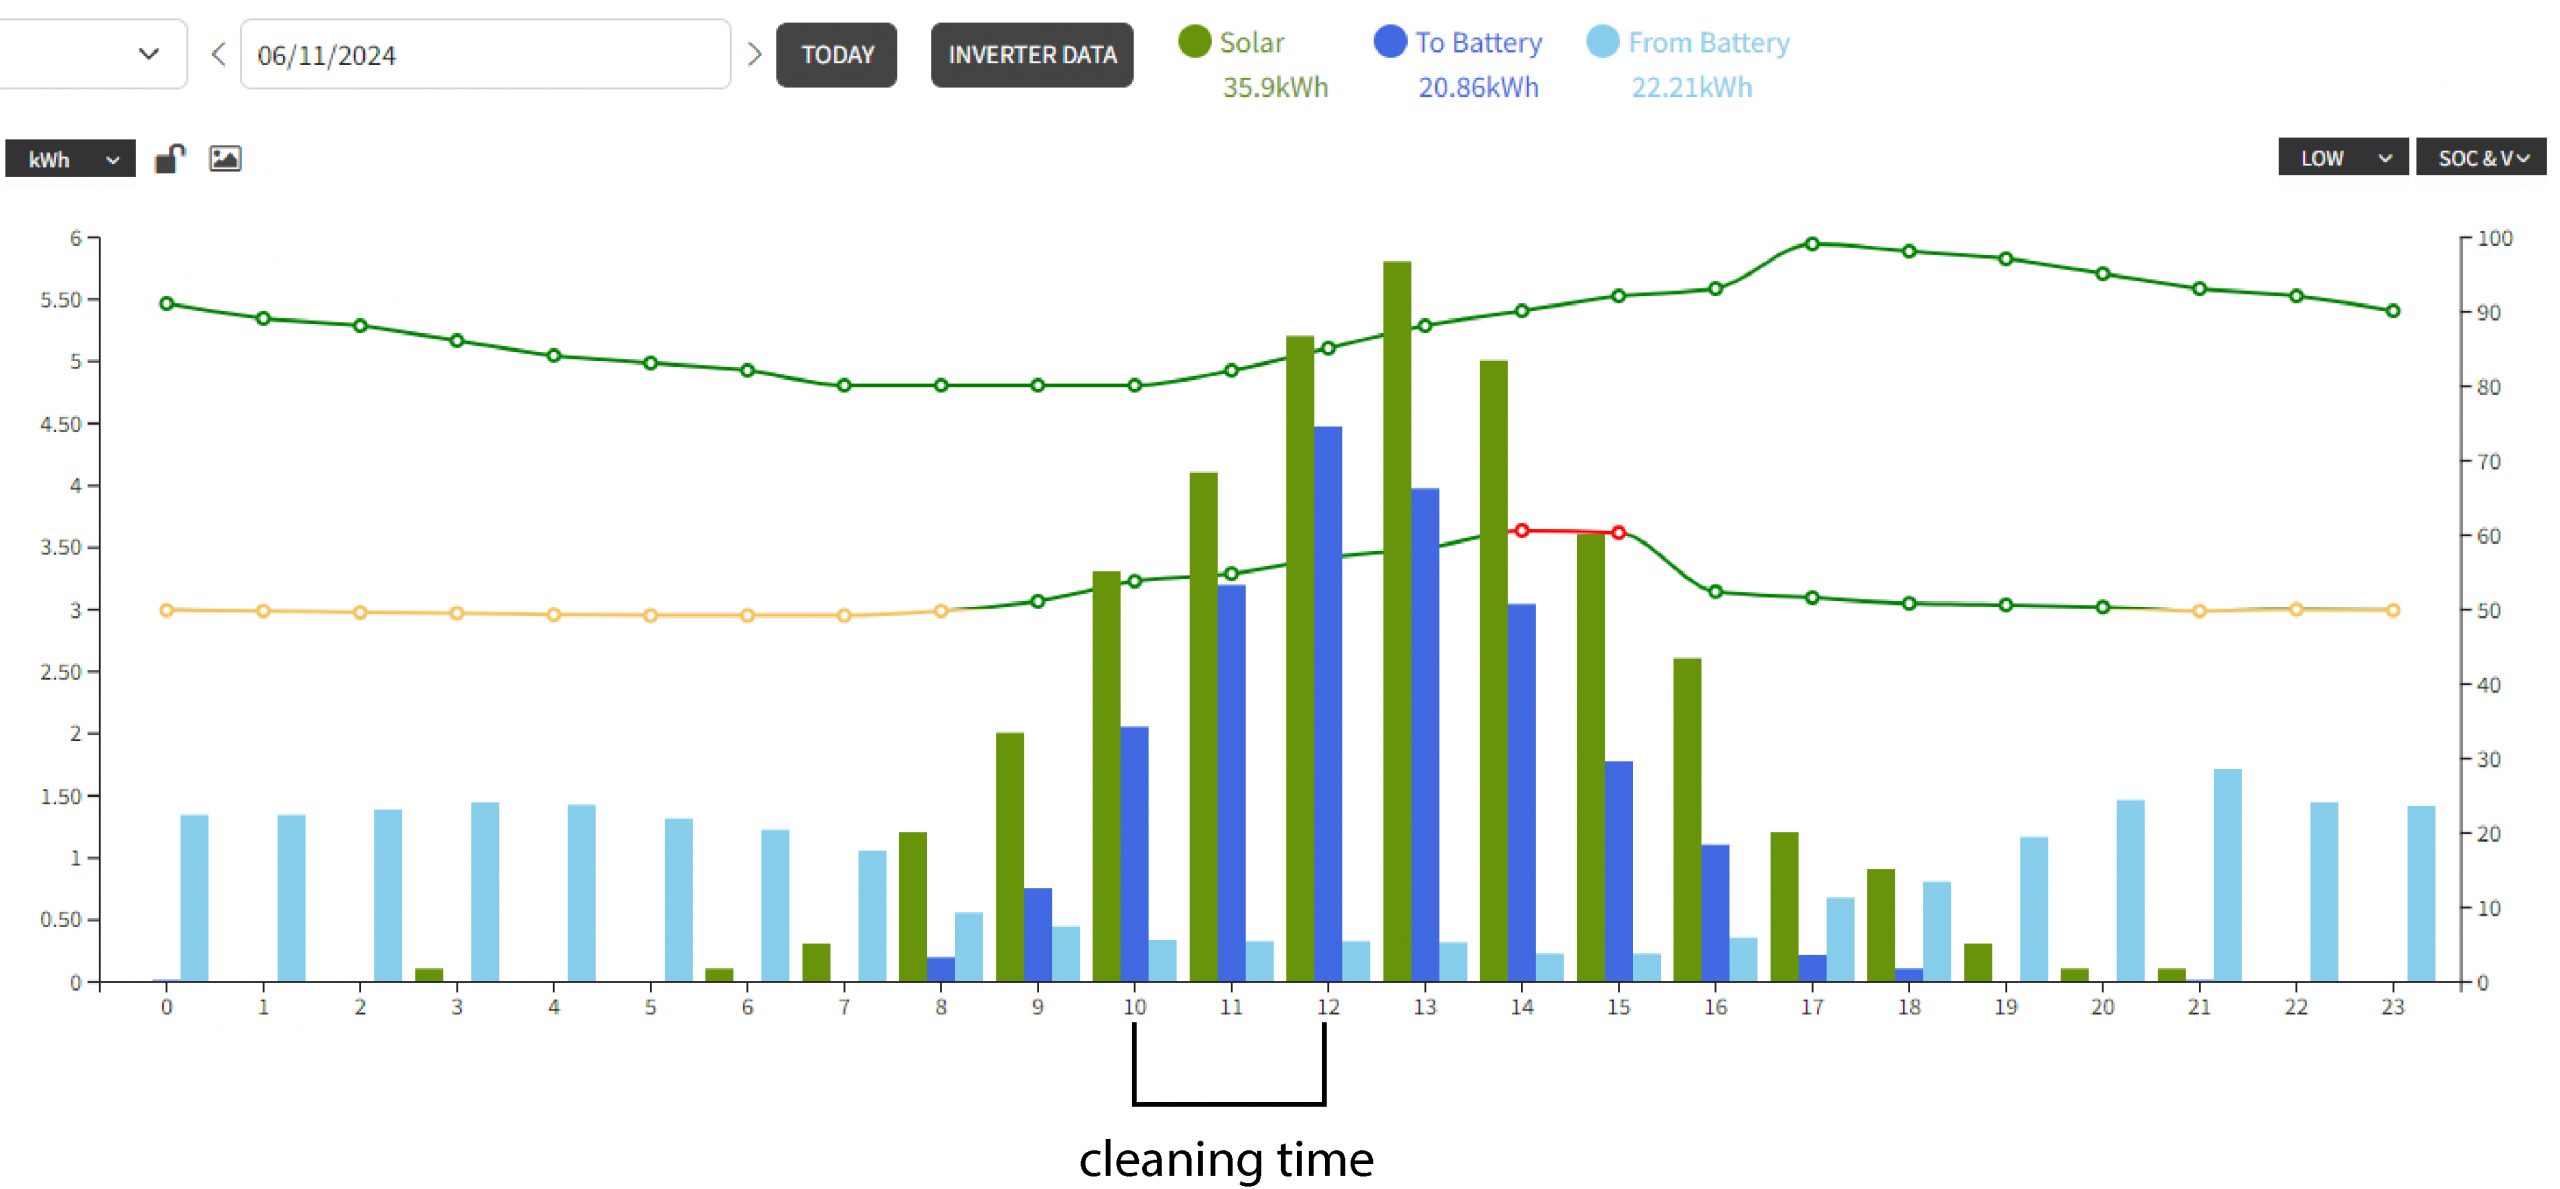
OPTICSRE graph of energy levels produced by the solar panels (green bar), stored in the batteries (dark blue bar), taken from the battery by the house systems (light blue bar) for each hour on June 11.
The software also displays live time power use. I consult this throughout the day and find it memorizing. The image below shows the current situation at night as I write this. Very little energy is going from the panels to battery, the batteries are at near full capacity and we are operating in the red, drawing power from the battery bank. The house (appliances, computer, lights etc) generally draw 1.3 kW of power. If I turn on all the lights in the house and the bathroom fan, it jumps to 1.5 kW. I think if we had such a monitor in our homes, we would be more aware of our consumption and our footprint.
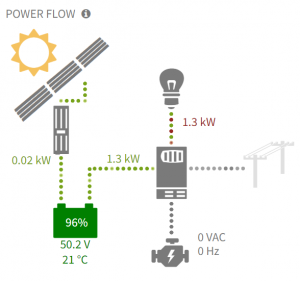
OPTICSRE live display of the energy system
Heads to the wind
The another thing I discovered today was all the gulls were facing the same way because of the wind! We went from light winds at 8:00 am to 41 knots with gust of 46 by early afternoon. Like me, if standing, they took a wider stance, arching and bracing for the gusts. I watched one trying to move travelling side-to-the-wind and being blown off a rock; most scuttle side-ways like crabs.

Bracing and ruffled in a gust of wind
A very interesting first day.
It is a privilege to be here.