Test of AXYS Wind Assessment Technology

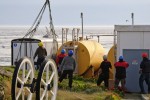
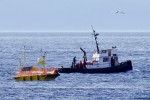
In October, 2009, Lester Pearson College had an opportunity to participate in an offshore wind assessment test by AXYS Technologies Inc. in the Strait of Juan de Fuca .

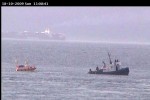
See video of test in Juan de Fuca off Race Rocks

Sidney firm deploys world’s first wind buoy :
Times Colonist,October 28, 2009
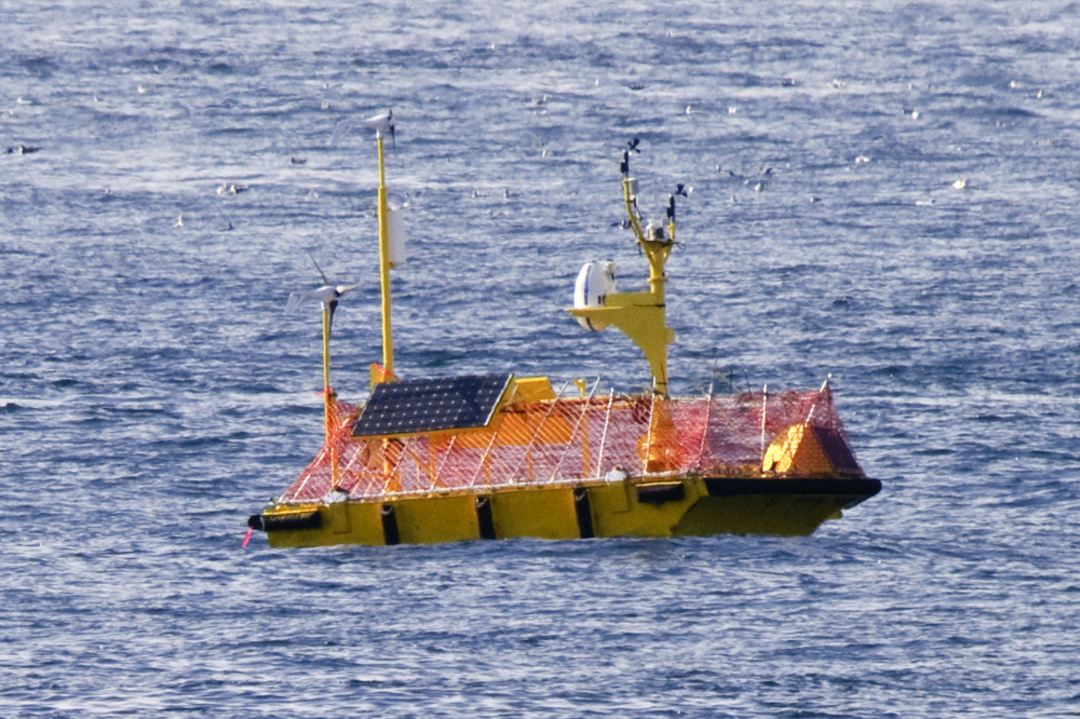
rm191009buoydeployed

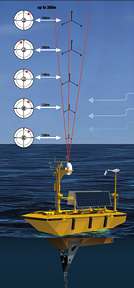
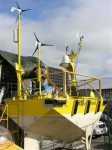
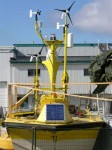
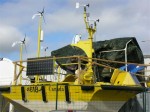
The Wind Sentinnel deployed at Race Rocks on October 18, 2009 -Estimated duration is Oct. 16 – Nov. 16 (logistics/weather dependant) -Buoy Deployment Location – Lat: 48° 17.606’N Long: 123° 32.370’W -Communications – Buoy: Cellular phone -Communications – land station: Race Rocks LAN wired Ethernet connection

Great Race Rocks was used to host the land station for an offshore buoy which is designed to record  wind speed and direction data profiles up to 200 meters height. It is anchored outside of the Race Rocks Ecological Reserve in the Strait of Juan de Fuca. Data from the buoy is relayed automatically every 10 minutes by cell phone to the instrument trailer on land and is transmitted to the internet through our LAN on Race Rocks


https://www.racerocks.ca/wp-content/uploads/2009/09/AXYSWindSentinel.pdfLink to this brochure pdf with more specifications. AXYSWindSentinel

We will be able to benefit by adding the information collected to the knowledge base for the reserve. It will also be useful for planning for future sustainable energy applications.Our current wind measurements done by the Davis weather instrument we have installed on the ground level, often show at least a 10 km/h difference in wind velocity when compared with the Environment Canada data from the top of the tower at 36 metres. A set of data with projections to 200 metres will provide an excellent profile for comparisons.

See this sample file on Analyzing the data as an exercise.

Username: windtrial
Password: axyswind
The left hand window shows the station, which if you click on will expand out to show the messages (metocean and Waves) and if you click the + beside these you will get the individual data parameters which you can plot into a graph by selecting the checkbox of the parameter you want to graph and then clicking the Graph icon at the top of that window.

You can also see a table of the data by simply clicking on the message (click on the 1 MetOcean name and a table will appear on the RHS window with all the data)

Return to the Wind as an Abiotic Factor at Race Rocks File

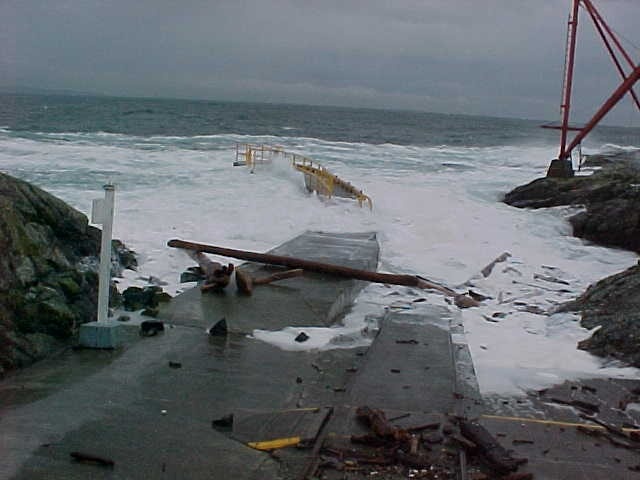
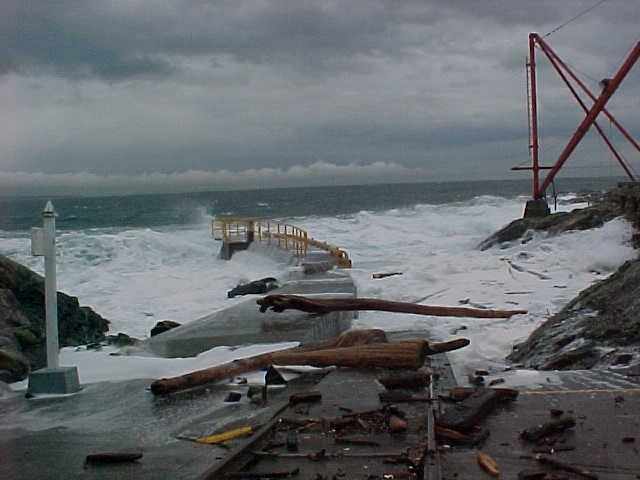
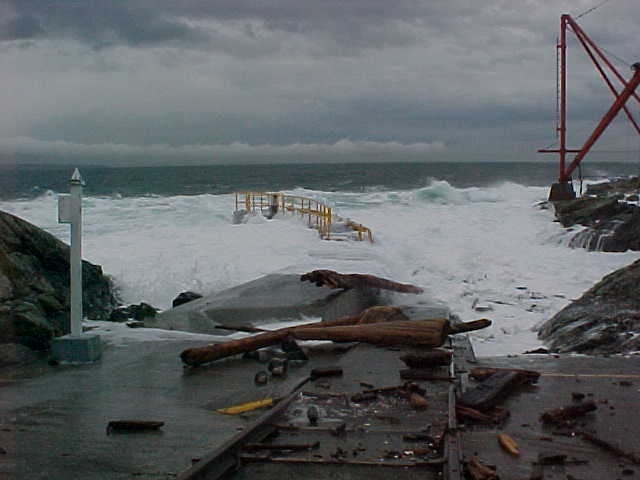
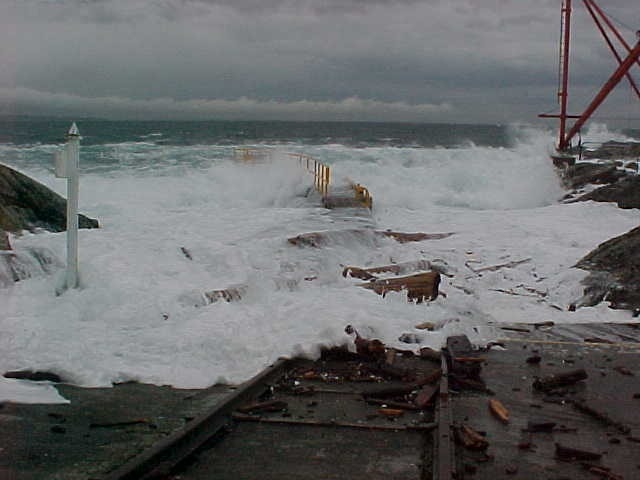
Extreme Weather Events at Race Rocks

How We Got Blasted: Record-ripping winds took rare path:

Judith Lavoie, Times Colonist Published: Saturday, December 16, 2006

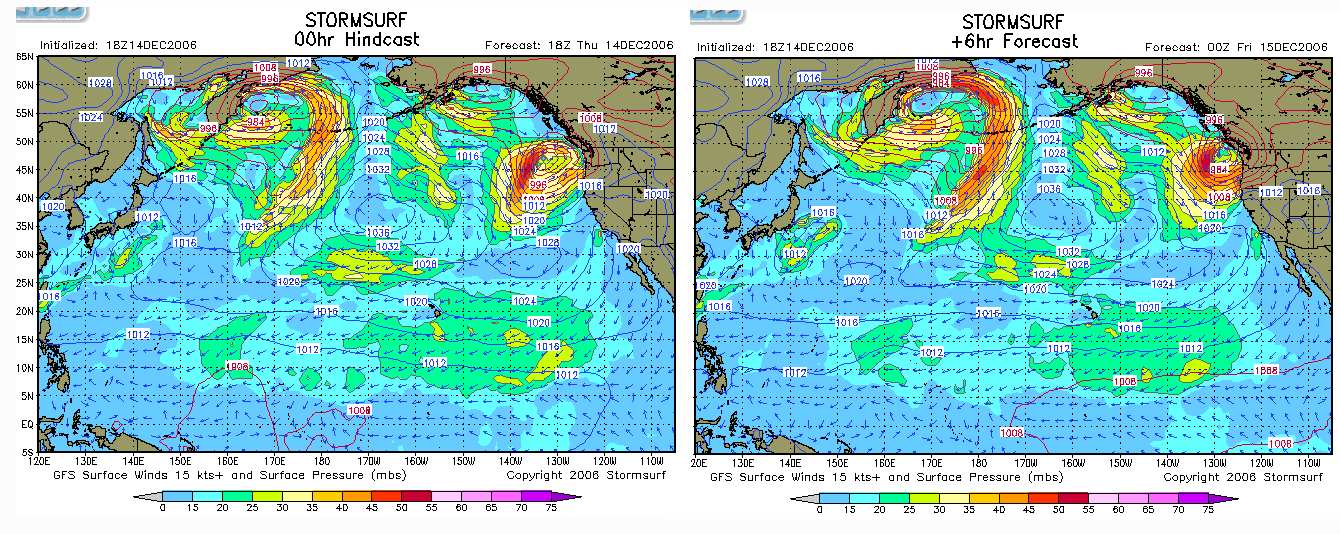
Wind gusts at Race Rocks, off the Island’s southwest tip, reached a record 158 kilometres an hour as the third intense wind storm in a week plowed a trail of destruction through southern Vancouver Island and the Lower Mainland. Yesterday morning’s storm knocked out power to thousands of residents, toppled trees, and damaged buildings and cars. More residents were forced from their homes because they didn’t have power, and ended up moving into hotels or into the homes of friends and relatives. Around the capital region, areas that suffered the most damage had winds that gusted to between 70 and 90 km/h . In the last three storms, including yesterday’s, the wind has gathered over the North Pacific, whooshed across the ocean, gathered speed in the funnel of Juan de Fuca Strait and then whacked Vancouver Island with its full force, said Chris Emond, Environment Canada meteorologist. “There are tremendous wind speeds and three in one week is unusual.” The wind is coming straight across the cold North Pacific and hitting land, rather than taking the more common route of dipping south and picking up tropical moisture, Emond said.

Anne McCarthy, weather services specialist with Environment Canada, said the storms are cutting a swath straight across Vancouver Island instead of the more usual pattern of tracking to the north coast around Prince Rupert and the Queen Charlottes (Haida Gwaii.) Although we have only recorded extreme values since earlier this year, It is interesting to note the Maximum wind and the Minimum Pressure records for the 14th and 15th of December 2006.
You can read the complete story in the Times Colonist , Dec 16, 2006 The right conditions for a hurricane:

Storm surf conditions which correspond to the low pressure systems. These images were captured from the Stormsurf site at 2300 hrs. Pacific Time , just a few hours before the maximum impact.

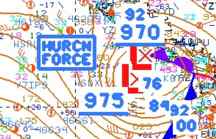
This image was taken from the US National Weather Service Images of the evening of December 14. Note the “HURRICN FORCE” location right beside Vancouver Island. Also the atmospheric pressure is as low as 970.

Current Satellite imagery is shown on this page

Return to the Physical Factors Index

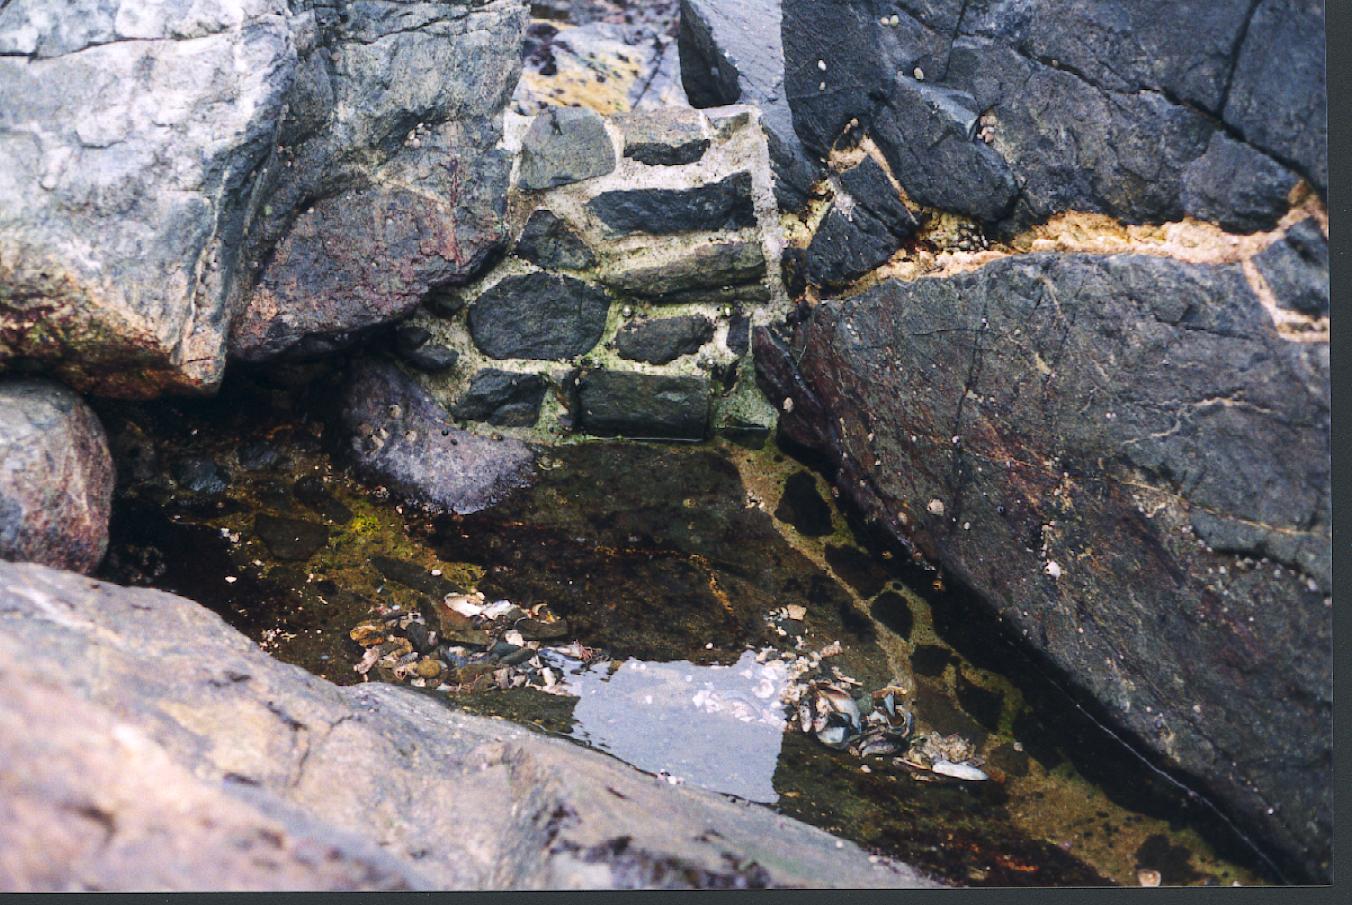
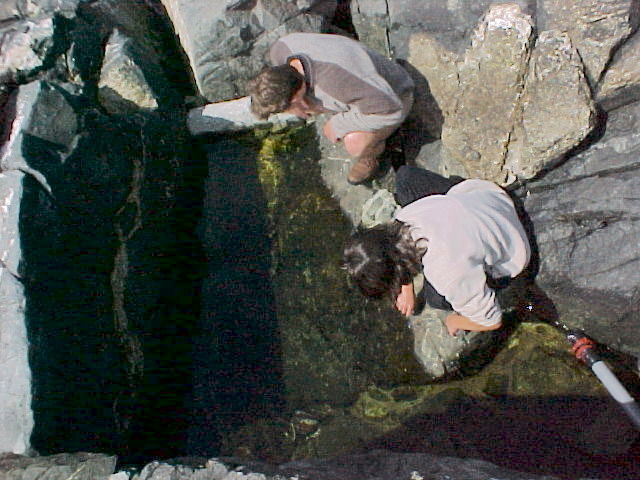
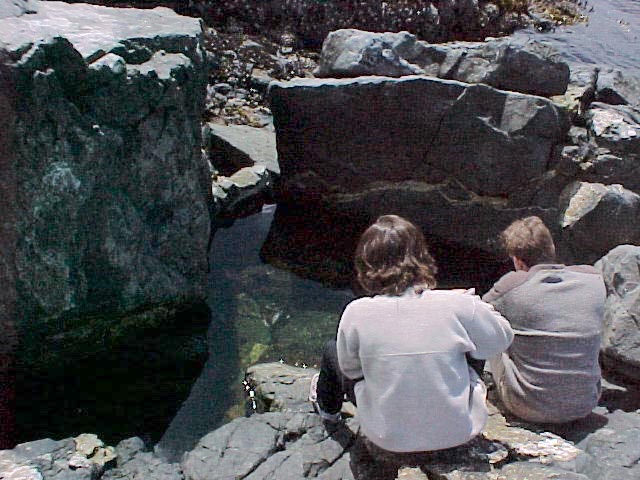
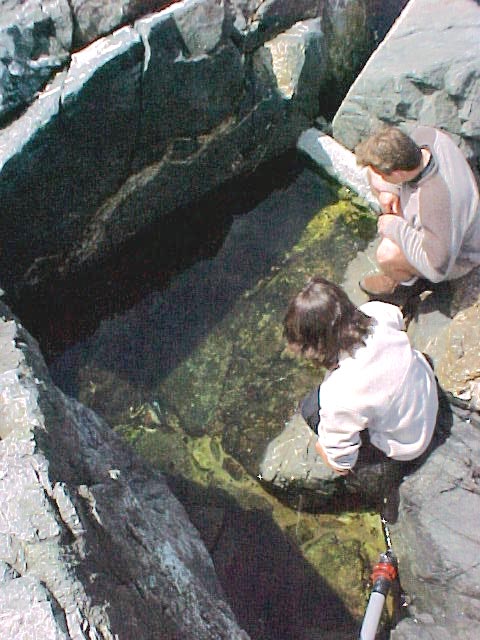
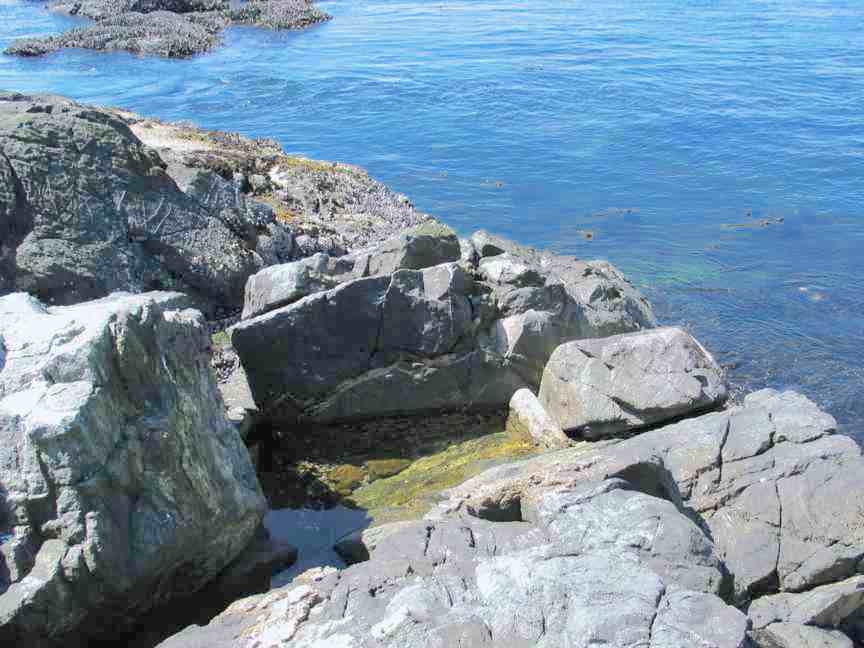
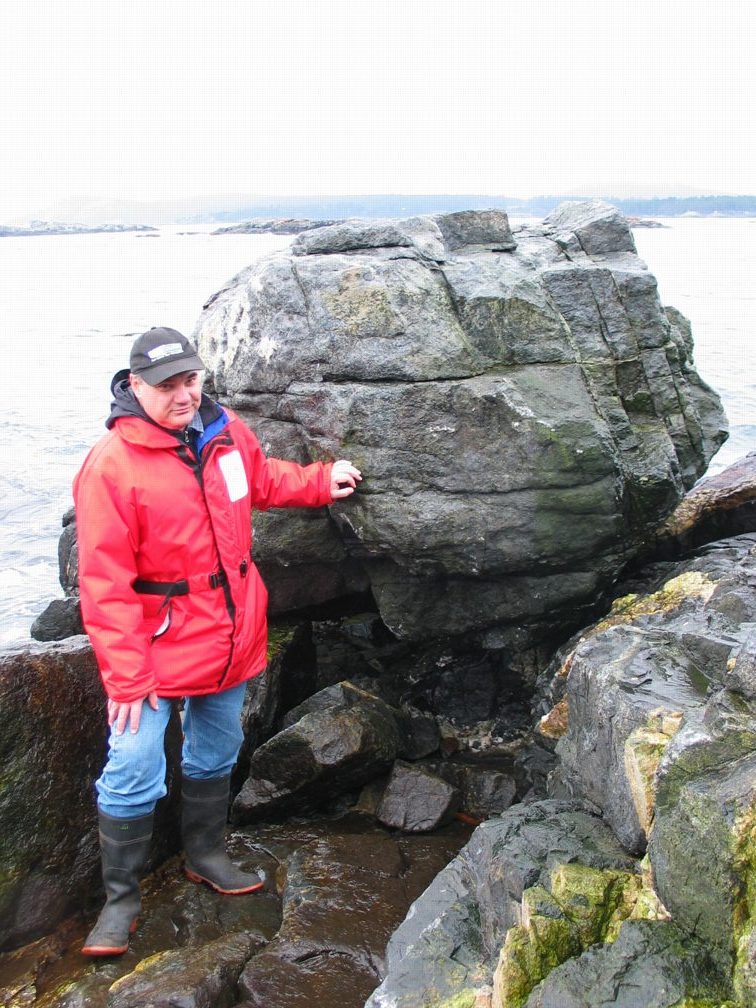
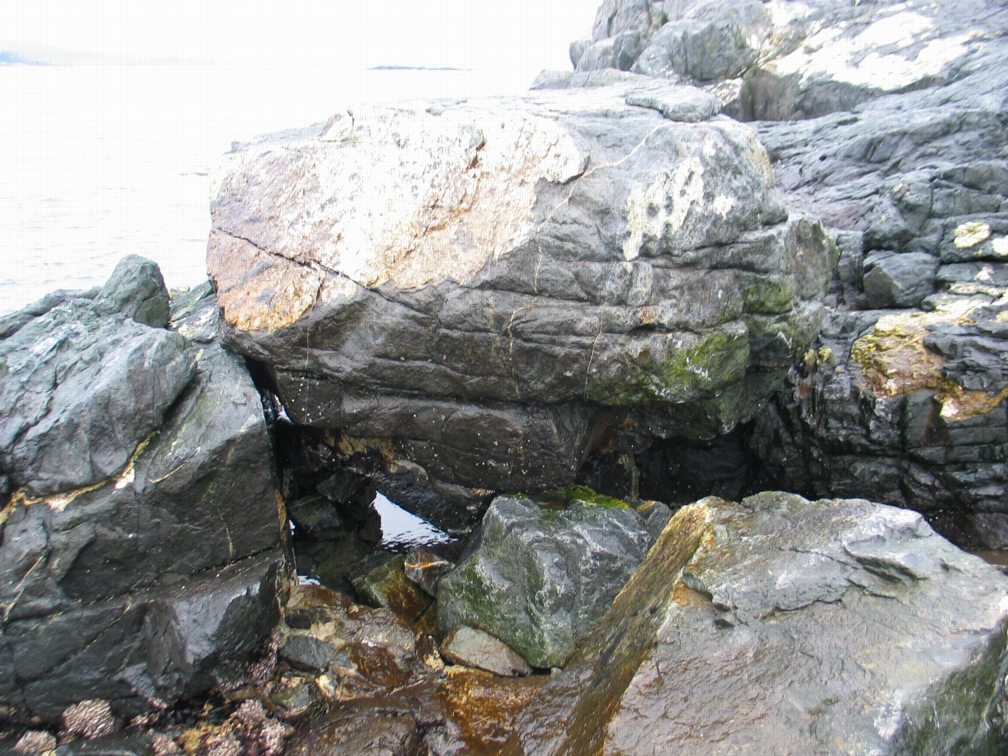
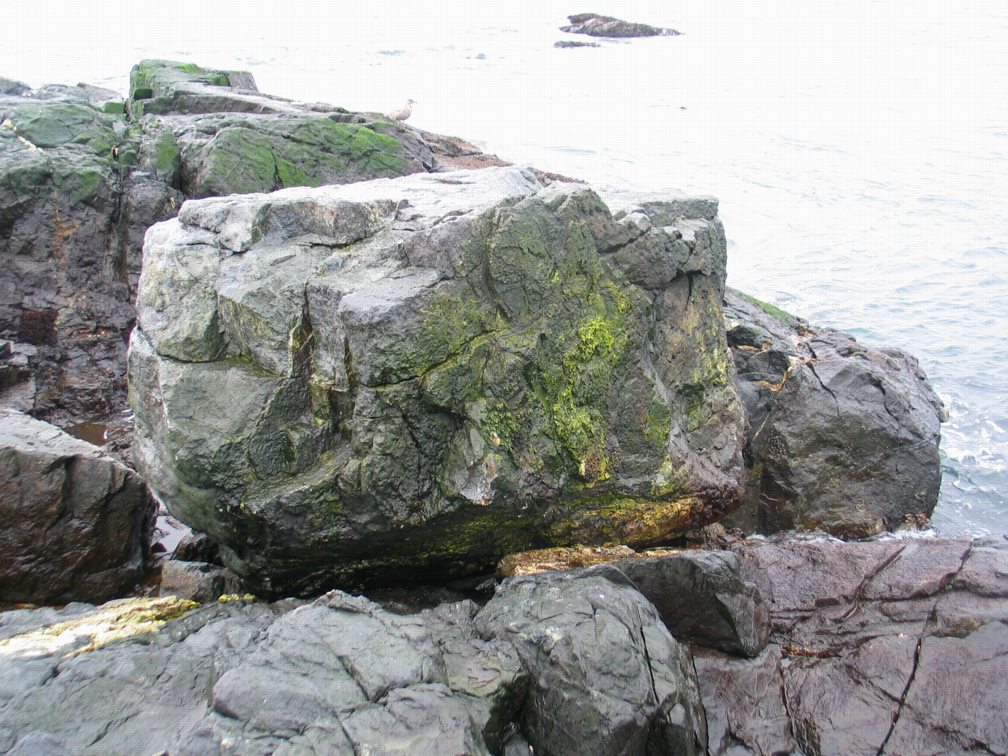
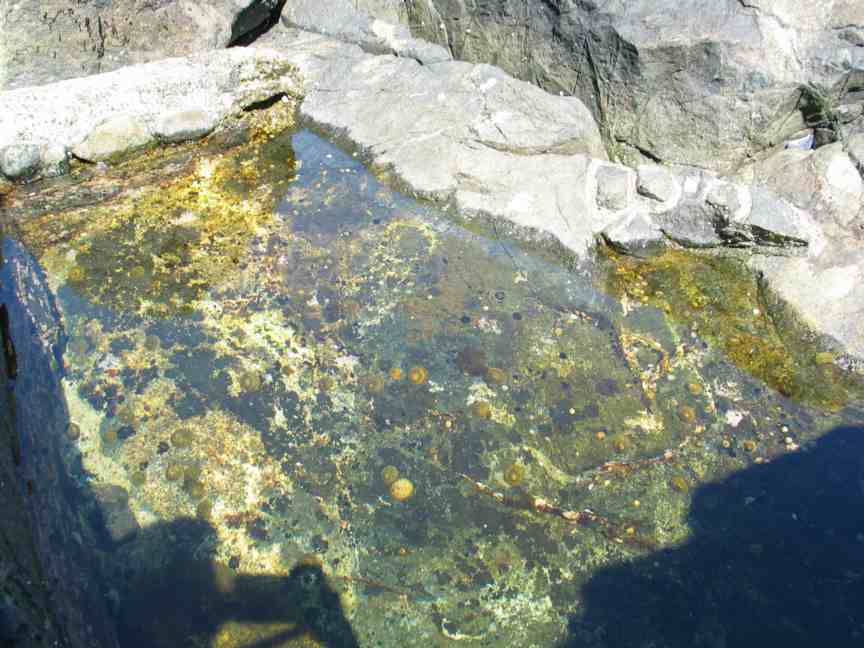
Artificial Tidepool #13 peg #5

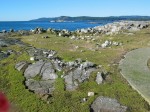
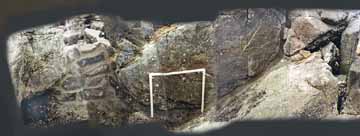
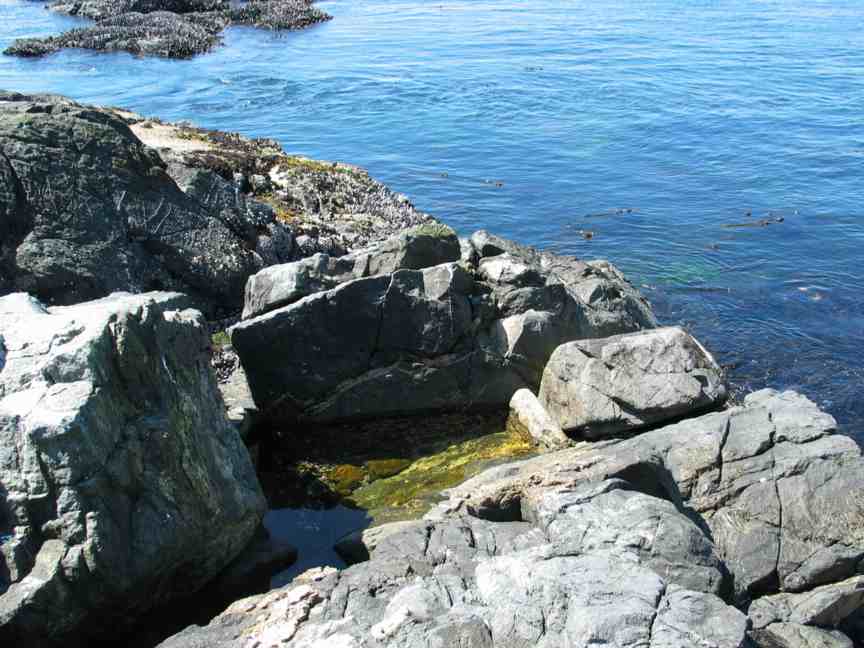
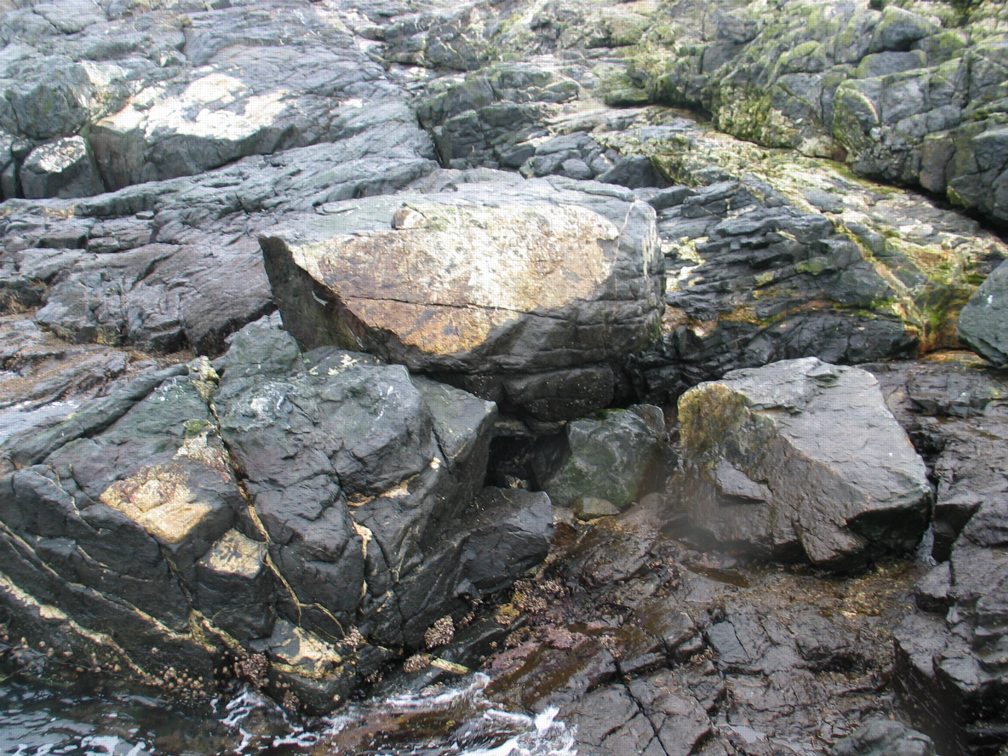
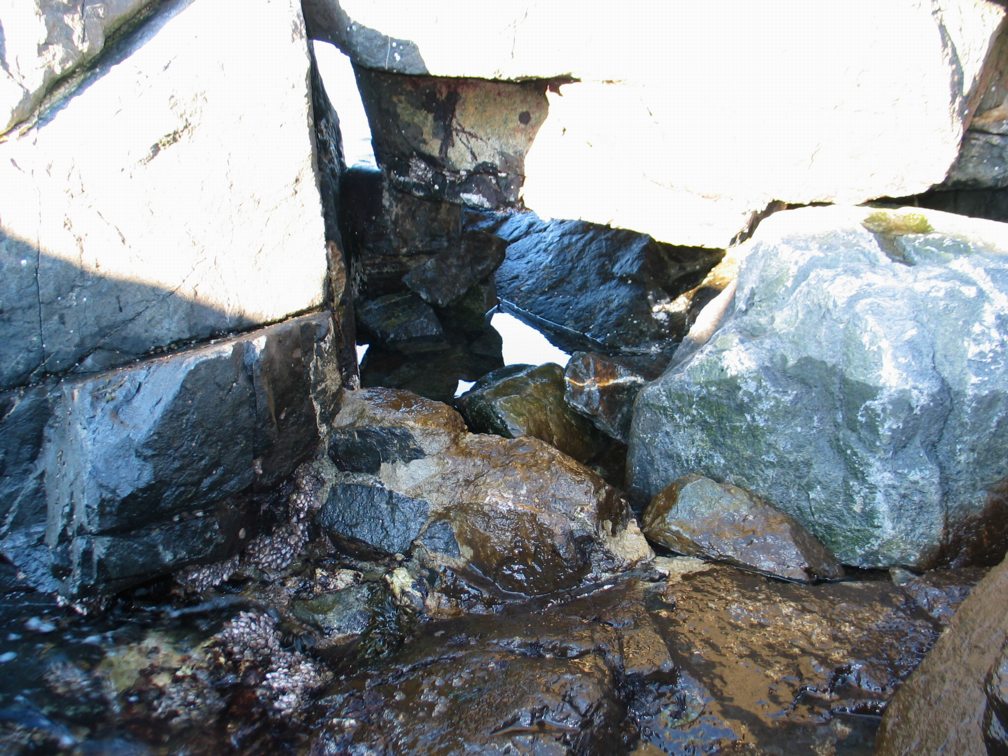
The rockwork done to seal the southern entrance

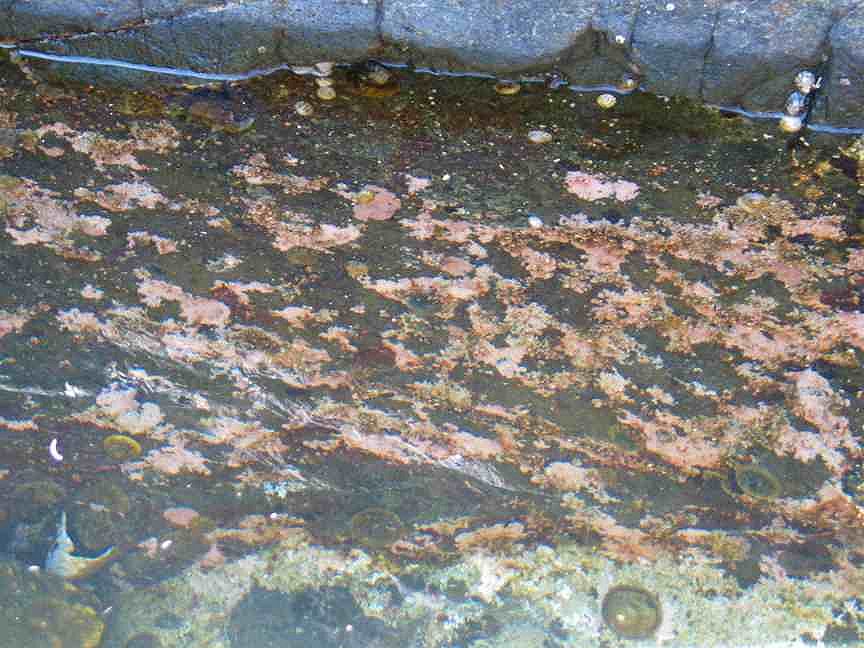
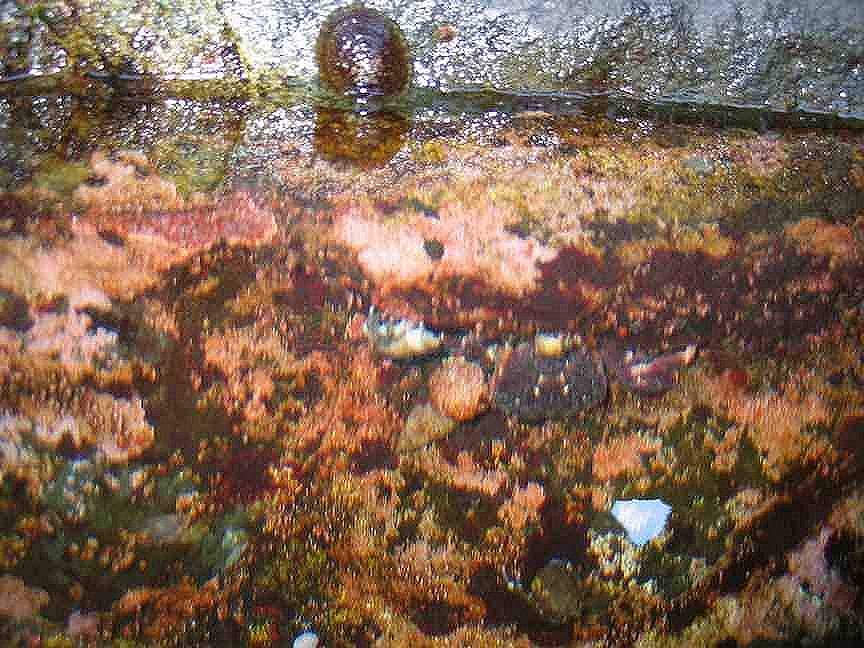
This artificial pool was made under permit from BC Parks by Mike Slater and Garry Fletcher in June, 1999. It is part of a long range succession study.
See also below for “AFTER the HURRICANE”

AFTER THE HURRICANE OF DECEMBER 15, 2006  (newspaper item)

Wind at Race Rocks

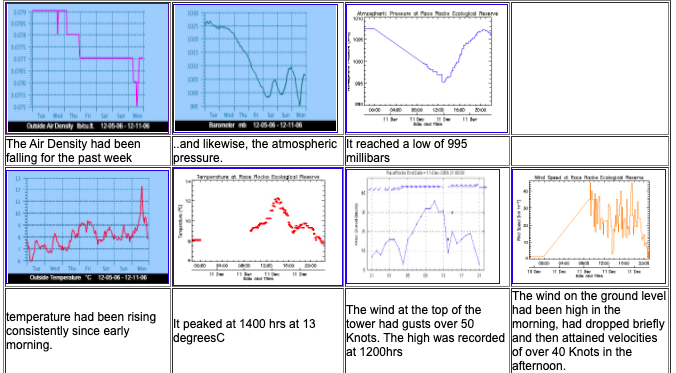
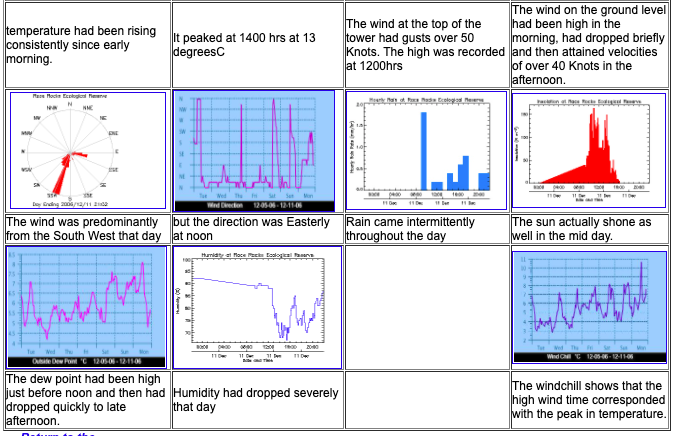
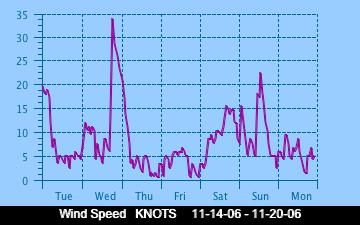
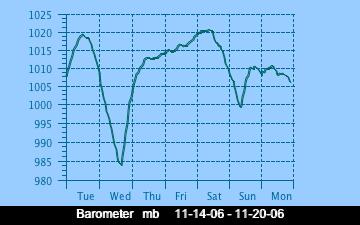
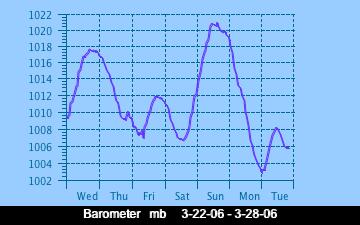
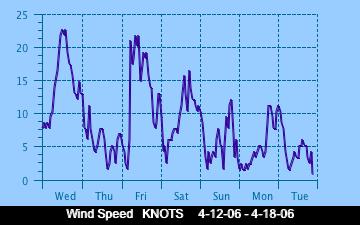
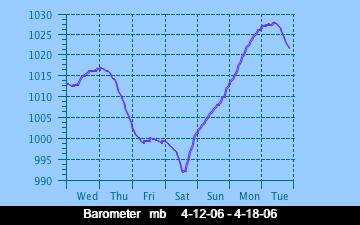
This video was taken with the remote camera 5 on Dec 11, 2006, a day which can be represented by the images of the atmospheric factors below. Note the wind speed was over 40 knots in the afternoon. The extreme pressure drop on the barometric graph was a good indicator that a big wind was coming.

It certainly can be seen as a wild mixture of weather for the day.


Correlation : Wind and Barometric Pressure Relationships

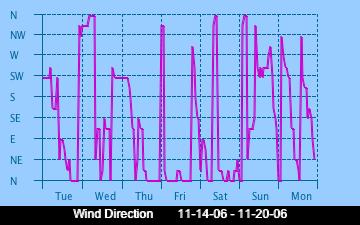
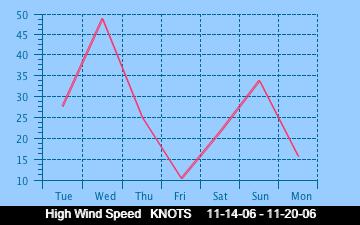
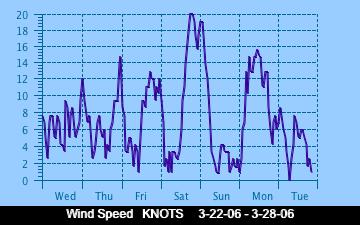
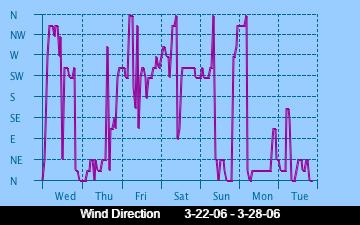
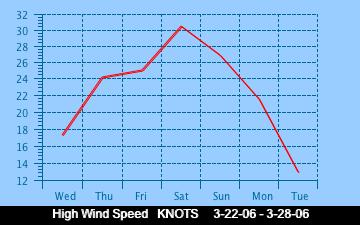
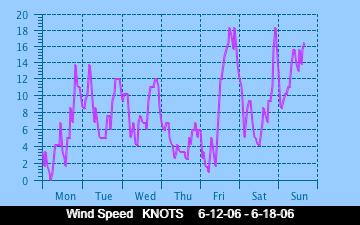
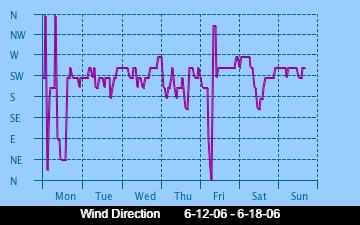
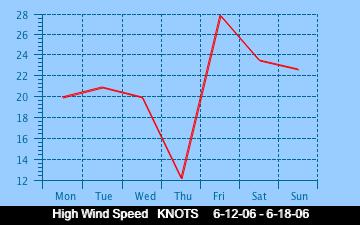
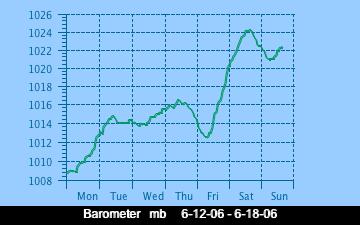
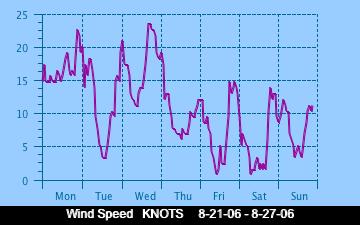
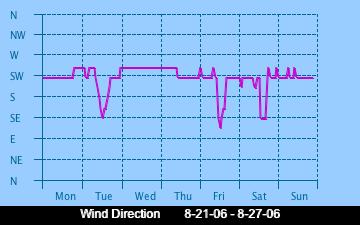
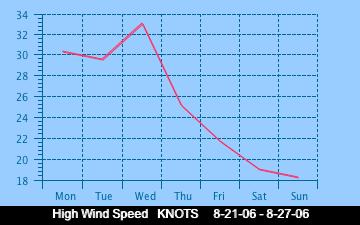
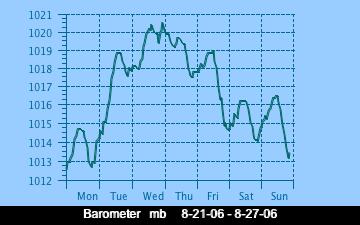
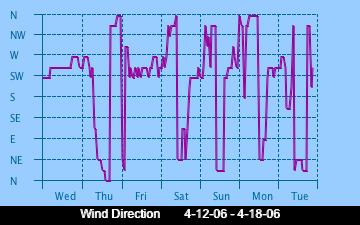
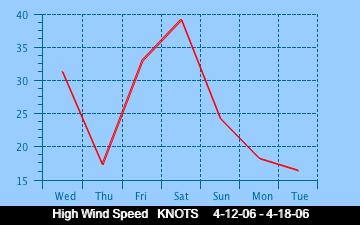
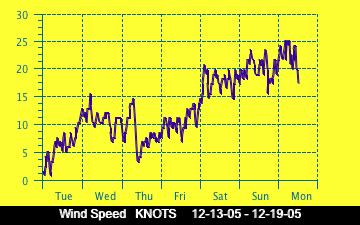
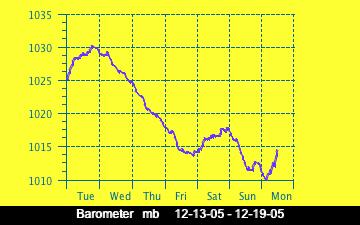
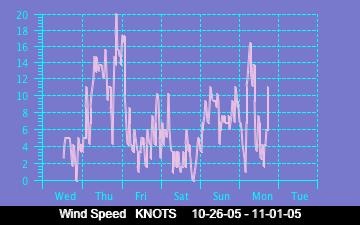
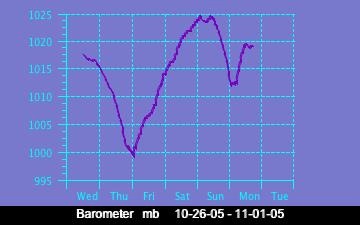
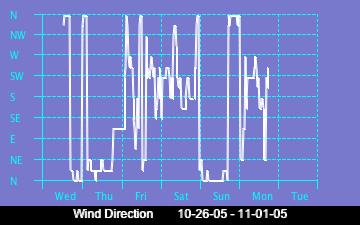
Below are presented some of the historical graphs of wind direction, wind speed and barometric pressure as recorded on the weather station at Race Rocks. . Several interesting problems can be posed from which one could form some hypotheses using these data. Make a similar comparison with the current week’s graphs.

Note: you may find some variations in patterns in the summer.

Tidepool Lab on a Windy Day at Race Rocks

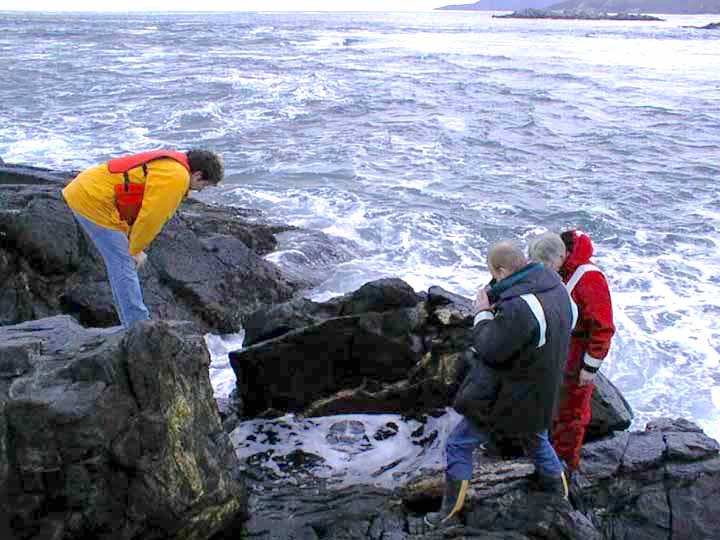
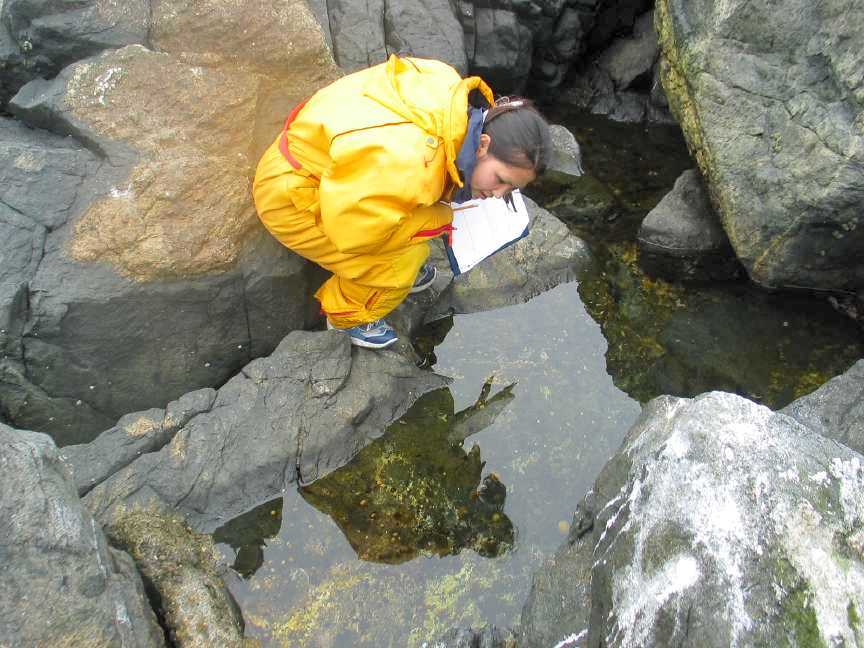
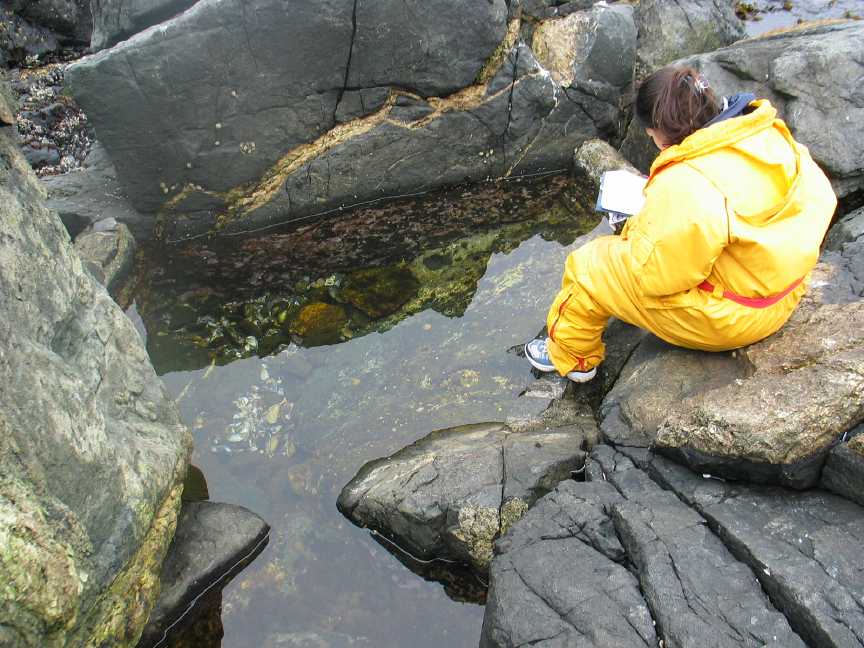
In April of each year we begin to get tides that are low enough for intertidal research. This video starts with students measuring temperature and salinity in tidepool #4 , then collecting “harpacticoids ” in tidepool #10, then doing further measurements in the new artificial pool #13. The wind was blowing at West 25 kn., but it didn’t deter our class!

Weather Data From October 1984 to February 1997

Ed note:  This data was collected by the Race Rocks Lightkeepers when the Canadian CoastGuard had Race Rocks as a manned Lightstation and is archived in the Environment Canada Archives.  In order to make graphs  you may copy any portion and paste in an Excel table and do the analysis  from there. 

Other archived weather data is being made available in the “weather -archive category”

You may copy and paste into an excel spreadsheet in order to do further analysis and graphs. Continue reading