Student Guide
Orientation
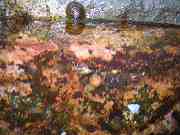
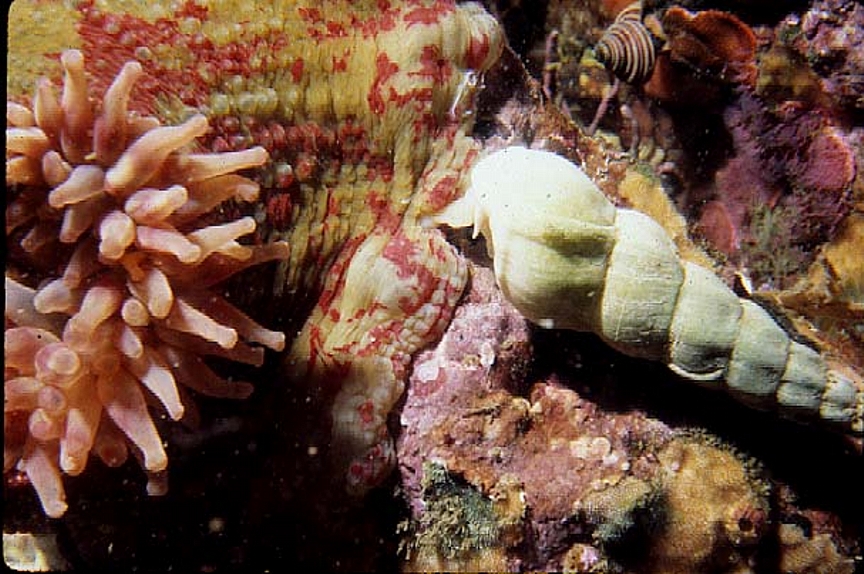
Have you noticed reports in the media about climate change and loss of species diversity?Have you ever encountered a special location which has a unique set of organisms that one doesn’t see anywhere else?Have you ever wondered why within a very short distance, the types of animal and plant communities can change entirely, whereas in other areas, one can go for hundred of kilometers without a change of species composition?Have you ever tried to make a plant grow where you want it to grow but find out it keeps dieing?We are slowly becoming aware that in order to preserve a species , we have to be sure the ecosystem of which it is a part is preserved intact..This project will enable students to contribute to a project which may help to shed some light on the questions above. We hope it becomes something that anyone can do long after they get the introduction through this exercise.
OBJECTIVES:1. Present hypotheses on the effect of an abiotic factor on the distribution of an organism, and data which supports the hypothesis.
2. Present evidence for why species change is predicted to be the result of climate change.
3. Relate the occurrence of climate change to species extinction.
4. Analyze the historic records for sea water temperature to see if you can find evidence for climate change.
5.Use the remote control camera to record the effects of weather extremes and correlate these with real time weather data.
PROCEDURE:
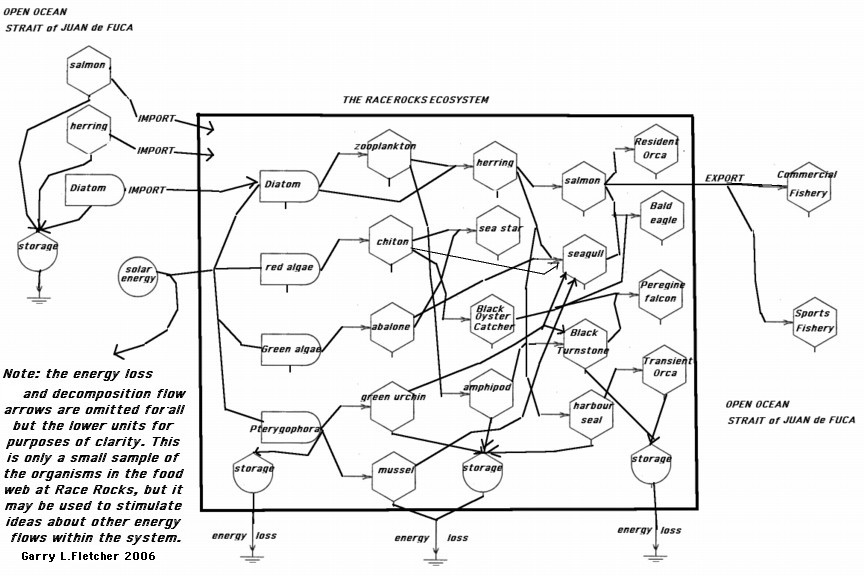
1. Introduction: On the website racerocks.ca, we have made an effort to show the relationships between species distribution and abiotic factors. Separate files for nine atmospheric factors and 8 ocean related factors are available from this environmental data index page: Take some time to familiarize yourself with the wide range of abiotic factors which we are recording at Race Rocks and at the files which show how those abiotic effects effect the organisms of the environment. Your task in this assignment is to record a graph of a weather event and correlate it with an image of the environmental response captured from the remote control cameras. See this file on Correlation Investigations
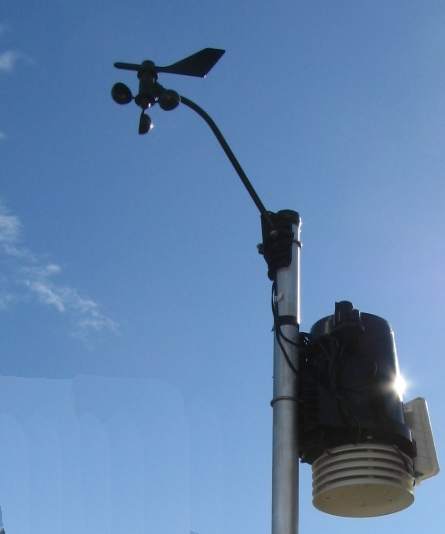
2. Wind Speed and Direction, are very significant factors in this kind of Coastal Ecosystem. Studies on correlations of barometric pressure and wind speed are also suggested in the Correlation File
3, Barometric Pressure and the Effect on Organisms: There is some question as to whether organisms can sense changing barometric pressure. Click on this file about barometric pressure and evaluate the evidence that scientists use to show that some organisms do have the ability to detect changing barometric pressures. What is the adaptive advantage of this ability? You may, with careful observation of animal behavior, come up with some evidence either supporting or rejecting this ability. On the racerocks.com weather station, track the weather at Race Rocks for a week. Within that time note the behaviour of animals when the barometer graph is peaking and then dropping . Can you establish a correlation between activity and impending storms?
Hint: to quantify, select a number of times from the graph when the wind is at it’s peak, and the barometer is at a low. Is there always a time lag, if so how much?.
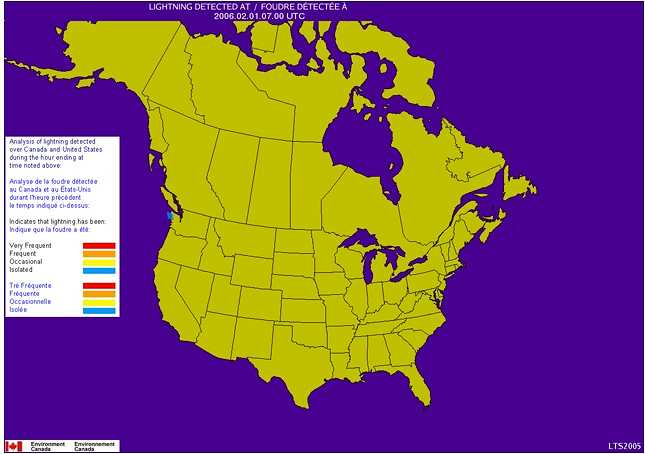
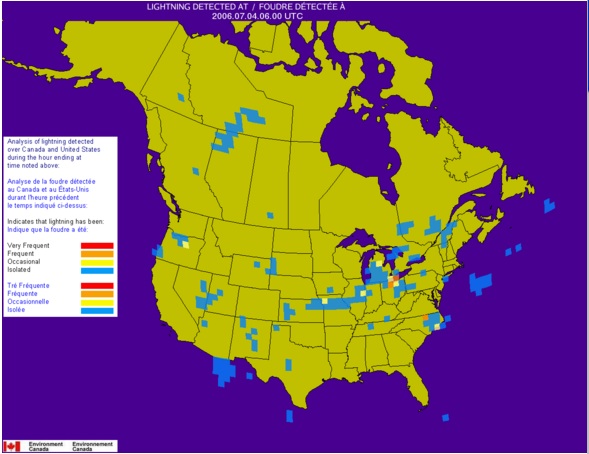
4. Lightning as an Abiotic Factor:
Some of the factors are much more important than others. For example: Lightning is of minor importance most of the time at Race Rocks, or for that matter, anywhere in the local Strait of Juan de Fuca area, compared to wind speed and direction.
Use the link on the lightning page to find out where lightning is presently occurring in North America. Calculate the frequency of lightning strikes and the area which is affected for any one viewing session. Find out from the reference about the abiotic effects of Lightning, about one of the important effects of Lightning related to Nutrient Cycles . There are obviously other abiotic effects of lightning. List two that you can come up with here.
If you can take a screen shot in the summer of this map showing lightning in the Strait of Juan de Fuca, enter it as an observation on the OceanQuest GIS sighting record.5. 5. Change Through Time:
The records of Salinity and Temperature have been collected by the lightkeepers at Race Rocks up to 1977 and by the Marine Protected Area Guardians from that time to the present. These records provide a valuable insight into how factors can remain stable or change over time. See the Archive of Seawater Temperature and Salinity 1921-present


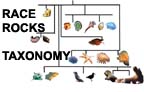
 Return to the Race Rocks Taxonomy and Image File
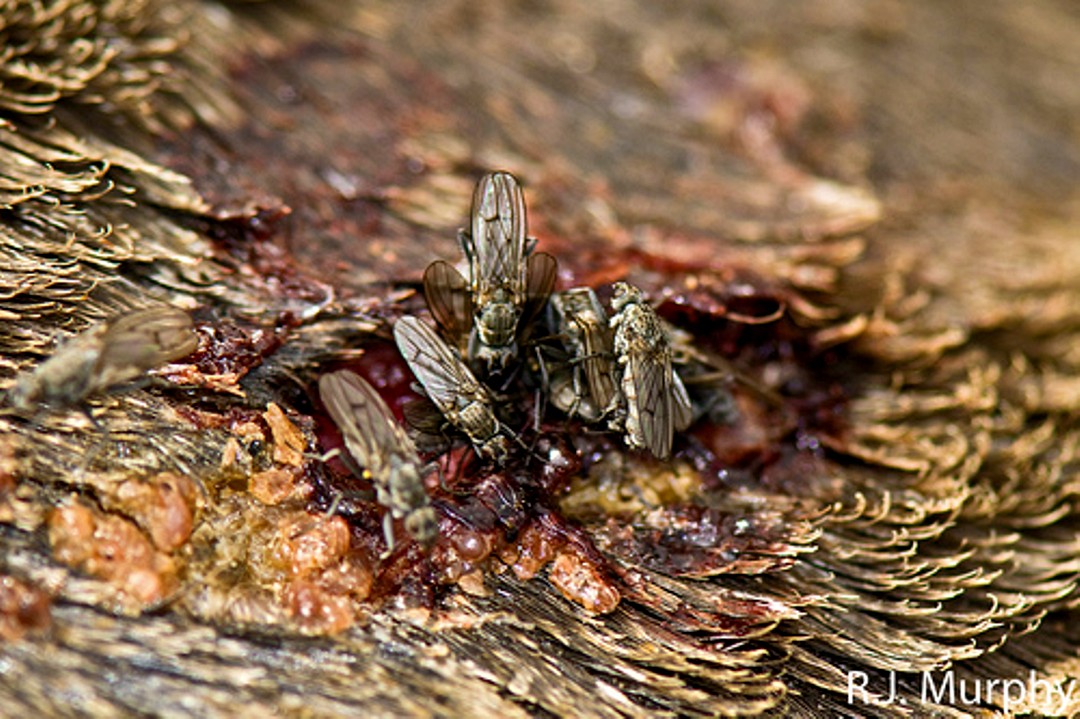
 The Race Rocks taxonomy is a collaborative venture originally started with the Biology and Environmental Systems students of Lester Pearson College UWC. It now also has contributions added by Faculty, Staff, Volunteers and Observers on the remote control webcams. Dec 2001–Ryan Murphy PC.