Energy Diagrams
1. Introduction Ecologist Howard T. Odum of the University of Florida created a set of symbols for the visual modeling of environmental systems. He called them energy diagrams. His symbols are very suggestive of biological processes. The first stage of our modeling consists of drawing an Odum diagram of the process, or system.
2. The Basic Diagrams The six energy symbols below suffice for most systems modeling. A complete set of the Odum symbols can be found in Odum’s publication.
These diagrams allow us to do qualitative modeling. Later, they maybe able to assist you in quantitative modeling. The lines denote energy pathways.
3. External Energy Source When the circle represents a renewable source such as sunlight, tidal flow, or a stream, it appears on the left. As the this energy flows by some of it is absorbed or pumped in by the system — the rest flows on by. When the circle represents human goods or services or products, it appears on the right.
4. The Heat Sink The term “heat sink ” comes from thermodynamics. In engineering, energy loss is usually thermal in nature. However, we recognize many other kinds of losses such as disease, noise and pilfering.
The heat sink symbol – without the arrow – comes from electrical engineering and denotes a ground. Electricity can flow in and out of a ground, but energy losses do not flow in and out of a heat sink. Once degraded energy goes into the sink, it does not return. The heat generated by your body when you exercise does not flow back into your body after it has left it and water in a bathtub that has cooled does not re-heat itself. The arrow suggests a one-way trip.
All real systems leak. Therefore, every system will have a heat sink attached, as in Figure 1. The paths to the sink will carry energy from various system processes or sources, so the heat sink represents generic energy loss.
5. Tanks As for systems, so for tanks within the system — they all leak. Tanks can have many energy pathways but one outgoing path will always go to the sink. Energy flow to the sink (and through all passive outgoing paths) is proportional to the quantity of energy stored. The box displays three specific examples of stored energy and how it can be lost.
| Tank Contents |
Energy Path |
Loss via the Heat Sink |
| Food |
Bacteria or fungi |
Decay |
| Soil nutrients |
Water |
Leaching |
| Business assets |
Unnecessary regulation |
Money and time |
|
Notice the general use of the term energy, far beyond the force x distance definition. We go beyond physical energy and the “Goods & Services” of economics. We also include the goods and services provided by nature, the Ecosystem Services. This is a topic we can pursue in another part of the OceanQuest Project. Among such goods, or natural products are oil, water, and salt. Among the services are the cleansing of waste water, the oxygen provided by rain forests, and the “buffering” of carbon dioxide by the oceans. In addition, we include the energy “embodied” in structure and information.
It is possible in more advanced studies to show a quantitative relation among money, time and energy , This is qualitatively apparent since money readily trades for energy in its various forms such as food, gasoline, and electricity. The relation is established by the truism “Time is money”
|
 |
Figure 2 shows an external tank feeding into a single tank that is exporting some of its energy. The external tank might represent an water source or aquifer, the internal tank a pond, and the outflow path a stream. Note that the sink is not explicitly shown on the external energy source |
6. Primary Production Chemosynthetic bacteria, Photosynthetic cyanobacteria bacteria, green plants and algae are the primary producers. They can transform chemical molecules such as carbon, hydrogen and oxygen into glucose and other biologically useful compounds. This basic process is known as chemosynthesis in thefirst group of bacteria and photosynthesis in green plants,algae and cyanobacteria. The production diagram will also be used for larger systems such as farms or ponds powered by the two primary producers. It might occasionally be used in a metaphorical sense to represent manufacturing. Production units will always have at least one back input and at least one top input.
|
 |
|
7. Consumption Units The remaining three biological kingdoms are the consumers – animals, fungi, and protochitsta, . The consumer diagram may also be used to represent cities, factories and bureaucracies. Consumers are classified by biologists as: Primary – bees, carp, mice Secondary – hornets, bass, weasels Tertiary – spiders, alligators, eagles. Below is a diagram with examples of all three types of consumers.
Figure 4 Consumer units — a food chain
8. Modeling A farm and a town interact in several ways. The farm produces food, sends it to the town and receives money in return. The town supples goods, such as chemicals or tools, and services in the form of labor and receives money in return. The first model of this situation might be fairly concrete, a pictorial one, as in Fig. 5. Notice that the energy paths are denote by solid lines, and the money paths by dashed lines.
Figure 5 Pictorial model of farm-town interaction
The next step is to replace the picture elements with an Odum diagram:
|
|
|
Figure 6 Model of farm-town interaction
|
Now add the currency or money pathway. This path tracks the energy path but moves in a counter direction:
|
|
|
Figure 7 Model of farm-town interaction
|
Energy is a part of the natural world, while currency is a part of the design world – a human construct. Currency represents energy but it is just an IOU in a standard, convenient form. Most countries have no hard cash thing to back up their paper money. The potency of paper money resides in the faith that users have in the country that issues it. Energy, on the other hand, does not depend on the opinion of the user or the vote of politicians. The dashed currency line should remind us of this precarious nature of currency, as opposed to the solid flow of energy.
9. Energy Mixer or Workgate This unit allows energies of different “qualities” to interact. The Farm-Town model provides a good example of how a work gate operates. The below diagram looks inside the production unit of the farm. Higher quality energy goes
in the top of the work gate, lower quality in the back. “Higher quality” can be taken to mean more expensive, more concentrated, or less abundant. All losses should have paths leading to the system sink. Sometimes “local” sinks are drawn to avoid a spaghetti entanglement of paths. These are just visual shortcuts – the system has only one sink. Note the explicit feedback from the stored energy in buildings & roads to the work gate. This is a “reward” for the farm work that maintains these important facilities. A work gate or production unit that contributes to a storage or a consumer can expect a feedback reward.
Exercise 5.1 Use your template to re-draw the diagram in Fig. 8. Add a currency path to the system diagram. It will be an open loop, going in and out of the system.
Exercise 5.2 Draw a matching diagram for the town “half”. To keep it simple, assume that the town is mainly dependent on one industry such as a canning or food-packing plant.
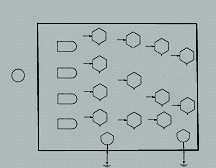
10. Pre-Columbus Culture There were approximately 600 First Nations tribes in what is now Canada and the USA. The Odum diagram below models a typical First Nation people living self-sufficiently on renewable energy.
|
|
|
Figure 9 North American First Nations People living self-sufficiently
|
Note that no currency paths are needed for this system. Some First Nations People did have currency or wampum, beads made from mollusk shells, and a variety of tools, clothing and decorative items used as Potlatch or trading items.
Exercise 1 Suggest some items that flow through paths 1 and 2.
Exercise 2 How would the items that flow through along paths 1 and 3 differ? Can you name three items of great food and cultural importance that flowed through path 3?
Exercise 3 Explain feedback path 5.
Exercise 4 Explain feedback paths 6 and 7.
Exercise 5 Explain feedback path 4.
This reference is based on the work of:
http://web.math.fsu.edu/%7efusaro/DL/index.html#toc5
References for further study:
Energy, Ecology, & Economics. by Howard T. Odum http://www.mnforsustain.org/energy_ecology_economics_odum_ht_1973.htm
Emergy Evaluation by Howard T. Odum
http://www.mnforsustain.org/emergy_odum_howard_t_emergy_evaluation.htm
Attribute to Eugene P.Odum
http://www.researchmagazine.uga.edu/summer2002/odum.htm
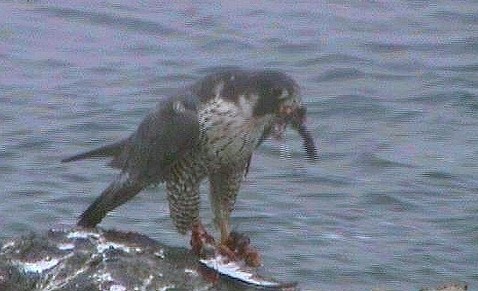
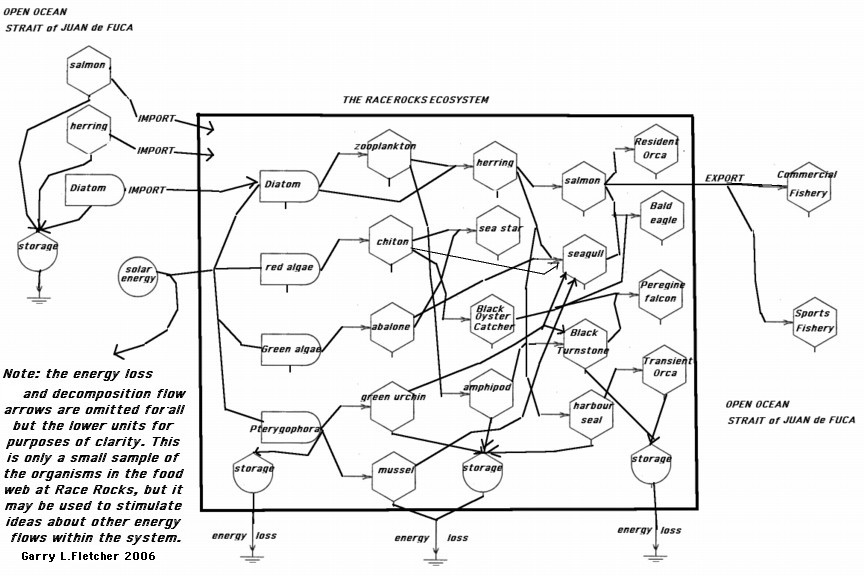
 Your challenge is to come up with a picture or a set of pictures which show energy flow in action. Watch the seabirds on the island, especially in the summer during nesting season as they deliver food to chicks. At low tide, you can often see shorebirds like the Black oyster-catcher as it hammers away at intertidal invertebrates for food. Use the OceanQuest GIS sighting report process to add your observation to the records.3. Use this blank template to construct an energy flow model for your observation.( For further information on the definition of the symbols, see #4 below. You can eliminate most of the boxes, just include ones for which you have direct evidence.4.
 This is a link to a resource which outlines the theory of modelling energy flow with odum symbols. You may also use it for further ideas that will help you in the construction of an energy flow diagram your own ecosystem.