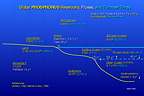
Animal Populations and Behaviors

BACKGROUND: In the populations of animals which we encounter at Race Rocks, we see a good representation of the biodiversity of the area. For years we have wanted to get a better idea of the levels of the bird and mammal populations throughout the year and also from one year to another. We have had scientists record the Christmas Bird Count in recent years, but we also need to have an idea of the population levels throughout the year. Scientists can determine the health of an ecosystem by knowing the trends of the populations through time. You have an opportunity here to contribute to the body of knowledge about the changes in populations through time.
Objectives: After doing this assignment, students will be able to:

a) Gather census data on populations of animals at Race Rocks using the remote cameras.

b) Use a simple dichotomous key for the identification of species.

c) Analyze the seasonal trends in populations of birds and mammals from Race Rocks

d) Describe the correlations between population trends on a particular day, and climatic conditions.

(If you are on sight at RR) you can document populations of species closeup such as in the surge channel or tidepool areas. Also physical factors such as ph, Salimnity and temperature, along with stratification can be recorded. These change through the seasonsd. If there is no reference file set up for one of the areas , feel free to start one and contribute it here. )

Procedure:

1. Census of Population: We will be estimating the numbers of a particular species in the areas visible from the remote control camera 1 or camera 5 of racerocks.com. Choose a bird or mammal species while viewing the area through camera .Verify the identification of a species observed by using the Dichotomous key for birds and mammals of Race Rocks.

2. Estimate the numbers of individuals of this species in the various sectors of the island visible from camera 5 and or camera 1. Record these in your data book.The ecosystems of Race Rocks are identified below in Table 1.

( You do not need to cover all sectors, however, if you choose a few and monitor them several times, you will get some figures that can be used to establish correlations with time of year, time of day, weather conditions or whatever you define as a possible physical factor that determines population distribution.)

3.Record the location of the population on the Sector maps of Race Rocks. Click on the appropriate image below for the sector designation. Where possible, capture a photo and include it with your data report..

4. Record the weather conditions from the weather page, and indicate weather you think that they have any effect on the population levels and locations.

Note: In the table below other sectors not visible from the cameras such as the tidepools have been numbered. If you are doing research on the island you can link to thespecific tidepool file with the number referred to in the list below.
Great Race Sectors from Cam 1 Great Race Sectors Race Rocks Reserve Sectors
Great Race Sector Image Map for Camera 1 views
Click on the pink-outlined polygons to identify the extra views from camera 1 not visible from cam 5.
Great Race Sector Image Map for Camera 5 viewsClick on the red-outlined polygons to identify the views from camera 5. Race Rocks and Race Passage Sector Image MapClick on the red-outlined polygons to identify the outer islands views from camera 5
TABLE 1: Race Rocks Sector Designations:
1.0.1.1.8 Race Rocks
1.0.1.1.8.1 Shore and Rock Rise North East of Jetty
1.0.1.1.8.1.1 East Rock rise
1.0.1.1.8.1.1.1 East of House and Bay

1.0.1.1.8.1.2 East shore
1.0.1.1.8.1.3 Water to East
1.0.1.1.8.1.3.1 within 1 km
1.0.1.1.8.1.4 underwater
1.0.1.1.8.28.6 Winch House and grass plain
1.0.1.1.8.28.7 North lawn to dock
1.0.1.1.8.3 Shore North of Jetty
1.0.1.1.8.3.1 Tidepool#14
1.0.1.1.8.3.2 Tidepool#15
1.0.1.1.8.3.3 Tidepool#16
1.0.1.1.8.3.4 Tidepool #17
1.0.1.1.8.3.5 Tidepool#18
1.0.1.1.8.3.6 Tidepool#19
1.0.1.1.8.3.7 Tidepool #20
1.0.1.1.8.3.8 Crevasse
1.0.1.1.8.3.8 underwater
1.0.1.1.8.4 Jetty and Jetty Bays
1.0.1.1.8.4.1 underwater
1.0.1.1.8.5 North Perch by cam 5
1.0.1.1.8.6 West Perch and cliff face
1.0.1.1.8.6.1 underwater

1.0.1.1.8.7 Rain Pools and close foreground -cam5
1.0.1.1.8.8 Heli pad and near camera 5
1.0.1.1.8.9 West shore and tide pool area
1.0.1.1.8.9.0
1.0.1.1.8.9 .1 Tidepool#1
1.0.1.1.8.9 .2 Tidepool#2
1.0.1.1.8.9 .3 Tidepool#3
1.0.1.1.8.9 .4 Tidepool#4
1.0.1.1.8.9 .5 Tidepool#5
1.0.1.1.8.9 .6 Tidepool#6
1.0.1.1.8.9 .7 Tidepool#7
1.0.1.1.8.9 .8 Tidepool#8
1.0.1.1.8.9 .9 Tidepool#9
1.0.1.1.8.9 .10 Tidepool#10
1.0.1.1.8.9 .11 Tidepool#11
1.0.1.1.8.9 .12 Tidepool #12
1.0.1.1.8.9 .13 Tidepool#13 artificial tp
1.0.1.1.8.9 .14 underwater

1.0.1.1.8.10 SW corner by surge channel rock
1.0.1.1.8.10.1 Surge Channel
1.0.1.1.8.10.2 South East Rise
1.0.1.1.8.11 South shore to Engine Room
1.0.1.1.8.11.1 Outfall surge channel
1.0.1.1.8.11.2 Shoreline
1.0.1.1.8.11.3 Underwater
1.0.1.1.8.12 Science House and lawn areas
1.0.1.1.8.13 Tower and Base area
1.0.1.1.8.14 Shore South and East of tower
1.0.1.1.8.15 South Rock Islands
1.0.1.1.8.15.1 Beyond South Rocks to Strait
1.0.1.1.8.15.1 underwater
1.0.1.1.8.15.2 underwater Rosedale reef
1.0.1.1.8.16 South-east rock beach bay
1.0.1.1.8.17 North side of the Keeper’s House
1.0.1.1.8.18 Water channel off docks
1.0.1.1.8.18.1 underwater
1.0.1.1.8.19 Middle Island
1.0.1.1.8.19.1 East islet of middles
1.0.1.1.8.19.2 Main middle
1.0.1.1.8.19.2.2.1 underwater
1.0.1.1.8.19.3 Turbine Channel
1.0.1.1.8.19.3 underwater
1.0.1.1.8.20 North Rock
1.0.1.1.8.20.1 underwater
1.0.1.1.8.21 North to Pedder Bay and Victoria

1.0.1.1.8.22 Race passage to Bentinck Island
1.0.1.1.8.23West ocean view area
1.0.1.1.8.24 West Race Rocks
1.0.1.1.8.24.1 underwater
1.0.1.1.8.25 Strait of Juan de Fuca West and South
1.0.1.1.8.25.1Within 1 km
1.0.1.1.8.25.2 Beyond 1 km

Lesson 2: Animal Behavior.Go to this file for the Animal Behavior lab.
Link to the Reference File for the Census Lab:

THE ENERGY FLOW ASSIGNMENT

OBJECTIVES: After doing this assignment, you will be able to:a) Trace the pathway of the flow of energy in a portion of the Race Rocks Ecological Reserve.

b) Use a symbolic model to represent energy flow in your own ecosystem.

c) Discuss the contributions of the Odum brothers to the science of Ecology.

PROCEDURE:1.Energy Flow in the Ecosystems of Race Rocks can be partially represented by the figure1.Click on any of the boxes to see the organism which is part of the energy flow and the food web of the Islands.
2. You will have seen that some of the links, especially for the top level consumers have videos and slide shows of energy flow in action involving the predators at Race Rocks. Some of these images have been submitted by viewers using the remote camera 5 .
Your challenge is to come up with a picture or a set of pictures which show energy flow in action. Watch the seabirds on the island, especially in the summer during nesting season as they deliver food to chicks. At low tide, you can often see shorebirds like the Black oyster-catcher as it hammers away at intertidal invertebrates for food. Use the OceanQuest GIS sighting report process to add your observation to the records.3. Use this blank template to construct an energy flow model for your observation.( For further information on the definition of the symbols, see #4 below. You can eliminate most of the boxes, just include ones for which you have direct evidence.4.This is a link to a resource which outlines the theory of modelling energy flow with odum symbols. You may also use it for further ideas that will help you in the construction of an energy flow diagram your own ecosystem.

5. Extension material: Investigate the work of the Odum brothers, in material linked at the bottom of the reference in #4. Write a paragraph on the significance of their work for the modern understanding of Ecology.

6..Extension Material: Investigate the application of the Odum Energy Flow Models in the reference below on the Ebro Watershed.


Figure 1: Energy Flow at Race Rocks…click on the symbols below

For Further Reference on the application of this model: External Link: Models of Energy Flow for Rural Planning in the Ebro River Watershed

Vertical Structure in Ecosystems

tplimpetcrabmIntroduction: In this file, we show the process of identifying vertical structure, the results from some measurements and guidelines on how to conduct an inquiry into vertical structure of an ecosystem.

Objectives: After doing this lab, you will be able to:
a) Analyze how vertical stratification in your own ecosystem produces a number of different micro-habitats, and predict the effect of this stratification on organisms.
b) Determine which abiotic or biotic factors influence vertical stratification in ecosystems.
c) Design your own protocol for analyzing the effects of vertical structure on ecosystems.

Procedure:
1. Since Race Rocks has no trees,you may not think that the vertical distribution of the ecosystem is very important. Here elevation is a major feature however, as it determines perches for safe lookouts for birds and spaces to haul out for the marine mammals so that they are out of the range of waves and rough sea conditions.

For instance, the favorite perch of the peregrine falcon is on the FM antennae at the top of the tower.  Between October and December, in the mornings you may be able to find one perched here by checking on the robotic camera 5.
2. Go to this file with the dichotomous key for help in identification of birds and mammals.
3. Down on the ground where grasses and other vegetation exists, or in and around tidepools, there is vertical stratification even though the complete profile is only several centimeters in height. On Race Rocks, even the profile of the rocks has an effect of changing temperatures and humidity. See this lab done by students, showing the stratification of abiotic factors in tidepools. Describe in your own words what abiotic factors influence the distribution of organisms in tidepools.

4.Not only abiotic factors, but of course biotic factors also have a role in determining the vertical structure of ecosystems. In this picture taken on the West side of Race Rocks at a very low tide, you can see how the pulled back overhanging canopy of the green surfgrass Phyllospadix, creates the shelter necessary for a variety of invertebrate species. Go here for other intertidal images from this area.

5. Vertical profiles in the Ocean, with a Zooplankton Aquatic Profiler can model this.
6. Remember that an ecosystem may also extend below the ground level, so that temperature and water moisture levels are important factors influencing the distribution of species. We will soon add a file here that supports this idea.
7. Now that you may have a better idea how to look for the effects of vertical structure on ecosystems, design your own protocol for analyzing the effect that vertical stratification has on the abiotic factors affecting a species of an ecosystem you can study locally.

Return to the Assignment on Ecosystem Structure and Function
Return to the OceanQuest Index

Structure and Function of Ecosystems

BACKGROUND:
The “ECOSYSTEM PARADOX” : The assemblage of organisms and the physical, chemical, geological, and biological factors that determine their numbers, is what an ecosystem is all about. This community of organisms and the non-living environment with which they interact is called an ecosystem and all the populations of organisms inhabiting an area are a community .It is important to understand that these designations provide a convenient model or framework which enables us to understanding complex and interdependent processes. In the real world however, discreet packages called “ecosystems” do not actually exist, since everything on the planet is ultimately interrelated.Despite this, it is much more practical and convenient for scientists to look at the smaller interacting units of the planet, so we define oceanic ecosystems according to where they occur and the type of organisms which live in them. In this part of the OceanQuest Project, we will investigate some specific examples of how we can organize an ecosystem in our own minds in a famework of Structure and Function.
OBJECTIVES: After doing this project, you will be able to: a) Outline what is meant by the structure and Function of an Ecosystem using as an example an ecosystem near where you are living.

b) Analyze how the effects of vertical stratification in your ecosystem produce a number of different micro-habitats, and predict the effect of this on organisms.

c) Describe the causes of horizontal distribution in several examples from the Race Rocks Ecosystems and then show similar examples in your own ecosystem

d) Document the kind of abiotic factors which are important in the Race Rocks Ecosystems and then describe those which determine your own ecosystem.

e) Model the process of Energy flow in an ecosystem.

f) Model how Biogeochemical cycles operate in ecosystems.

g) Add the coastal classification designation to the level of the biotope to your observations .

h) Determine how the presence of rare species may be determined by environmental factors.

PROCEDURE:
Introduction:
1. Table 1 below shows one outline of the way that we can look at any ecosystem. You can see that there are a number of completely different components, which alone do not mean much. When taken together however, they help us to understand how the ecosystem is really working. In fact they help us to create a better “Model” of how the ecosystem works. Since many of our environmental concerns today are related to how we are damaging, interfering with, modifying or restoring ecosystems, it is useful to know how these whole systems work.. Take a full page and make an outline in a notebook with spaces similar to those shown in Table 1. Use this outline to help guide you through the different parts of Structure and Function. Make notations in the boxes to help you remember important points about how you will look at your own ecosystem.
2. One of the advantages of using Race Rocks as a model to study ecosystems is that many parts of these components can be studied remotely on the internet. Go to this file to see how you might use the robotic cameras to study the horizontal distribution of the ecosystem. It also provides several examples of how you can determine horizontal distribution of organisms.

3 . Since Race Rocks is rather devoid of trees, the vertical distribution of the ecosystem is not so obvious. It is however an important factor on a different scale, in the intertidal zone, in the tidepools, on the thinly vegetated rock surface and even below the ground. See this file on vertical distribution on the Race Rocks website which documents some of these variations. Then design your own protocol for analyzing the effect that vertical stratification has on the abiotic factors affecting the species of an ecosystem.
4. Biotic components comes next in our attempt to model the structure of the Ecosystem. All ecosystems have a set of organisms which are specific to that ecosystem. In some cases, the set of organisms indeed is the defining character of the ecosystem. We speak of “index species” or “the biotope” to help us define and characterize the ecosystem. On racerocks.com, we are continually updating the list of organisms which occur in the many definable micro-ecosystems of Race Rocks.

The students of the Biology and Environmental Systems classes of Lester Pearson College have helped in the production of the Race Rocks Taxonomy. If you go to that link, shown below, you can work through the hierarchy of a system of classification which allows you to pull up photographs, videos and descriptions of the species we have identified. Also a set of directions which can help you to set up your own taxonomy of an ecosystem near you can be found in the Adopt an Ecosystem assignment.In order to be sure that you understand how our Taxonomy works, we will go through the process of looking for information on the Elephant seal.

a) From the racerocks.ca home page click on the Ecosystem icon.

b) Select the image of The Race Rocks Taxonomy.

c) Follow with your cursor Kingdom Animalia/Phylum Chordata/Subphylum vertebrata/Class mammalia/ and then in the list you should see Mirounga angustirostris, the Northern Elephant Seal. You have essentially followed through the classification right to the genus and species level of this marine mammal often visible at Race Rocks.

5. Rare and Endangered Species: In some areas you will have rare, or endangered species. The abiotic factors may be so specific that only few organisms have adapted to survive in that ecological niche. Choose one of the species shown here that have been sighted only occasionally at Race Rocks, and propose an hypothesis about how environmental factors may determine the distribution of the rare species. It is anticipated that changing climatic conditions as the result of anthropogenic impact might lead to a change in the species that can tolerate the environmental conditions of the future.
6. We will now look at a new concept which involves classification of Coastal Ecosystems in terms of the “Biotope” The Biotope represents the quantum unit of the habitat combining both the abiotic habitat and its fixed biotic components.
7. Many of the abiotic components of the Structure of an Ecosystem are monitored at Race Rocks, and are indexed here in the Index of Race Rocks Environmental Data Index. .

Review this index, noting in particular that there are three sections devoted to :
PRESENT WEATHER DATA AND FORECASTS.
TERRESTRIAL ABIOTIC or PHYSICAL FACTORS
OCEANIC ABIOTIC or PHYSICAL FACTORS
Information from the weather station at Race Rocks provides the weather data when you add a sighting in the OceanQuest GIS database. Go to the Lesson on Abiotic Factors, where you will be able to investigate in greater detail how these determine the Structure of Life in the Ecosystem.

8. In the ECOSYSTEM FUNCTION section, Energy flow is modelled by a diagram showing the flows of a part of the food web for Race Rocks.

Go to this exercise to see what is involved in modelling energy flow and then draw your own energy flow models of your favorite ecosystem.

9.Biogeochemical cycles represent the other part of the FUNCTION of ECOSYSTEMS.
In this part of the assignment, you will be able to assemble some examples of biogeochemical cycles from images of Race Rocks, and from this get the ideas of how to model your ecosystem’s biogeochemical cycles.
TABLE 1. Structure and Function of Ecosystems
1.0 ECOSYSTEM STRUCTURE
1.0.1 DISTRIBUTION OF
POPULATIONS OF SPECIES
1.0.1.1 Horizontal Distribution
1.0.1.1.1 random
1.0.1.1.2 regular
1.0.1.1.3 clumped
1.0.1.2
Vertical Distribution
1.0.1.2.1 Elevation
1.0.1.2.2 Stratification (terrestrial)
1.0.1.2.3
Vertical Stratification (Oceanic)
1.0.1.3
Temporal
Distribution
1.0.1.3.1
Present time
1.0.1.3.2
Hourly patterns
1.0.1.3.3
Monthly patterns
1.0.1.3.4
Yearly patterns
1.0.1.4.5
Long term patterns
1.0.2.1 Domain Eukarya
1.0.2.1.1
Kingdom Animalia
1.0.2.1.2
Kingdom Plantae
1.0.2.1.3
Kingdom Fungi
1.0.2.1.4
Kingdom Protoctista
1.0.2.2 Domain Eubacteria
1.0.2.3 Domain Archaea
1.0.3.1 Solar Energy
1.0.3.2 Wind Speed and Direction
1.0.3.4 Precipitation
1.0.3.5 Temperature
1.0.3.6 Current
1.0.3.7 Salinity
1.0.3.8 List Others??
2.0 ECOSYSTEM FUNCTION
2.0.1.1 Autotrophs
2.0.1.2 Heterotrophs
2.0.1.3 Decomposers
2.0.2.1 Carbon Cycle
2.0.2.2 Nitrogen Cycle
2.0.2.3 Phosphorous Cycle
2.0.2.4 Potassium Cycle
2.0.2.5 Calcium Cycle
2.0.2.6 Water Cycle
2.0.2.7 add other cycles
10.Extension materials: Report on how a research team is studying the Structure and Function of other Ecosystems. Use one of the following external links:ARCTIC and ALPINE Ecosystem Structure and Function Research.<.http://instaar.colorado.edu/research/ecosystems.html>


Biogeochemical Cycles of Race Rocks

BACKGROUND:
From the file Structure and Function of Ecosystems, we come now to that component which represents part of the Functional Aspects, the Material or Biogeochemical Cycles. In this file we will refer you to some of the cycles which are operating in ecosystems, but there are others of course, wherever minerals or ions that become part of the nutrients for plants are taken up by the plants and thus passed on through the other trophic levels or levels of nourishment.
Normally, most texts and many websites have diagrams of the cycles. ( just Google the cycle name) The approach of presenting a completed diagram is rather boring, as it is more interesting to just look around yourself in the ecosystem in which you are living and using other diagrams as models you will easily be able to build up the cycle using local examples yourself.
OBJECTIVES: After doing this assignment students will be able to:a) Construct digital image biogeochemical cycles using images of local examples.
b) Explain how biogeochemical cycles are impacted by anthropogenic activities.
c) Discuss your own responsibilities in terms of biogeochemical cycles.
d) Evaluate how you can help in dealing with the problem of sustainability of Materials cycles.

Many references on the internet give an opportunity to investigate ideas about how humans can be involved responsibly in sustainable cycles. Google “MSustainable Materials management”They deal with the issue that human activities are seriously affecting the materials cycles of the earth. What are examples of this and how can you personally do something about this?

CARBON CYCLE

Cup coral

Mussel shell

Diesel fuel

Anthropogenic Carbon

Anthropogenic Carbon

Dead kelp drift on the shore

Dead kelp drift on the shore


photosynthesis in a tide pool

rockfish

Live bull kelp

Anthropogenic Methane

Anthropogenic Methane

Dead seal- eaten by eagles and gulls

phytoplankton

Native grasses

Native grasses


Smoke stacks (pulp mill) across the Strait in Port Angeles

NITROGEN CYCLE

Eagle feces

air

lightning strikes

Anthropogenic Nitrous

Beach pea–Legume

Elephant seal soil– urine.

Elephant seal feces

Fish bones

PHOSPHOROUS CYCLE

Cabezon fish

bird bone

Canada geese

goose droppings

vegetation

phosphorous

lichen on rock

Fish bone

CALCIUM CYCLE

black oystercatcher eggs

pouring concrete

Bird Skeleton

coralline pink algae

California mussels

chiton with calcareous shell plates

seawater

Dead coraline algae

WATER CYCLE


water

clouds

tidepool

sun

native grasses

frost

seawater

rain

snow

drinking water

fog

Oystercatcher bathing

The Biotope: Marine Ecological Classification

BACKGROUND : In this exercise, we rely heavily on the work done by Scientists across Canada and the US. The NatureServe network includes member programs operating in all 50 U.S. states, in 11 Canadian provinces and territories and in many countries and territories of Latin America and the Caribbean.
NatureServe is a non-profit conservation organization that provides the scientific information and tools needed to help guide effective conservation action. NatureServe and its network of natural heritage programs are the leading source for information about rare and endangered species and threatened ecosystems.
NatureServe represents an international network of biological inventories—known as natural heritage programs or conservation data centers—operating in all 50 U.S. states, Canada, Latin America and the Caribbean. Together they not only collect and manage detailed local information on plants, animals, and ecosystems, but develop information products, data management tools, and conservation services to help meet local, national, and global conservation needs. The objective scientific information about species and ecosystems developed by NatureServe is used by all sectors of society—conservation groups, government agencies, corporations, academia, and the public—to make informed decisions about managing our natural resources. To visit the local website for any of these natural heritage programs or conservation data centers, use the reference: http://www.natureserve.org/visitLocal/index.jsp
The Classification Hierarchy

“The classification for coastal and marine habitats identifies and categorizes the physical environment at different spatial scales in estuarine, coastal and marine regimes, and places the associated biology in the context of the physical habitat. This is called the CMECS or Coastal and Marine Ecological Classification Standard.
The classification standard is organized into a branched hierarchy of six nested levels (Figure 1). The levels correspond to both a functional ecological relationships and a progressively smaller map scale from the order of 1:1,000,000 (Regime) to the order of 1:1 (Habitat/Biotope). The classification branches into five Regimes at the highest level: estuarine, freshwater-influenced marine, nearshore marine, neritic, and oceanic. Regimes are divided into large- scale physical structures, including geoforms and hydroforms called Formations. Each of these forms can be further compartmentalized according to its Zone, or position relative to the water: whether it is continuously submerged bottom or at the waterline (littoral), or within the water column. Each of these components further divides into Macrohabitat and then Habitat. The Biotope represents the quantum unit of the habitat combining both the physical habitat and its associated fixed biota. At each level, units are distinguished from each other by the application of classifiers that capture the defining differences among units. The classifiers are integral components of all levels of the classification; particularly the Habitat and Biotope levels that further define units based on such qualities as substrate, energy, salinity, turbidity or characteristic structural components. ”
See further reference including the Biotope definition below
OBJECTIVES: After doing this assignment, students will be able to:

a) Discriminate between and designate the six levels of Environmental classification for the different biotopes of Race Rocks.

b) Enter a Coastal Classification for one of the areas they can observe at Race Rocks .

PROCEDURE:

1. Choose one of the biotopes in the table below for an area you can observe at Race Rocks, either directly if you are able to go there or by means of the remote cameras .
2. In your notebook, justify why you classify the area that way, providing the list of the six levels.

ECOLOGICAL REGION
Level 1 REGIME— Level 2
Formation
Geoforms and Hydroforms
Level 3 Zone Level 3 b subzone Level 4
Macrohabitat
Level 5-Habitat Level 6 Biotope
ECOLOGICAL REGION
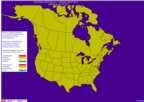
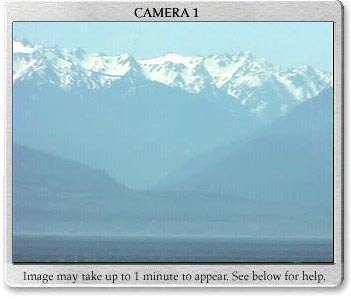
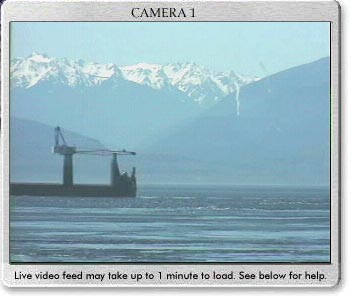
#21 COLUMBIAN PACIFIC.UTM— to —-?(The Columbian Pacific region stretches along the Pacific coast from Cape Mendocino in the South, northward to include the Straight of Juan de Fuca and end at northern tip ofVancouver Island, in the North. The region is home to abundant plant and wildlife, but also has one of the fastest growing human populations in North America. )
 
A. Estuarine regime
 A.01 Estuarine lagoon formation
A.01.WWatercolumn zone
A.01.BBenthic zone
Epibenthic subzone
Subbenthic subzone
A.01.LLittoral zone
Supratidal subzone
Backshore lagoon flats macrohabitat Biotope: Phragmites, cattail, reed canary grass
drainage channels macrohabitat Biotope: stickleback, cutthroat trout
Intertidal subzone
salt marsh macrohabitat Biotope: Distychlis, Salicornia
salt pans macrohabitat Biotope: acorn barnacle,
mud flat macrohabitat Biotope: wading birds,
drainage channels macrohabitat Biotope: iron bacteria,
Infratidal subzone
A.02Estuarine embayment formation
A.02.B bottom zone
A.02.L littoral zone
A.02.W water column zone
A.03 Estuarine Shoreline Formation
A.03.L
Estuarine littoral shore zone
A.03.L.a estuarine shore unconsolidated sediments macrohabitat
A.03.L.b  Estuarine shore unconsolidated sediments macrohabitat
A.03.L.f   Estuarine shore water column macrohabitat
B.Freshwater-influenced regime

C.03 Marine Shoreline Formation
Benthic zone
Epibenthic
Subbenthic
littoral zone
Supratidal
Intertidal
Infratidal
water column zone
Upper Water Column layer
Pycnocline layer
Bottom Water Column layer
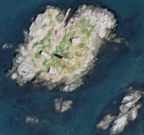
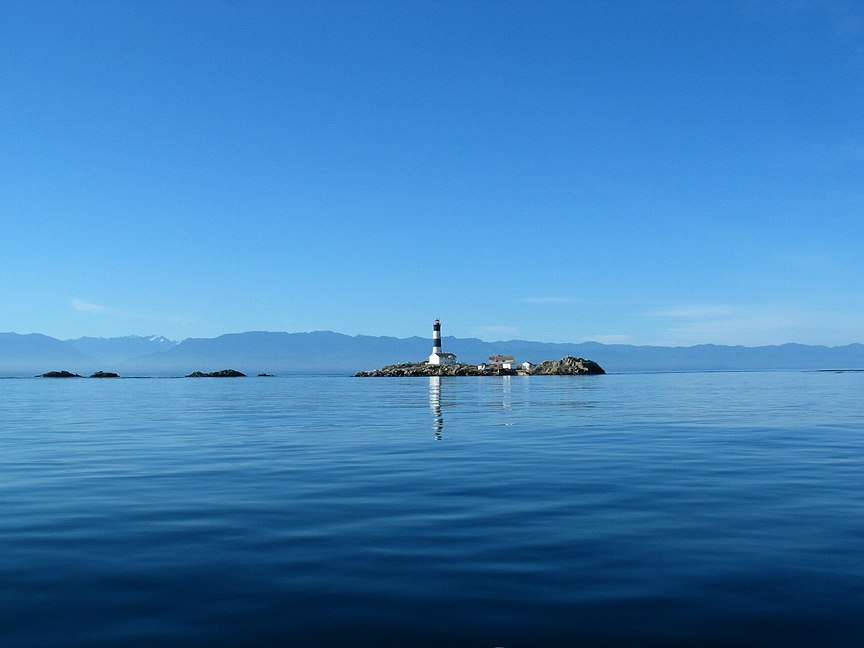
C.05 Nearshore Island formation
C.05.B Benthic or bottom zone
C.05.B.01Epibenthic subzone
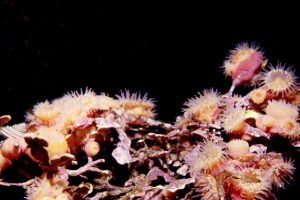
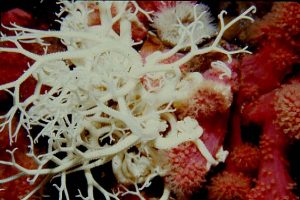
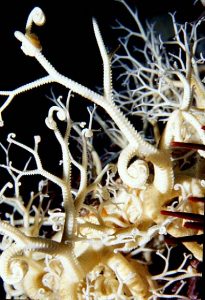
C.05.B.01aunder water– cliff face macrohabitat 
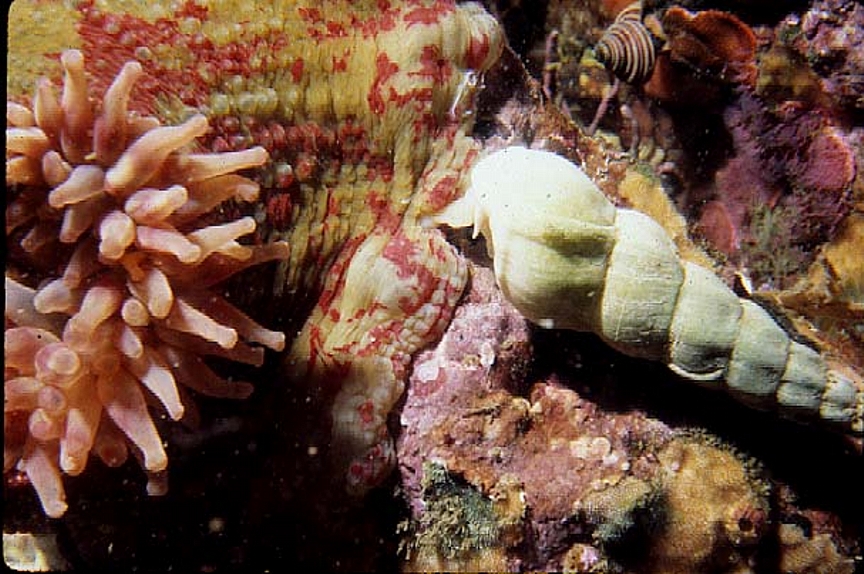
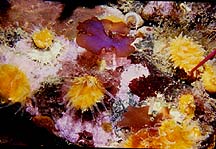
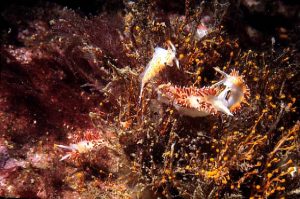
Biotope: basket star, Gersemia rubriformis (soft pink coral) hydroids (see reference .. 65 species),Gorgonocephalus eucnemis (basket star),
C.05.B.01btumbling rock macrohabitat 
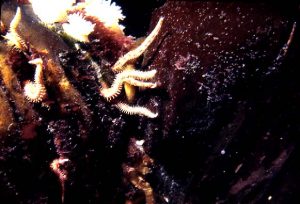
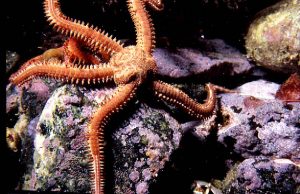
Biotope: Nereocystis luetkeana (bull kelp), Pterygophora californica (Stalked kelp), Calliostoma (top shell), Solaster stimpsoni( stripped sunstar), Pycnopodia helianthoides (sunflower star) Henricia leviuscula (blood star).Cucumaria miniata (orange sea cucumber), Metridium farcimen (Giant plumose anemone) Enteroctopus dofleini (Giant Pacific Octopus), Ophiothrix spiculata (brittle star)
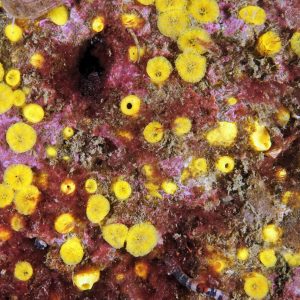
C.05.B.01chorizontal current channel macrohabitat Biotope:Cystodytes lobatus (lobed compound tunicate), Ascidians, Isodictya rigida finger sponges, Mycale toparoki (yellow sponge), Aglaophenia latirostris (ostrich plume hydroids) Tubularia regalis (regal pink mouth hydroid ) also other hydroid species
C.05.B.01dshell fragment bottom macrohabitat Biotope: Oligocottus maculosus (sculpin),Opalia chacei (Chace’s wentletrap)
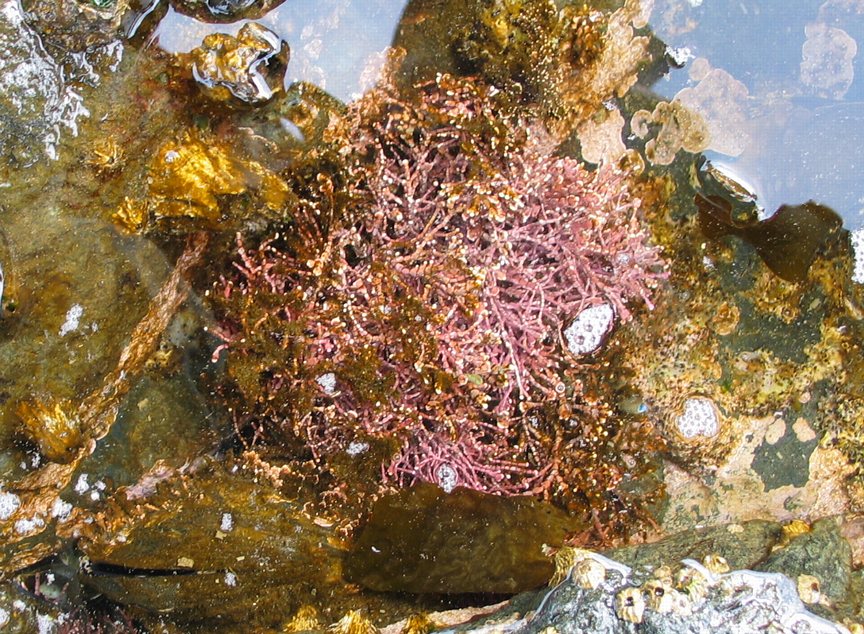
C.05.B.01ebare rock substrate macrohabitat Biotope: Lithothamnion sp. (encrusting pink algae), Dodecaceria concharum (coralline fringed tube worm) , Cucumaria pseudocurata (Tar Spot Sea Cucumber)
C.05.B.02Subbenthic subzone
C.05.B.02.ashell -fragment macrohabitat Biotope: Ptilosarcus (Sea Pen),Opalia chacei (Chace’s wentletrap)
C.05.B.02.bgravel, sand macrohabitat Biotope:Myxicola infundibulum jelly tube
C.05.B.02.c
mud macrohabitat
Biotope: none available
C.05.Llittoral zone..
C.05.L.01Supratidal subzone
C.05.L.01.arock cliff and boulder habitat
Biotope:, Cepphus columba (pigeon Guillemot) and Phalacrocorax pelagicus (pelagic cormorant )nesting, Phalacrocorax penicilatu, (Brandt’s Cormorant) and Larus thayeri (Thayer’s gull) overwintering.
Biotope:Romanzoffia (mist maidens) Plantago,
C.05.L.01.bupper island rock plateau habitat
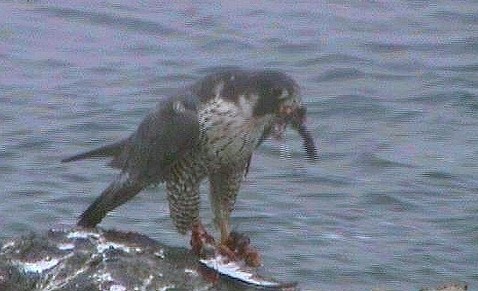
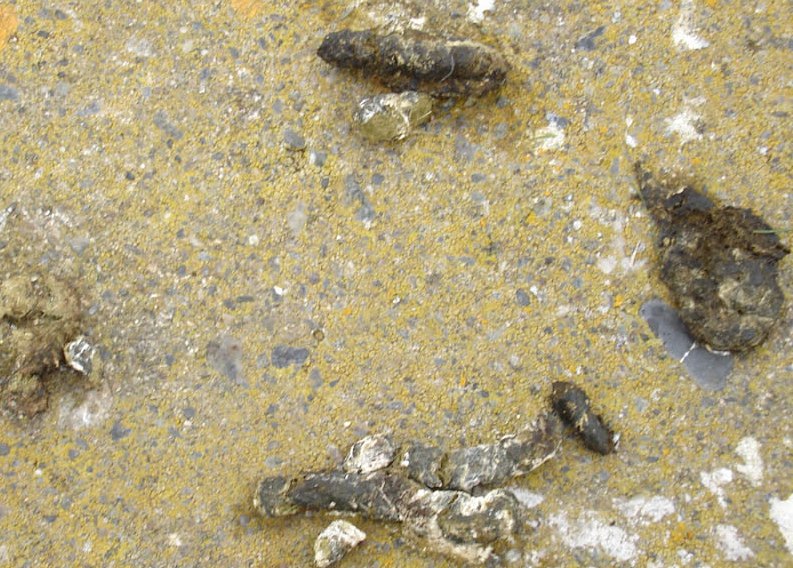
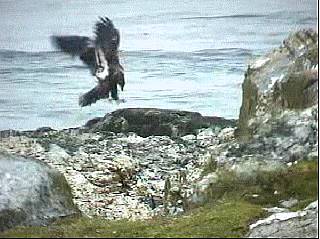
Biotope: thrift, Larus glaucescens (Glaucous-winged Gull) nesting, Phalacrocorax auritas, (double-breasted cormorant- winter resident), Haliacetus leucocepfalus ( bald eagle), Falco peregrinus (peregrine falcon) Corvus caurinus (North-western Crow) Corvus corax, (Raven–winter)
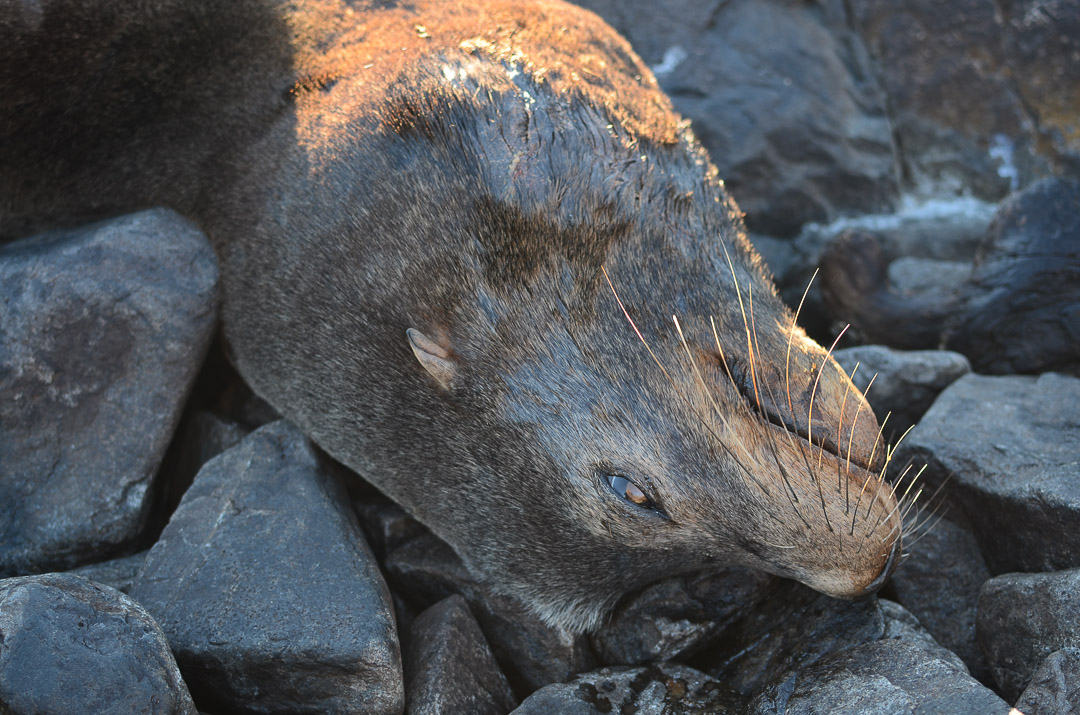
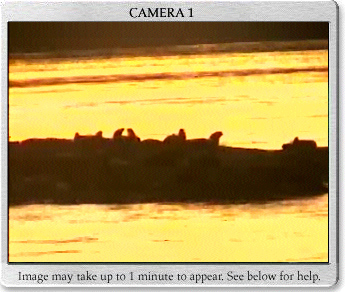
Biotope: Haulout for the following marine mammals: Harbour seal, Mirounga angustirostris (elephant seal), Zalophus californianus (California sea lion), Eumetopias jubatus (northern sea lion), Phoca vitulina Harbour seal.
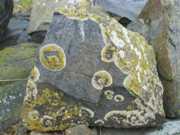
C.05.L.01.cupper spray Zone rock and gravel habitat
Biotope: Caloplaca verruculifera (orange lichen), Xanthorea candelaria (orange lichen) Lecanora straminea (grey lichen) Prasiola meridionalis (uppermost green algae
Neomolgus littoralis (red velvet mite)
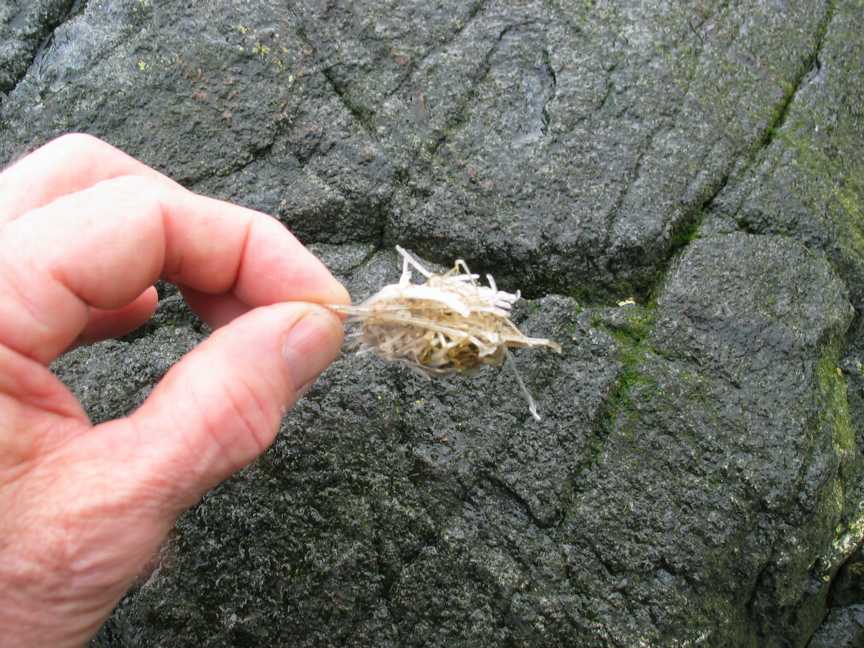
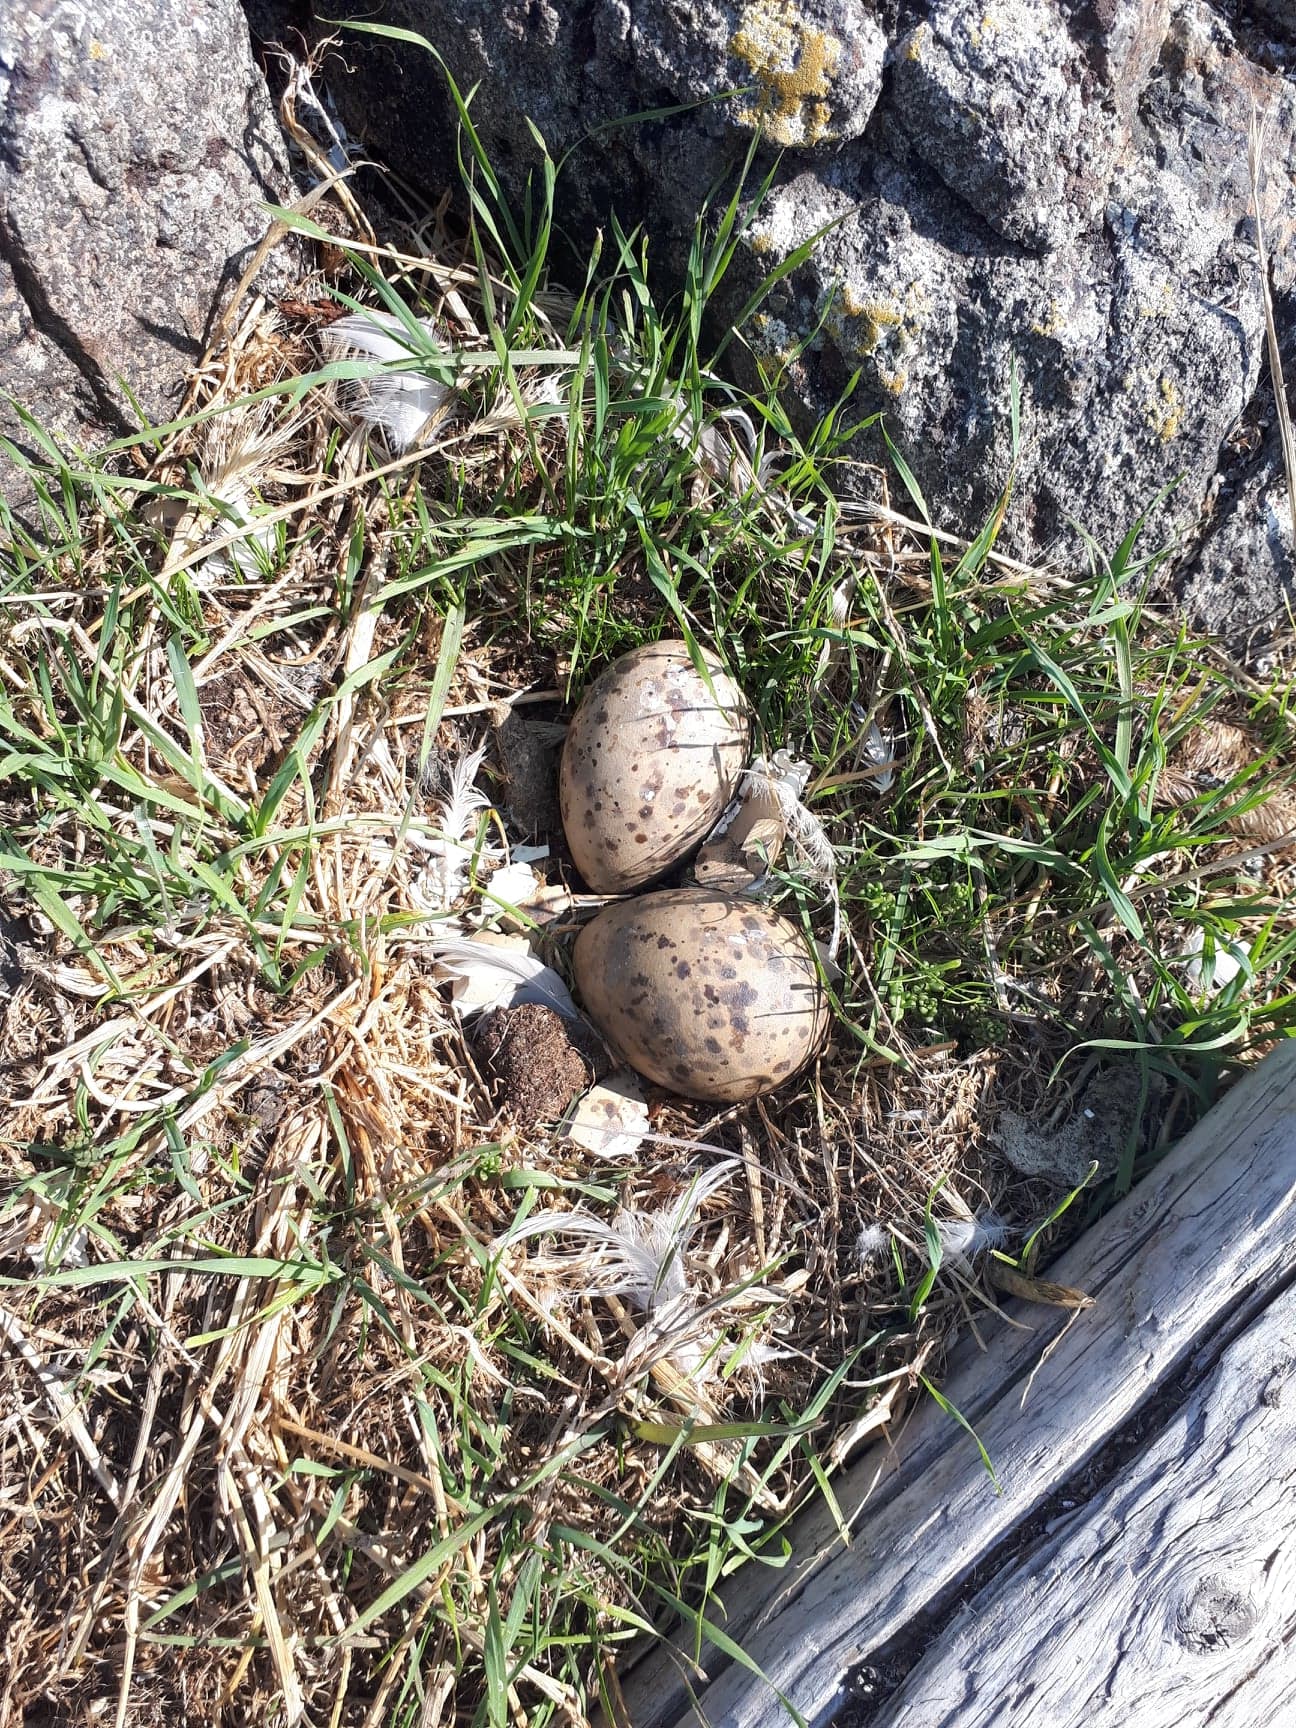
Biotope: Haematopus bachmani (Black-Oystercatcher nesting), Arenaria melanocephala (Black turnstone)
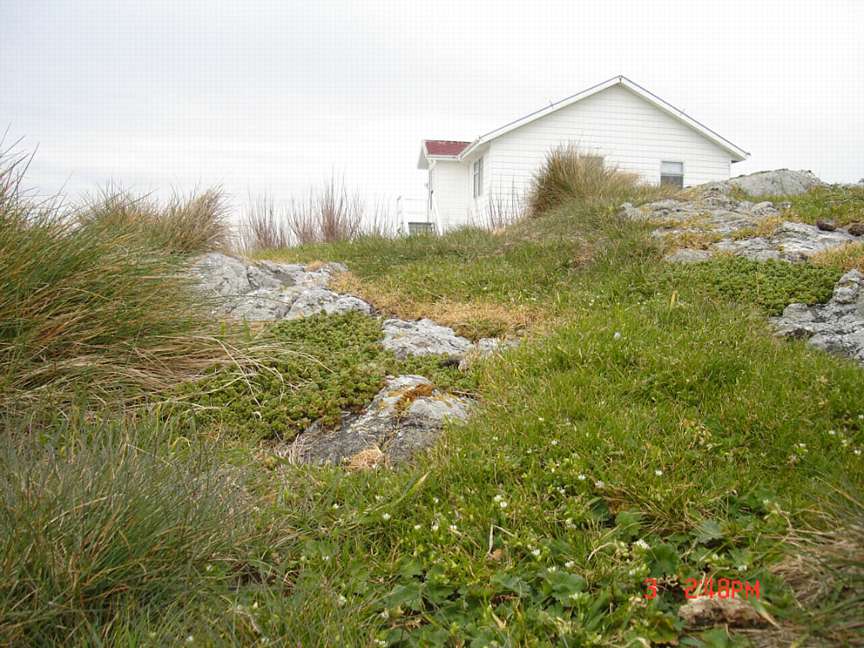
C.05.L.01.dinner island grassed plain habitat Biotope: Native fescue grasses, several flower garden escapes,
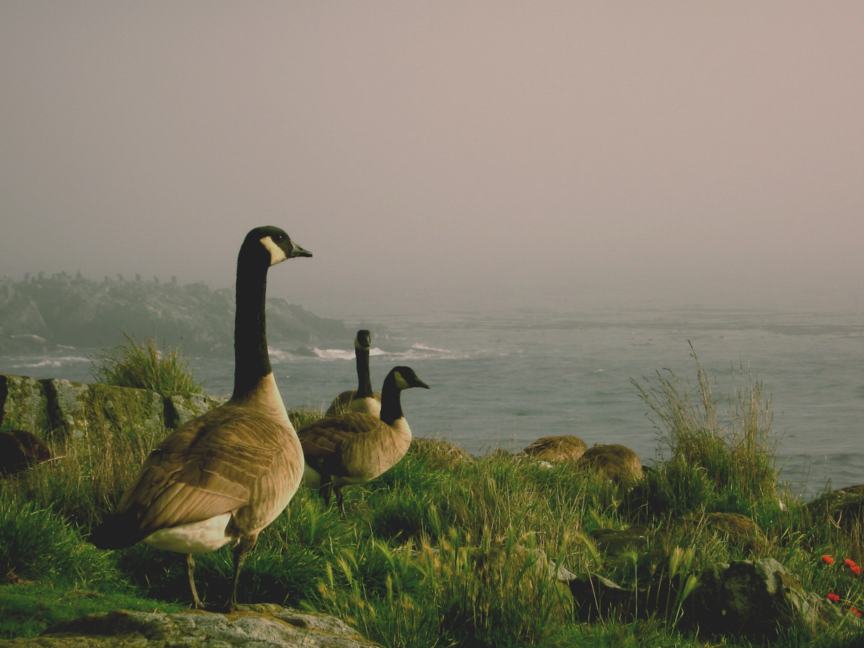
and introduced brome and orchard grass, Branta canadensis (Canada goose) nesting,
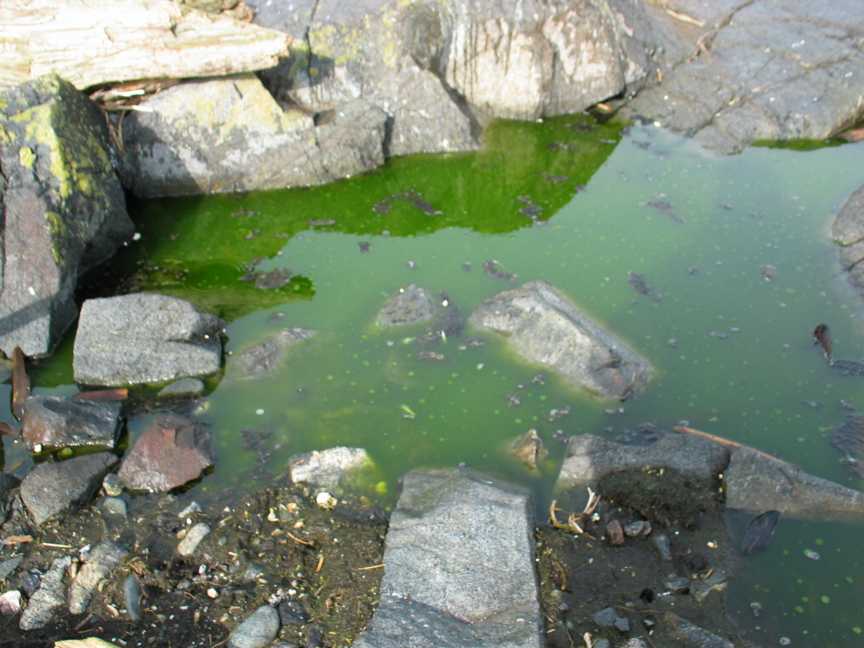
C.05.L.01.eBrackish pools in spray zone Biotope: Pyramimonas (green water pool )
C.05.L.02Intertidal subzone
C.05.L.02.a Rocky
shoreline….. macrohabitat
High energy intertidal boulders and loose rock sub-habitat 
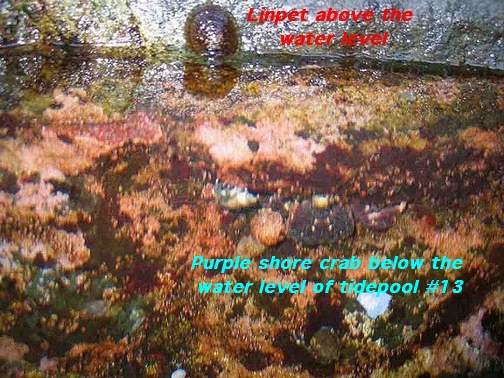
Biotope: Hemigrapsus nudus (Purple shore crab),
High energy intertidal high elevation tidepool sub- habitat Biotope: Harpacticoid, Littorina sitkana and Littorina scutulata (littorine snails, isopod
High energy intertidal low elevation tidepool sub- habitat 
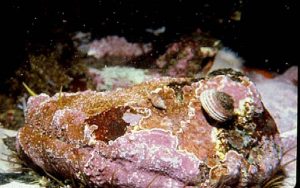
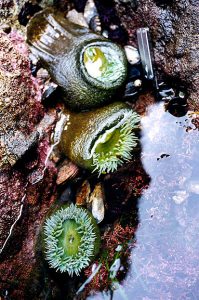
Biotope: low level pool: Phyllospadix scouleri (surfgrass) Strongylocentrotus purpuratus (purple urchin), Oligocottus maculosus (tidepool sculpin) Anthopleura xanthogrammica (Giant green anemone)
High energy intertidal solid substrate subhabitat Biotope: Porphyra, Halosaccion, Chthamalus sp.(barnacle) Neomolgus (red mite)
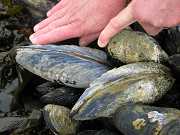
High energy/high current solid substrate habitat 
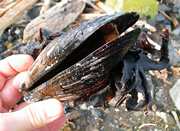
Biotope: Mytilus californianus, (California mussel), Anthopleura elegantissima ( small intertidal anemone, Endocladia muricata (red algae) Chthamalus (barnacle) Pollicipes polymerus (goose-necked barnacle)
Low energy solid substrate habitat Biotope: Alaria marginata (short stipe algae), Eudistylia vancouveri (feather duster worm) Mopalia mucosa (mossy chiton)
Surge Channel habitat Biotope: Polycepes polymerus (Goose-neck barnacles):Anthopleura xanthogramica (large intertidal anemone)
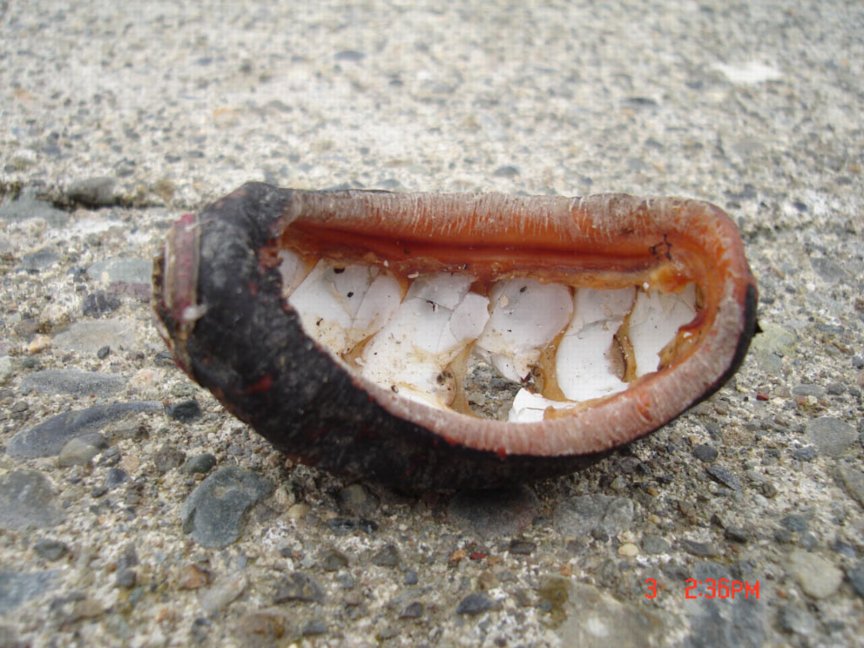
Intertidal reef habitat Biotope: Mytilus californianus ( mussel), Phyllospadix scoulleri (surf grass)
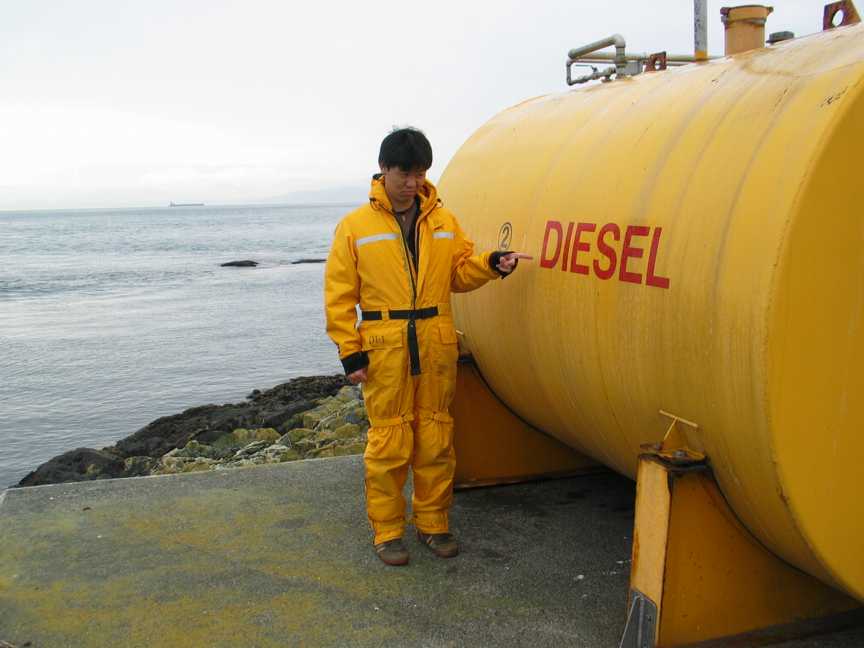
Anthropomorphic (human modified) structure:concrete dock. Chthamalus( barnacle), Ulva (green algae)
C.05.L.02.bHigh energy bay macrohabitat
Shell beach habitat Biotope:
sand beach habitat Biotope:
cobble beach habitat Biotope:
C.05.L.02.c.Low energy bay macrohabitat
Shell beach habitat Biotope:
sand beach habitat Biotope:
cobble beach habitat Biotope:
C.05.L.02.d High energy beach macrohabitat
Shell beach habitat Biotope:
sand beach habitat Biotope:
cobble beach habitat Biotope:
C.05.L.02.eLow energy beach macrohabitat
Shell beach habitat Biotope:
sand beach habitat Biotope:
cobble beach habitat Biotope:
C.05.L.03Infratidal subzone

Depth to 10 meters affected by tidal surge

C.05.L.03.asolid substrate macrohabitat
10 meter depth habitat Biotope: Nereocystis (bull kelp), Membranipora serrilamella (bryozoa) Epiactis prolifera (brooding anemone), Urticina crassicornis (Fish eating anemone)
5-10 meter depth habitat Biotope: Pterygophora californica (perennial algae)
0-5 meter depth habitat Biotope:Laminaria groenlandica (Brown Algae), Ophlitaspongia pennata (velvety red sponge), Calliostoma ligatum (Blue top snail)
C.05.L.03.bTumbling rock macrohabitat
10 meter habitat 
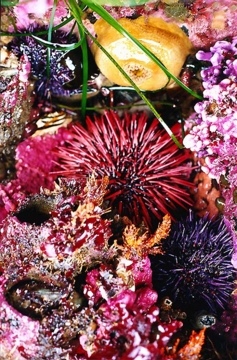
Biotope: Strongylocentrotus (red urchin), Cucumaria miniata (sea cucumber)
5-10 meter depth habitat Biotope:Strongyocentrotus purpuratus (purple urchin), Cucumaria miniata (orange sea cucumber), Strongylocentrotus droebachiensis( green urchin)
0-5 meter depth habitat Biotope: (leather chiton, limpet species, northern abalone.
C.05.L.03.c Shell fragment gravel pockets macro habitat
10 meter habitat 
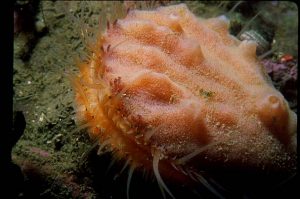
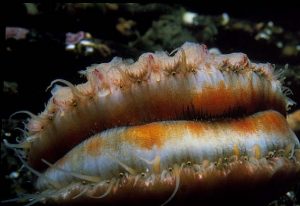
Biotope:swimming scallop, Opalia (chalces wentletrap)
5-10 meter depth habitat Biotope: sculpin
0-5 meter depth habitat Biotope: Surf grass, abalone, Laminaria saccharina
(brown algae)
C.05.Wwater column zone
C.05.W.01 and Upper Water Column layer subzone
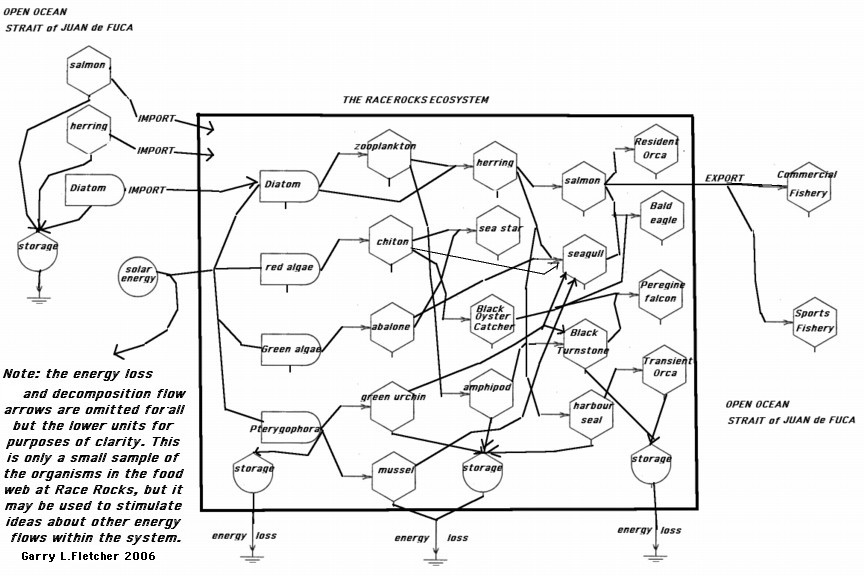
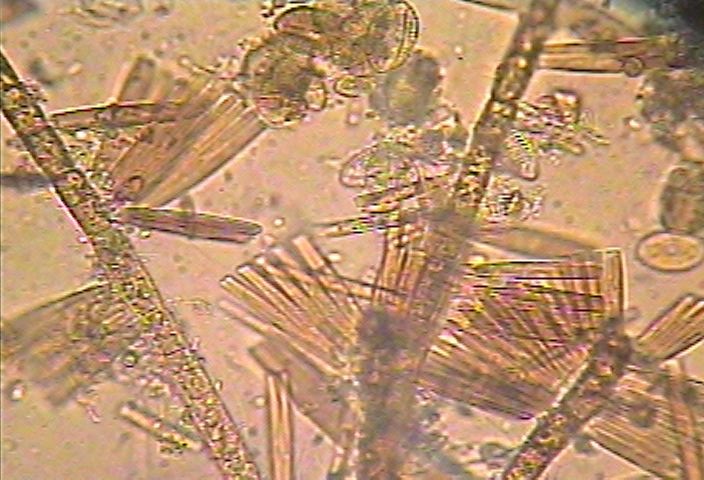
Biotope: phytoplankton, zoooplankton,(krill),
Biotope: salmon species, black rockfish, herring.
C.05.W.02Pycnocline layer subzone
Biotope: none established:
C.05.W.03Bottom Water Column layer subzone
Biotope: Planktonic
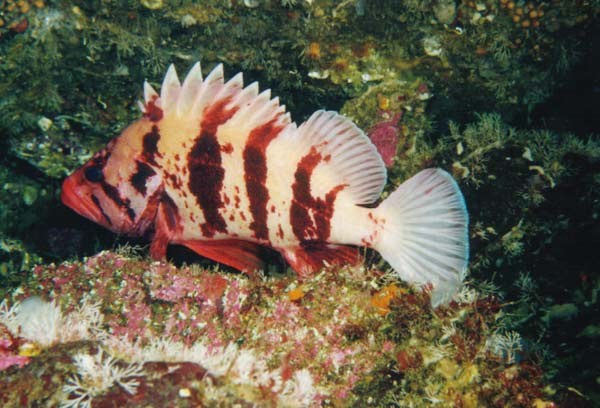
Biotope:Hexagrammos decagrammus (kelp greenling), Sebastes nigrocinctus (tiger rockfish, china rockfish), Scorpaenichthyes marmoratus (cabezon), Ophiodon elongatus (ling cod),
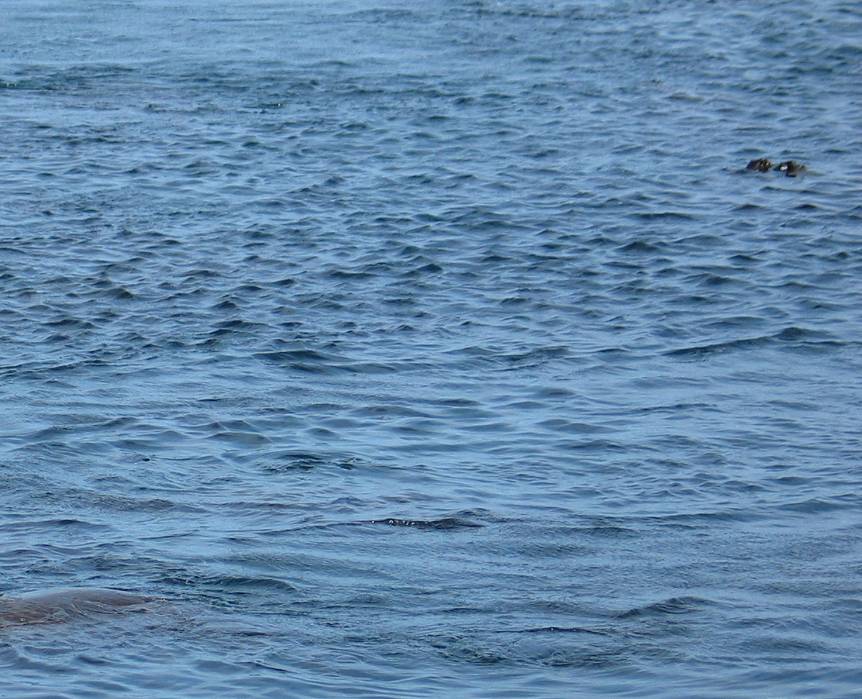
C.05.W.04 Surface and diving depth subzone
Biotope: Orcinus Orca (killer whale)
Biotope: Histrionicus histrionicus Harlquin Duck, Larus glaucescen (Glaucous-winged gull), Cepphus columba (Pigeon Guillemot), Phalacrocorax pelagicus (Pelagic Cormorant)
D
Neritic regime
E
Oceanic regime
From the NatureServe website, a brief description of the BIOTOPE:
The finest level of the classification is the Biotope. The biotope is a specific area of a habitat that
includes recurring, persistent, and predictable biological associations. The biological associations can
include plants, attached sessile fauna and unattached but relatively non-motile fauna and bacterial
colonies. A biotope is environmentally uniform in structure, environment, and is defined by the dominant
biota. The primary characteristic of the biotope is the relationship between the physical habitat and a
strongly associated or fixed “high fidelity” plant and animal species. “Fixed” is defined as an individual
organism that cannot move beyond the frame of reference of the habitat boundary within one day.

Epibenthic,( on the surface of the ocean bottom) organisms like anemones, sponges, hydroids, and benthic infauna (buried in the bottom sediments) such as polychaetes would be considered part of a biotope complex.
While much of the sedentary or fixed biota defines a particular biotope, other organisms demonstrate less
fidelity to any specific biotope. More motile or vagile organisms can be associated with multiple biotopes or
interact with the physical structure of the environment at any number of classification levels and spatial or
temporal scales. Larger animals, such as blue whales, may interact with elements defined in the
classification at a level of Formations, such as the shelf break or submarine canyon. Smaller animals
interact with Macrohabitats, Habitats or Biotopes. As the classification matures, the linkages of species and biological
associations to different classification units at different levels will become better known and documented.Detailed Description and Rationale
The biotope concept has been employed for several years in Europe and is defined as the “physical
habitat… and its community of animals and plants (Costello, 2003).
” This refers to the dominant
biological inhabitant(s) of a specific habitat, whether the species are “diagnostic,” as in the terminology of
Cowardin (1979) and Dethier (1990), or if they are “commonly associated.” A species is considered to be
part of a biotope if it is conspicuous, dominant, and physically linked to the habitat. The concept and
nomenclature for the biotope follow the BioMar system (Costello, 2003; Connor, 1997), which has been
integrated into the EUNIS classification for European habitats (Davies and Moss 1999) and into this
classification, although some of the terminology has been changed here.
Vegetation units such as specific algal and rooted plant species, salt marsh and other vegetation are
recognized at the biotope level. This biota is recognized as being associated with a particular habitat,
rather than defining the habitat. This is an important departure from several widely used classifications
such as those developed by Cowardin (1979), Ferren et al. (1996) and Madley et al. (2002) but follows
the same logic as the Dethier (1990) and the Costello (2003) classifications.
Adapted from CMECS Classification http://www.natureserve.org/getData/CMECS/cm_pub.pdfFor subcategories see also from the NatureServe site: http://www.natureserve.org/getData/CMECS/app/classification/tree/pivot/browse

Biotic Asociations at Race Rocks


The California Sea Cucumber exhibits an escape response when approached by the Sunflower Star.

Also see the video on Phyllospadix and its biotic associations

This mussel will no doubt have a competition for food with this barnacle.

Mussels have a number of associations.

  The whale barnacle living as a commensal on Gray Whales
You will find below a set of photos from our photo archives depicting two or more organisms in a biotic association. These associations fall into one of several categories: mutualism, commensalism, parasitism etc. By going through the many organisms in the Race Rocks Taxonomy, you will find explanations for these and other biotic associations.
Coraline Algae and Epiactis Boring Sponge (Cliona) and Purple- Hinged Rock Scallop (Hinnites) Cup Coral (Balanophyllia) Epiactis and Encrusting Algae (Lithothamnion)
Basket Star and soft coral
Basket Star and sea urchin
Abalone (Haliotis) and Lithothamnion
Anthopleura xanthogramica with internal green coccoid algae Brittle Star and Kelp Holdfast Brittle Star
Nudibranch and the orange hydroid Garveia Swimming Scallop and Encrusting Sponge Scallop with blue eyes

Samples of screenshots from the remote cameras.

Observation of the scenes on the cameras often yield some interesting and varied scenes. Feel free to add to this collection of the screen shots from the video cameras. e-mail : Garry Fletcher (garryf(use the @ sign)gmail.com See further directions on this .

Telephoto of the Olympic Mountains of Washington State. This was taken on a clear day- May 18, 2001 zoomed in on the remote camera. The tail end of a tugboat-drawn barge going up the Strait of Juan de Fuca, May 18, 2001 On a calm day, the area is a very popular site for observation of marine birds and mammals by the tour boats which take on passengers in Sooke or Victoria. May 18, 2001
Captive tourists look out on the life of freedom enjoyed by the elephant seals and sea lions. May 18, 2001 May 18, 2001: Inflatable boats are used by many of the marine mammal tour boats.  We get some glorious sunsets looking out from Race Rocks.This one has the Metchosin Hills in the foreground: June 11, 2001
July 1, 2001, Canada Day fireworks over the provincial capital Victoria, B.C. Mike Slater lined up this scene on camera 3. July 4, 2001, American Independence Day fireworks over Port Angeles to the south of Race Rocks. Jean Dalphond captured this collage of images when he was staying at RR doing a project in early June, 2001.
Gull chicks hatching
July, 2001
Pigeon guillemots – nest in burrows in the rocks – use remote camera to find
July, 2001
There was an abundance of baby seals – born in mid July – 2001. Mike and Carol set the camera up on this scene on camera 2 .

The Brandt’s cormorants on the west shore in
January, 2002


May 2002 : yes, sometimes Race Rocks can be “golden”. This is camera 1 on the elephant seals.

June, 2002 : We have had a successful year for gull hatching: 96 counted at one time and most of them survived.
Pam Birley from England has sent us this eagle sequence, January, 2004. She has contributed her album of pictures to our daily log files. The OCEANQUEST exercises:use screen capture to contribute to a database

Directory of OceanQuest Assignment Resources:

Collage for OceanQuestOverview: Are you prepared to take on the challenge of OceanQuest? You are expected to be an active participant in helping to build a valuable resource database for a unique sensitive environment.

The basic starting resources you will use come from www. racerocks.ca but our vision for the future is that you may actively develop a set of internet resources for your own unique ecological area.

Link to The OceanQuest GIS With Curriculum Guide
NOTE: The link to the GIS which ran on an outside server arranged by the Open School has been discontinued.. The other curruculum materials are still valid however on this site.

Topic 1 :
BIODIVERSITY

Some of the folllowing files from www. racerocks.ca were used in the building of the OCEANQUEST website.
Lesson:Intertidal Race Rocks 1. Structure and Function of Ecosystems :
How can we model ecosystems in order to understand how they work ?
Student Activities: Objectives:
Procedure :
1. Introduction
2. Horizontal distribution

  • Objectives:
    Procedure:

    • 1. Use the remote camera.
    • 2. Use the dichotomous key for identification.
    • 3. Determine the sector from aerial view of horizontal distribution.
    • 4. Field techniques to quantify distribution.
    • 5. Describe the Role of organisms in determining horizontal distribution.
    • 6. Design your own horizontal structure analysis.
    • 7. How do Anthropogenic Impacts affect Biodiversity.
      • Objectives:
        Procedure:
3. Vertical Distribution

  • Objectives:
    Procedure:

    • 1. Use the remote camera.
    • 2. Use the Dichotomous key for identification.
    • 3. Vertical Stratification of Tide Pools
    • 4. Subtidal vertical stratification with seaweed canopy.
    • 5. Vertical Stratification in the water column.
    • 6. Vertical Stratification in Soil
    • 7. Design your own vertical structure analysis.
4. Biotic Components
List of birds and mammals most frequently observed from the remote camera 5.
5. Rare and Endangered Species
6. Coastal Classification System

  • Objectives
  • Procedure:
7. Abiotic Components (Topic 2 below)
8. Ecosystem Function

  • Objectives:
  • Procedure:
9. Biogeochemical cycles

  • Objectives:
  • Procedure:
10. Extension..Other ecosystems– structure and function.


Lesson:
2. Why not Adopt an Ecosystem?
pond Use the internet as a means to get groups to collaborate to provide an educational resource while ensuring the stewardship of their own local ecological resources.
Objectives:
Procedure:
1. Identify the area
2. Establish goals and time lines
3. Establish a baseline inventory
4. Class project to provide a taxonomy
5. Use technology to document the area
6. Monitor for Structure and Function: (See topic 1.)
7. Submit site for inclusion in GIS
8. Obtain tiff-referenced aerial photography
9. Assemble a web-site to carry the information.
10. Create a list of the Ecosystem Services and Natural Capital of the area.

  • Objectives:
  • Procedure

11. Set up a weather monitoring Station


TOPIC 2: ABIOTIC FACTORS
Lessons:Link to Abiotic Factors Assignment 1. Selected Abiotic Factors (such as Barometric Pressure) :

The effects of physical factors on the life of an ecosystem is often taken for granted. Here we give you the chance to investigate some of the unique ways that organisms have evolved in order to adapt to the physical conditions of their environments.

Objectives:
Procedure:
1.Introduction
2. Wind Speed and Direction
3. Barometric Pressure
4. Lightning
5. Change through time: Salinity and Temperature.

  • Objectives:
  • Procedure:
Lessons: bell curve 2. Limiting Factors and the Ecological Niche
Objectives:
Procedure:
1. Introduction
2. GIS activity
3. and 4and 5. Contrast limiting factors in two closely related species.
6. Natural Selection
7. The Ecological Niche as determined by limiting factors
8. Adaptation: A classic study of limiting factors: The Bumpus sparrows.
9. Extension: Central Tendency and Variability.
Topic 3 : ANIMAL BEHAVIOUR
Lessons
Population
1. Population Monitoring:
An activity which allows you to contribute to a scientific database for the census of animals
Objectives:
Procedure:
1. Census of the populations, and the use of the dichotomous key.
2. Race Rocks population numbers and sector designations.
3. Weather correlation to population levels.


2. The Ethology Assignment:
Lessons:Ethology An activity that may allow you to look at the behaviours of animals in a new way
Objectives:
Procedure
1. Preliminary Observation.
2. Collecting Data.. The ethogram and the time budget.
3. Using the dichotomous key for identification.
4. Compiling the Ethogram
5. Preparing the Time Budget
6. Doing a report and submitting results to the GIS
7. Extension material

Saving Images from Live, Streaming Video:

DIRECTIONS for SAVING IMAGES and VIDEOS

Project Ideas for Viewers:We would like your help in contributing to our archive gallery of images from Race Rocks. Many times interesting behaviours occur on the screen which we can’t predict, but which could be part of a valuable contribution to our research database on Race Rocks, or you may be doing a school project where you could use a series of your own original images on animal behavior. From our cameras at Race Rocks, you can create a series of pictures, and embed them in a word processing document with your description of what was happening and the date and time.
This file shows some screenshots from the cameras at Race Rocks:

Here are some examples from our viewer in England PB:

PopulationPopulation Monitoring exercise.


EthologyAnimal behaviour Exercise:


How to Clip and Save Images :

The easiest way to save images is to go to the remote control  cameras and from the controls page you will see a button on the top named “CAPTURE” This allows you to freeze a frame, drag it to your desktop and then it is in your computer.

FOR MACINTOSH COMPUTERS: Clipping a picture from the browser is very easy with a Mac. For the whole page put on Caps lock, hold down shift/apple/and number 3. When you click on the screen it will save a screenshot to the hard drive. To clip a portion of the screen, simply hold down the shift, apple command and #4 keys, and position the cross hair of your cursor at the upper left hand corner of an image you wish to save. Drag the cursor diagonally across the area you want saved. Then release– you hear a shutter sound, the picture is stored on the hard drive where you receive downloads as Screencapture with date  etc. This image may be in a .png  format so you can open it in a photo editing program such as Graphic Converter and save it as a .jpg after trimming to the desired form. It is then ready for embedding in a web page. Behaviours are easily captured by a series of these clips, taken consecutively.

For Other Operating Systems:Please consult your help files for screen capture: Another alternative for capturing video is to download the software from a site that you may find by searching for Image capture or Screen Capture or video capture:

. We would appreciate it if you could credit “racerocks.com” from Lester B. Pearson College as the source of the picture!

To contribute your sequence to this web site e-mail files of pictures and text to us at the racerocks.ca website send an e-mail with your attached files. Indicate whether or not you want your name included as a contributor.