Elephant Seal Pup Growth – Day by day

The first Elephant Seal pup of the 2021 birthing season came on December 22 2020, and began it’s 23 days of nursing the day after (it took him awhile to figure out how to nurse). Elephant seal pups only have a couple of weeks to get big enough and healthy enough to survive alone after their moms wean them and abandon them on Race Rocks; which means their life is essentially just to feed, nap, and snuggle with their moms. It’s hard to show how impressive it is to see how fast they put on weight, with the pup doubling in size over the first few days. Here’s a video of the growth of ‘Cheermeister’ over his first 12 days of life.

https://youtu.be/ltMsnNRYTmU
   
Also see other posts on elephant seal pups born at Race Rocks, the most northerly pupping colony for e-seals on the Pacific coast:  https://www.racerocks.ca/tag/pup/

December 2020 Sea Water Data

Also available from DFO here, along with data from other sites on the West Coast.

December 2020:

Day Time Temp °C Sal ppt
1 14:00 8.7 31.7
2 14:30 8.7 31.5
3 15:00 8.6 31.6
4 * * *
5 * * *
6 * * *
7 19:30 8.7 31.7
8 20:30 8.6 31.6
9 8:30 8.6 31.5
10 9:30 8.5 31.5
11 10:30 8.6 31.6
12 11:00 8.5 31.7
13 12:00 8.6 31.8
14 13:00 8.5 31.7
15 13:45 8.7 31.6
16 15:00 8.3 32
17 16:40 8.3 32.3
18 15:45 8.4 31.9
19 16:20 8.3 31.8
20 10:00 8.5 31.9
21 10:30 8.1 31.7
22 8:00 8 31.9
23 9:30 8.1 31.8
24 10:30 7.9 31.6
25 10:00 8 31.6
26 10:30 8.2 31.3
27 10:00 8.2 31.3
28 11:00 8.1 31.3
29 12:00 8.1 31.5
30 17:00 8.1 31.7
31 16:00 8.1 31.6

Investigations on Correlations

Questions on whether or not there are correlations in nature between two or more observed events can often be an idea for interesting investigations.   Here are some examples:

Solar radiation and UV levels

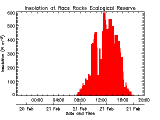
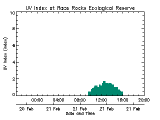
  1. In graphs aboveof a sunny day in late February both UV and Solar show a rise at the same time of day .. However check at other times of the year in the records at http://www.victoriaweather.ca/station.php?id=72 to answer the question about whether  there is always a correlation between these two abiotic factors. 
  2. Temperature and salinity: : examine this graph and see if you can make some conclusions about the correlation between seawater temperature and salinity , or between temperature and any of the other factors shown in the weather station graphs
  3. Wind speed and barometric pressure : here you might look for examples of negative correlations– in the file from the race rocks weather station http://www.victoriaweather.ca/station.php?compare wind and barometric pressure data,
  4. Link to the satellite page from the Physical factors page to the satelite page, and on it go to the Weather Model – North Pacific Surface Pressure and Wind website . Track one of the low barometric pressure circles across the Pacific and predict what effect it will have on wind in 6 or 12 hours.. This works especially well in the winter months
  5. Go to the pages of photographs done by Pam Birley taken on the Race Rocks cameras. Since they are published by the month, look for correlations in her observations . Are all species always seen at the same time of the year, ie does presence correlate with season. See if you can use her pictures to show presence/absence of migratory or resident species and correlate that with seasons.