Sea Water Temperatures at Race Rocks

From
1921 until 1997 daily records of Seawater Temperature and
Salinity were manually taken at Race Rocks by the Lightkeepers and assistants. In 1997 the station was automated and Lester Pearson College took over the hiring of the Lightkeeper Mike Slater and his wife Carol as Guardians for the Ecological Reserve / Marine Protected Area. They  maintained the daily sea temp and salinity records until their retirement in 2009. The records have been submitted monthly to the Institute of Ocean Sciences, thus continuing this important long term record.

See the Decade Comparisons:Sea Surface Temperature at Race Rocks- 1921-1930 and 1995-2005


The students from Lester Pearson College often stayed at the island and took over the daily duties such as the water sampling for temperature and salinity. The following is their introduction to the video:During our project week at Race Rocks, Mike Slater, the Race Rocks Marine Protected Area Guardian asked us if we could make a video explaining the daily duties necessary to maintain the facility. Students who are relieving on the island during Mike’s absence will be able to use this data as a guide for performing their duties, as well as providing a useful information resource for students visiting the island. These duties include two daily engine checks, a salinity check one hour before high tide, and keeping a record of the days weather, as well as explaining the functions and instructions for testing machinery located on the island.


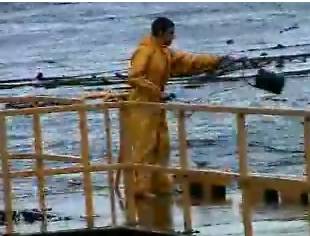
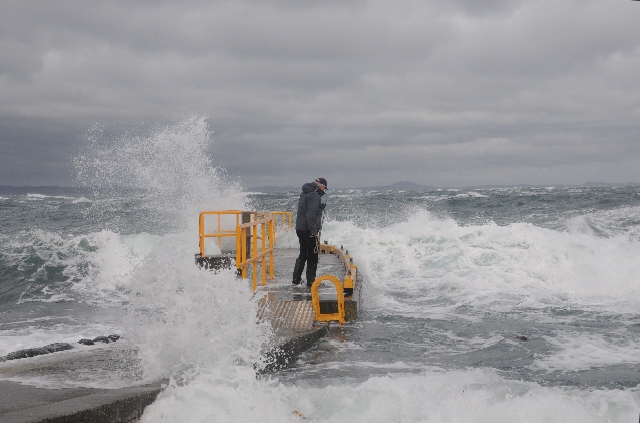
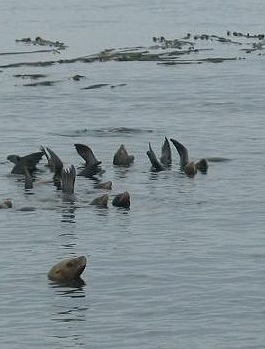
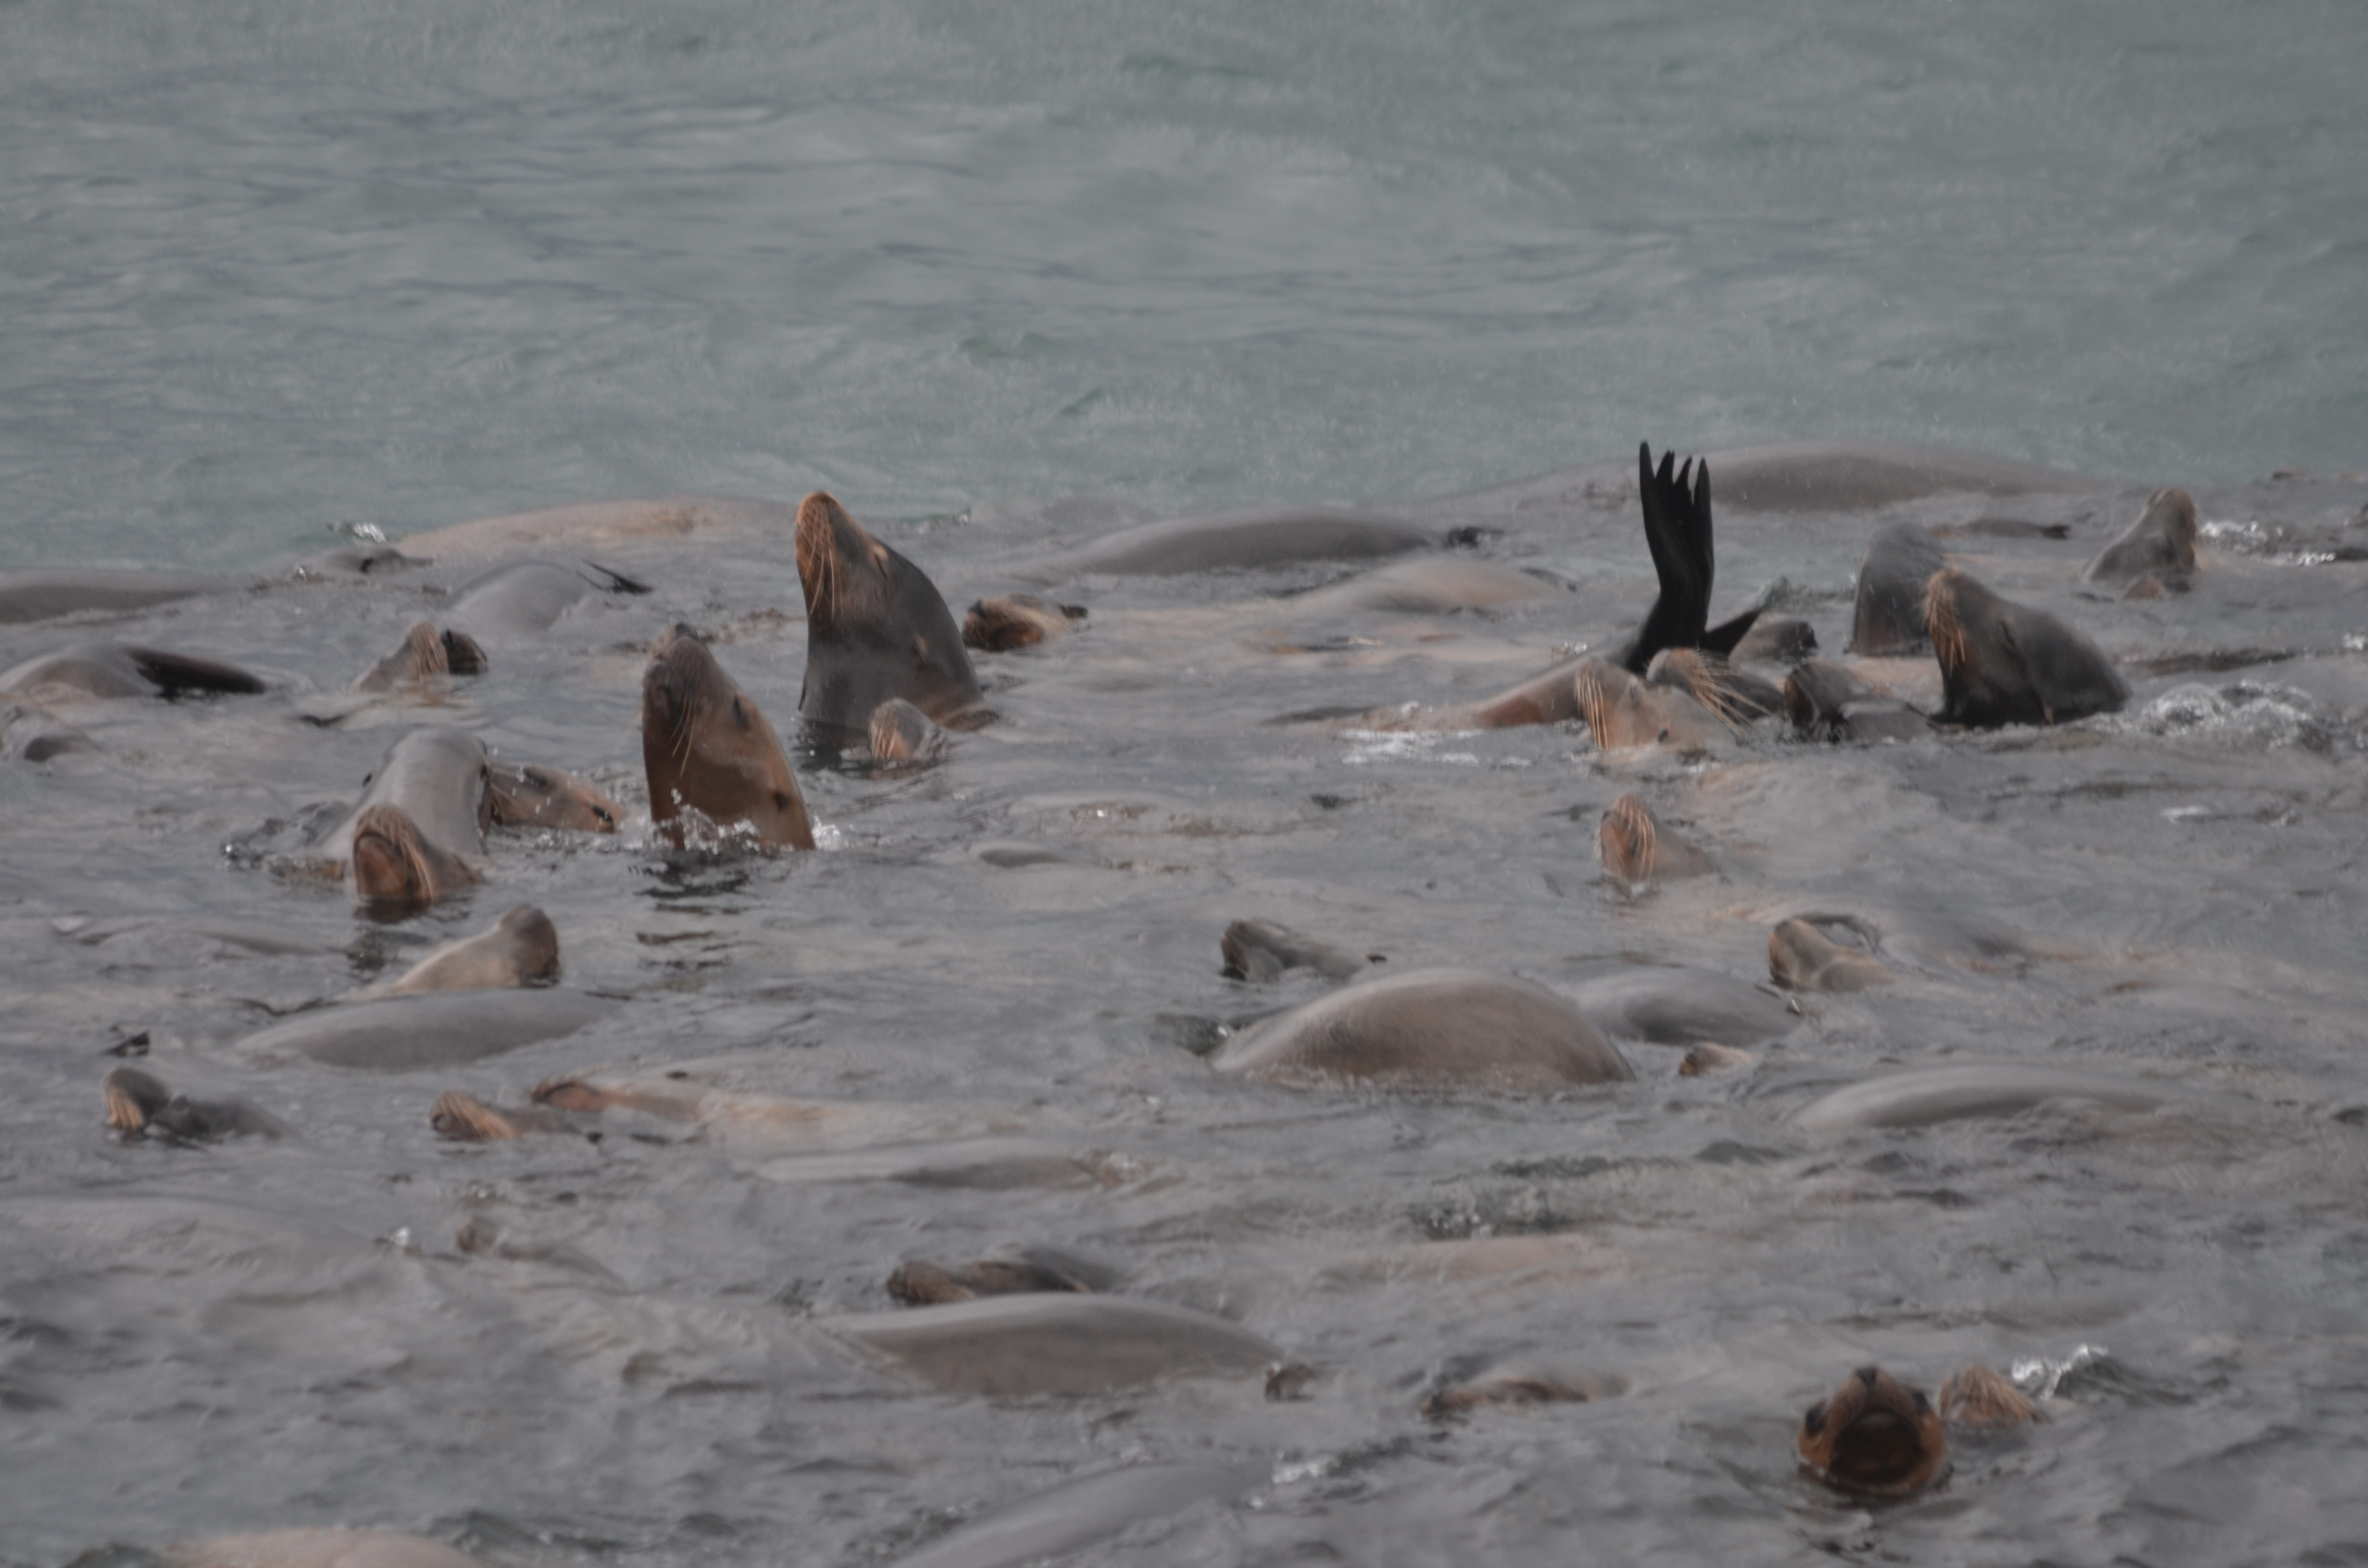
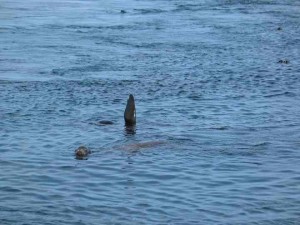
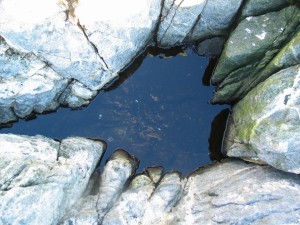
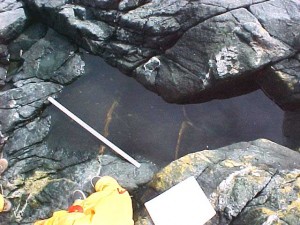
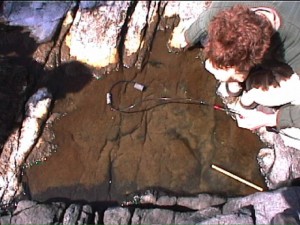
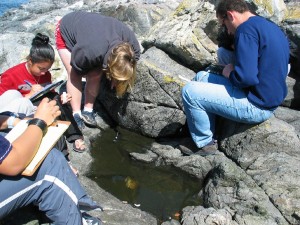
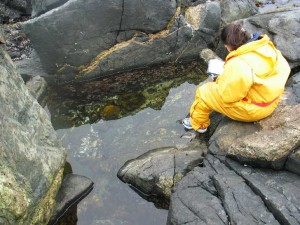
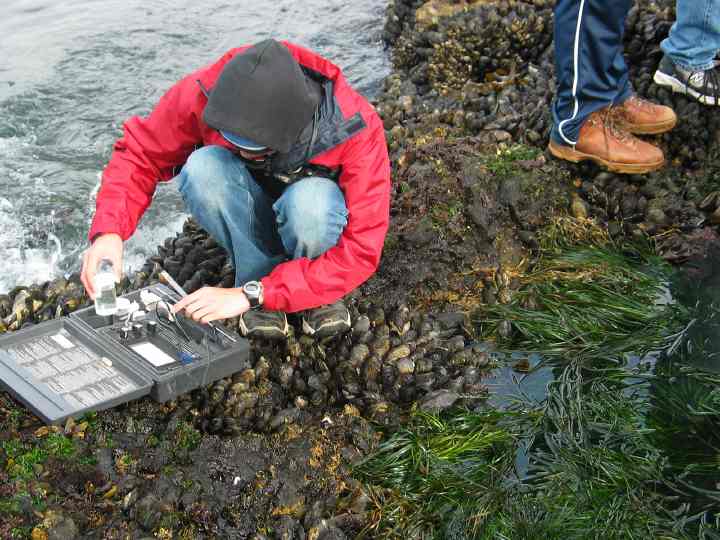
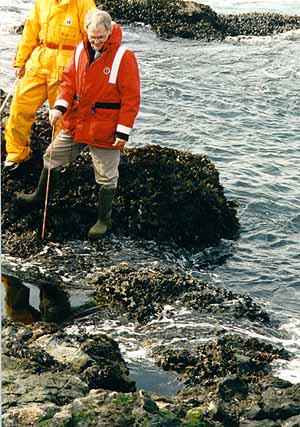
Garry gives a good demonstration of when one should avoid taking seawater temperatures!~ (Photo by Barry Herring Feb 2009)


SEA TEMPERATURE 1921 to 2008

Also
see historic sets of raw data from IOS for the British
Columbia Light Stations

http://www.pac.dfo-mpo.gc.ca/science/oceans/data-donnees/lighthouses-phares/data/racerockday.txt

Observations of Seawater Temperature and Salinity at British Columbia Shore Stations, 1983. F. Glovando 1985

Refer
to the File “Temperature Changes Through Time for an
Educational exercise on Sea water Temperature changes.


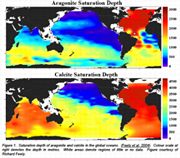
OCEAN
WARMING:
The
long-term Sea temperature record at Race Rocks has
been pointed out as one of the pieces of evidence that has
accumulated on global warming. Terry Glavin, in reviewing
the book The Weather Makers by Tim
Flannery
( Harper Collins Publishers, 2006) says
:

The Pacific Ocean itself is getting warmer.
Measurements at the Race Rocks lighthouse near
Victoria show an average rise in temperature of 1°C
since 1921, which doesn’t sound like much until you
remember that its only 10°C in the other direction
that separates us from the deep freeze of the Ice Age.
The ocean, absorbing increasing volumes of carbon
dioxide, is becoming more acidic too, inhibiting the
production of plankton, the basis of all life in the
sea.”
The
rest of the article may be seen at
http://www.straight.com/content.cfm?id=17132
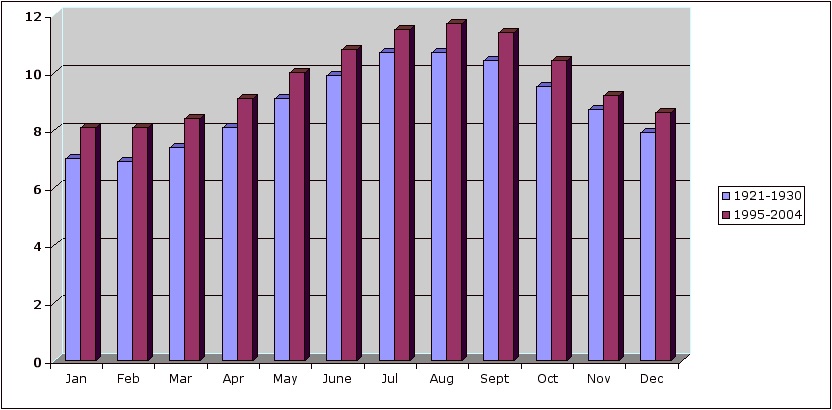
See this file for our own analysis which supports this statement:

page 21
State
of the Pacific Ocean 2005
context.http://www.pac.dfo-mpo.gc.ca/sci/psarc/OSRs/StateofOceans2005fnl.pdf
Two
references are made to Race Rocks Sea Temperature
data. page 6 and page 31
State
of the Pacific Ocean , 2006
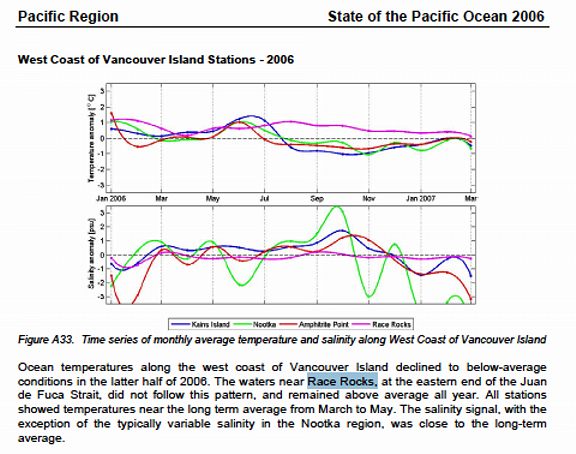
state of the pacific ocean 2006,
page 36 ” Ocean
Temperatures along the west coast of Vancouver island
declined to below average conditions in the latter half
of 2006. The waters of race Rocks …did not follow this
pattern, and remained above average all year.”
RESPONSE
OF ORGANISMS TO SEAWATER TEMPERATURES:
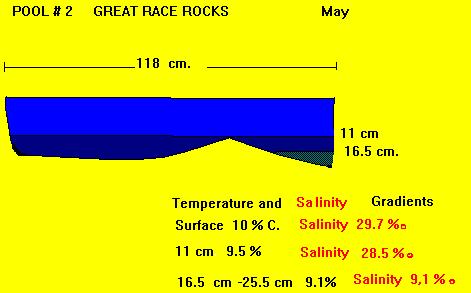
The
seawater in the Strait of Juan de Fuca has a very narrow
variation in temperature range. It is important to
understand about Heat Capacity, as it is partly due to
this ability of water to warm up slowly and cool off
slowly that the climate of Vancouver Island and the lower
mainland of British Columbia has the mildest weather in
Canada.
Heat
capacity is the ratio of the heat energy absorbed to the
rise in temperature. Objects with high heat capacity, such
as water, require a great amount of heat energy to change
temperature. Materials with low heat capacities, such as
air, easily change temperature with small amounts of heat
energy.

These
photos are from the California sea lion page. They demonstrate one of the forms of heat exchange used by the sea lions atRace Rocks. Their flippers are filled with blood vessels, so this behaviour allows heat exchange with the atmosphere.

Heat
Capacity is also sensitive to the size of the object
(for example, a bathtub of water has more heat capacity
than a cup of water). Therefore we can expect the
greatest variation in temperatures to occur at Race
Rocks in the tidepools.

This file shows one example of measurements taken on
tidepools. It illustrates this idea of size of the object and it also helps explain why our tidepools
have different biodiversity depending on the temperature variations of the pools.

Other ideas to be developed here:
1.Temperature stratification in tidepools and
distribution of organisms.

2.
Temperature stratification in the ocean. The importance
of the thermocline in determining marine-life zones.

3.
The relationship of temperature of water to its ability
to absorb the gases oxygen and carbon dioxide. (An
inverse relationship which has significant implications
for where organisms can live.)

4.
Birds and mammals have adaptation for cold temperatures,
e.g. Insulation, activity levels and counter-current
arterial circulation


Dr.
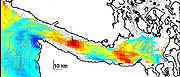
Kate Edwards of the University of Washington School of
Oceanography is doing research on the sea temperatures
of the Strait of Juan de Fuca. (click on image to left).
She maintains web pages at:
Strait of Juan de Fuca page:
http://www.ocean.washington.edu/~kate
West Coast headlands page:
http://www-ccs.ucsd.edu/~kate
Jan Newton is at the Washington state Department of Ecology and is interested in how the Straits affect Puget Sound.
She has organized the “Joint Effort to Monitor the
Straits,” which regularly sample the three stations south
of San Juan Island in the map at http://www.ecy.wa.gov/apps/eap/marinewq/mwdataset.asp
.

Click on the Station Group Puget Sound, and the Selected
Station – Juan de Fuca.

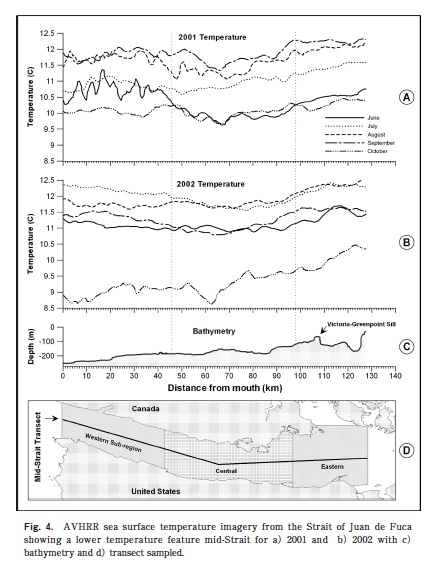
This
paper references Strait of Juan de Fuca Temperatures


Educational Exercises Using Data From Race Rocks – Excel and
Statistics

Tidepool Index:

These pools are located 0n the West side of Great Race Rocks. They are located at slightly different elevations resulting in different abiotic factors in the pools and different life forms in the pools as well. Our students brave the elements to get some measurements in this video

Pool 9.. file not completed

Tidepool 11: No File for this pool

ph as an abiotic factor

The effects of pH on the distribution of organisms at Race Rocks. Useful Links:

1. State of physical, biological, and selected fishery resources of Pacific Canadian marine ecosystems
From Canadian Science Advisory Secretariat Research Document – 2008/013
(Page 37 of pdf file) Ocean acidification off the West Coast by Debby Ianson, Fisheries and Oceans Canada

“Global oceans are becoming more acidic due to increasing carbon dioxide (Orr et al. 2005). Much of the extra CO2 released by burning fossil fuels ends up in the oceans, increasing the dissolved inorganic carbon concentration (DIC). As DIC increases, the relative proportions of carbon species shift (specifically from the carbonate ion to the bicarbonate ion), resulting in an increase in acidity and a decrease in pH (Strum and Morgan, 1981). At present the pH of seawater has decreased by about 0.1 due to oceanic uptake of anthropogenic carbon and is projected to decrease by 0.4 by the year 2050 (Orr et al. 2005). The decrease in pH (and concurrent decrease in carbonate ion) means that organisms that produce calcite and aragonite shells or structures, such as pteropods, corals and shellfish, are threatened (The Royal Society, 2005).”
“Very few data from the carbonate system have been collected on the Canadian west coast; however these few observations show that Juan de Fuca Strait and the Vancouver Island Coastal Current experience high pCO2 water due to tidal mixing in the Strait, which brings water high in DIC and low in pH to the surface (Ianson et al. 2003). An additional study with high spatial resolution confirms the high surface pCO2 (400 — 800 ppm; Nemcek et al, in press) in this area estimated by Ianson et al. (2003) but has no complimentary measurements (such as DIC) with which to determine pH in the Strait.”

2. THE EFFECT OF HYDROGEN ION CONCENTRATION UPON THE INDUCTION OF POLARITY IN FUCUS EGGS
INCREASED HYDROGEN ION CONCENTRATION AND THE INTENSITY OF MUTUAL INDUCTIONS BY NEIGHBORING EGGS OF FUCUS FURCATUS
D. M. Whitaker

http://www.jgp.org/cgi/content/abstract/20/3/491

3. THE EFFECT OF ALKALINITY UPON MUTUAL INFLUENCES DETERMINING THE DEVELOPMENTAL AXIS IN FUCUS EGGS
D. M. WHITAKER 1 and E. W. LOWRANCE 1

1. When two eggs of Fucus furcatus develop in the dark within 0.3-4 egg diameters of each other, the point of rhizoid origin and the developmental axis are influenced by the presence of the neighbor.
2. When the pH of the medium is below approximately 7.6, the rhizoids tend to form on the sides of the eggs toward the neighbor. When it is above 7.6, they tend to form on the sides away from the neighbor, most markedly at pH 8.4.
3. The effect is stronger the closer the eggs, within the limits 0.3-4 egg diameters.

http://www.biolbull.org/cgi/content/abstract/78/3/407

4. Discovering the Effects of CO2Levels on Marine Life and Global Climate

In recent months, the media have begun to focus on another effect of rising atmospheric CO2 concentrations: the effect of increasing CO2 levels on marine life. The oceans absorb 22 million tons of carbon dioxide every day, writes Richard Feely, a scientist with the National Oceanic and Atmospheric Administration (NOAA) in a 2006 science brief, “Carbon Dioxide and Our Ocean Legacy” (100 KB PDF). Although this absorption is said to significantly reduce atmospheric greenhouse-gas levels, some scientists have observed that such an excess of CO2 may be altering the chemistry and biology of the world’s oceans.By Kate Bradshaw
http://soundwaves.usgs.gov/2007/01/

5. Dropping pH in the Oceans Causing a Rising Tide of Alarm
Tundi Agardy, Ph.D
.

http://www.thew2o.net/archive_new.html?id=28

6. Researchers report on possible biological effects
of deep-sea CO2 sequestration

.http://www.mbari.org/news/news_releases/2001/oct12_seibel.html

7. Bush’s CO2 Dumping Plan Could Devastate Sea Life

http://www.scienceagogo.com/news/20031019174538data_trunc_sys.shtml

8. SEAKEEPERS PROVIDING KEY DATA ON OCEAN ACIDIFICATION AFFECT ON GLOBAL WARMING

http://www.seakeepers.org/featured-ocean-acidification.php

9. Also a general index at:

https://search.usa.gov/search?affiliate=usgswebarchive&query=ph

See also our file on Ocean Acidification in 4.2 The Importance of pH.

Adopt an Ecosystem


BACKGROUND: “Adopt an Ecosystem” involves using the internet as a means to get individuals and groups in other communities: provincial, state, national and international, involved in collaborating with others, and providing an educational resource while ensuring the stewardship of their own local ecological resources.

OUTLINE WITH POWER POINT PRESENTATION:
This 10 step outline presents the basic model of how to go about setting up an Adopt an Ecosystem Project in your school or organization.


THE PROCESS:
We are urging individuals, school groups and service groups in communities to establish internet files on a local natural area which they are able to document easily at a number of levels of scientific sophistication. This natural area may be a small corner of a school yard, a piece of coastline, a local stream or pond, or it could be an established ecological reserve or park. Valuable long-term baselines can be established with students of each year or individuals leaving a “digital legacy’ or a permanent on-line record which is available for other classes to make additions and updates in the future.
THE IMPORTANCE OF THE “PROCESS”

By involving individuals in the documentation and monitoring of their adopted ecosystem, a sense of “ownership” of one’s ecosystems and responsibility for their stewardship is experienced. In addition participants are encouraged to use technology to assist in the accumulation of valuable long-term ecological information which can serve as baselines for environmental impact decisions in the area, and as a valuable baseline on the area’s biodiversity.

OBJECTIVES: (The teacher and class may decide on setting their goals for this project, using only a limited number of the suggested activities.) After doing this assignment, students will be able to:

a) Design a plan and procedure for the creation of a local : “Adopted Ecosystem”

b) Use field methods involving quantification to document the chosen ecosystem with a baseline inventory.

c) Use a Spreadsheet program for the analysis and recording of locally collected data.

d) Set up a weather station for collection of weather data.

e) Construct a species list and/or taxonomy of the local organisms in the “Adopted Ecosystem”.

f. iNaturalist contributions Recently I opened an account on iNaturalist.com . I have been able to add many pictures of species taken around the Metchosin coast, as well as other locations. https://www.inaturalist.org/observations/garryf

It is a great idea to contribute to iNaturalist so by opening a free account on iNaturalist.com it  is a good way to do establish a baseline for organisms in your ecosystem and get professional assistance from experts for identification of species.  for instance for the biodiversity project the following entries are recorded by various individuals, https://www.inaturalist.org/projects/metchosin-biodiversity

f) Setup a website dedicated to the collection of resources relating to your locally adopted ecosystem.

g) Outline the Ecosystem Services and the value of the Natural Capital of your adopted Ecosystem.

PROCEDURE:. Identify the area and describe the ecological features that make the area unique, important or just representative of other surrounding ecosystems. Also indicate what your group intends to do with it.

2. You may indicate time lines for your goals, and even designate responsibilities to different group members in order to help you plan your strategy.

3. Establish a good “baseline inventory ” of what is there presently. Many ecological techniques are available to quantify organisms and their distribution. You may use our Transect Files as an example.

4. Establish a class project to provide a taxonomy of the species of your local ecosystem.

5. Include dated maps, databases, taxonomic inventories, checklists, photographs, videos or drawings to document your site. Open a project on iNaturalist.com  that enables you to enter photos of species and have experts help in making identifications

6. Begin monitoring the site for aspects of its structure and function. For structure: what living things are there, how they are distributed, what relationships or biotic associations exist. Also, the structure includes physical factors such as temperature, salinity, etc. –start gathering long term data, enter it into a database (such as excel), and save it to the internet site so that others can download and manipulate the data.

7.Download Google Earth and make a 3 dimensional image of the area with your ecosystem.

8. Search for historical and other recent maps or charts of your area. Include these as part of the information recorded.

9. If you have access to your own internet site, assemble the information on the site, let us know its location and we will provide a link to your site from racerocks.ca.

10. Establish a Project to list and value the Ecosystem Services and Natural Capital of your ecosystem. In recent years, we have started to acknowledge that “ecosystem services ” are something to which we must start paying attention as to fail to do so leads to a decline in quality of life:
This file explores that idea further and invites you to contribute to a new project : Defining the Ecosystem Services of Race Rocks. By looking at the model of such services developed for Race Rocks, you might also get an idea how you could choose a part of your own local ecosystem and do a similar analysis.

11. In the fall of 2005 we installed a Davis Weather Instrument at Race Rocks for real time monitoring of a number of meteorological events.

From this environmental data index page, you can see how we are developing pages for each environmental abiotic factor and interpreting how that factor is important in the ecosystems of Race Rocks. Many schools already have weather stations installed. Here are some examples from the Victoria area:

Send inquiries to: Garry Fletcher

Turbine Site Hydroid Survey- 2006

Chris Blondeau and Juan Carlos Yabar, did this survey to document the Invertebrates, particularly hydroids,sponges and colonial tunicates in the are where the turbine Piling was to be installed later in the year.

See other archived video with Pearson College Divers

Ecological Monitoring for the Tidal Energy Generator

Pam and Jason from Archipelago Marine do their underwater survey of the location of the Piling Drilling for the Current Energy Project. They monitor area at ~18 meters depth. October 26, 2005Frequent visits from sealions frequently distract Juan Carlos as he takes the video.

See other archived video with Pearson College Divers

Statistics Assignments from Race Rocks Data

S


1.Seawater Temperature and Salinity in the Strait of Juan de Fuca

2. Air /precipitation Physical Data

3.Solar/UV Correlations file

4.Solar historical files

5. Doing statistics on Wind at Race Rocks

6. Doing statistics on Wind and Barometric Pressure correlations.

7. Statistics Lab on Mollusc measurements

8. Abalone measurements

9. The Christmas Bird Count

10. Black OysterCatcher predation

11. Wind and Barometric Pressure correlations

Purpose:
To transfer data from an EXCEL spreadsheet, (or equivalent program in other software) presented on the racerocks.com website to your own computer in order to be able to graph trends and analyze relationships.
Procedure :1. Open a blank workbook in EXCEL on your computer. Next open one of the files saved from EXCEL below and then with your cursor highlight the columns that you want to transfer to your open EXCEL workbook, and press COPY. ( If your computer is low on memory, you may have to close the web page before opening the EXCEL application.)

2. Copy and Paste the data from the web page directly into your blank EXCEL workbook.

3. You now have our original data on your machine and you can proceed to do any one of the many manipulations possible in the EXCEL program. You can also copy and paste in other month’s data in order to get a larger data set .

4. If you come up with a way of analyzing the data which is particularly creative, we would be interested in attaching it on racerocks.com. Just e-mail it as an attachment . e-mail: Garry Fletcher

5. You are welcome to use this data for educational purposes, you are just asked to reference the source as:
Lester B. Pearson College, racerocks.com

Tidepool # 6 “Anita’s Pool”

On the West side of Great Race Rocks is a tidepool that we have been observing for many years. Dr. Anita Brinckmann-Voss has done research on the seasonality of hydroids in this pool and it is published as:

 Brinckmann-Voss, A. 1996. Seasonality of Hydroids (Hydrozoa, Cnidaria) from an intertidal pool and adjacent subtidal habitats at Race Rocks, off Vancouver Island,Canada,
Scientia Marina Advances in Hydrozoan
Biology , Vol 60 (1):89-97

anitapool

Dr. Anita Brinckmann-Voss doing research on seasonality of Hydroids in Tidepool #6

Abstract:

An assemblage of 27 hydroid species was reported from a tide pool in the lower rocky intertidal zone, and compared with 42 hydroids of the adjacent subtidal region. Location of hydroids within the pool, seasonal occurence, growth and sexual maturity were tabulated, and some systematic aspects discussed. Possible causes of hydroid species diversity were considered, including location of the tide pool in an area of tidal rapids, and shading by surfgrass and rock cliffs during low tide

tpgf


The unique feature about this pool is that it is deep enough – ( 1 meter) and it gets swells that refresh it even when the tide level is low. Garry is standing on the lip of the pool as the water from a swell spills out and cascades down to the lower level of the ocean.


Tidepool 6 at low tide

Tidepool 6 at low tide

Tidepool 6 at high tide

Tidepool 6 at high tide

TIDEPOOL6See this video on Tdepool 6 at High Tide:

see this link for other hydroids:  https://www.racerocks.ca/tag/hydroid/

Species List for the West Side of the Race Rocks Jetty , 2005

This list was compiled by Pam Thuringer of Archipelago Marine on May12, 2005. She examined the west side of the docks exposed at a 0.35m tide as part of the Environmental Impact assessment for the Tidal Current Project.

Invertebrates Balanus glandula many
Semibalanus cariosus many
Hemigrapsus nudis few
Mytilus californianus few
Sponge ( orange encrusting species) few
Katharina tunicata few
Littorina scutulata many
Tectura persona few
Lottia pelta few
Anthopleura elegantissima few
Lirubuccinum dirum few
General Group Species Occurence
Brn. Algae Nereocystis luetkeana sparse
Fucus sp. sparse
Leathesia difformis sparse
Hedophyllum sessile abundant
Alaria marginata abundant
Costaria costata few
Red Algae Mazzaella splendans few
Mastocarpus pappilatus sparse
Halosaccion glandiforme few
Lithothamnion sp. few
Odonthalia floccosa sparse
Polysiphonia sp. sparse
Coralline algae. several species sparse
Porphyra perforata sparse
Endocladia muricata sparse
Green Algae Ulva sp. sparse
Acrosiphonia sp. few

BC Parks Preliminary EIA for Dock Species.

This list was compiled by Pam Thuringer of Archipelago Marine on May12, 2005. She examined the west side of the docks exposed at a 0.35m tide. This is the area that will be impacted by the construction of the conduit to carry electrical cables from the Tidal Current generator up to the island,

General Group Species Occurence
Brn. Algae Nereocystis luetkeana sparse
Fucus sp. sparse
Leathesia difformis sparse
Hedophyllum sessile abundant
Alaria marginata abundant
Costaria costata few
Red Algae Mazzaella splendans few
Mastocarpus pappilatus sparse
Halosaccion glandiforme few
Lithothamnion sp. few
Odonthalia floccosa sparse
Polysiphonia sp. sparse
Coralline algae. several species sparse
Porphyra perforata sparse
Endocladia muricata sparse
Green Algae Ulva sp. sparse
Acrosiphonia sp. few
Invertebrates Balanus glandula many
Semibalanus cariosus many
Hemigrapsus nudis few
Mytilus californianus few
Sponge ( orange encrusting species) few
Katharina tunicata few
Littorina scutulata many
Tectura persona few
Lottia pelta few
Anthopleura elegantissima few
Lirubuccinum dirum few