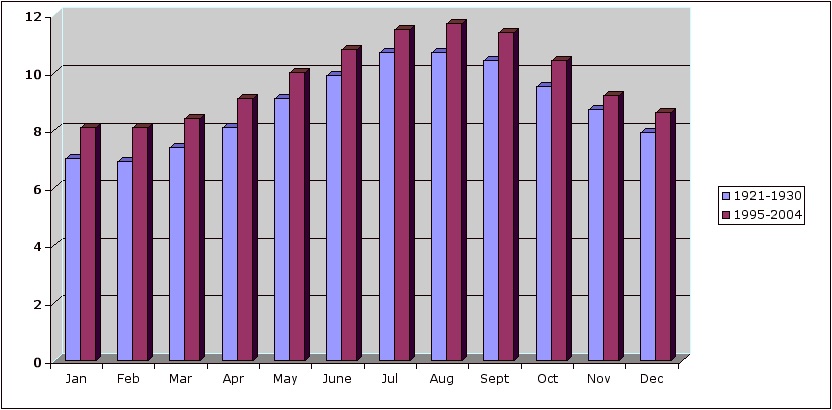
Seawater Temperature: Race Rocks
Decade Comparisons:Sea Surface Temperature at Race Rocks-
| Year |
Jan |
Feb |
Mar |
Apr |
May |
Jun |
Jul |
Aug |
Sep |
Oct |
Nov |
Dec |
|
|
|
|
|
|
|
|
|
|
|
|
|
|
|
| 1921 |
|
7.1 |
7.3 |
7.7 |
8.5 |
9.5 |
10.3 |
10.5 |
10.3 |
9.8 |
9.1 |
8.2 |
|
| 1922 |
6.4 |
6.1 |
6.6 |
7.5 |
8.3 |
9.5 |
10.5 |
10.3 |
10.2 |
9.3 |
8.4 |
7.1 |
|
| 1923 |
7.1 |
6.4 |
6.7 |
7.6 |
8.6 |
9.3 |
10.3 |
10.5 |
10.6 |
9.6 |
8.7 |
7.9 |
|
| 1924 |
7.1 |
7.3 |
7.7 |
7.9 |
9 |
9.8 |
10.5 |
10.3 |
10.2 |
9.2 |
8.8 |
7.3 |
|
| 1925 |
6.6 |
6.9 |
7.3 |
8 |
9.2 |
10.1 |
11.1 |
10.8 |
10.2 |
9.2 |
8.3 |
8.2 |
|
| 1926 |
7.8 |
8 |
8.6 |
9.2 |
10.1 |
10.7 |
11.1 |
10.9 |
10.5 |
9.8 |
9.1 |
8.5 |
|
| 1927 |
7.6 |
7.4 |
7.8 |
8 |
8.8 |
9.8 |
10.5 |
10.9 |
10.3 |
9.7 |
8.6 |
7.6 |
|
| 1928 |
6.9 |
7.3 |
7.8 |
8.6 |
9.7 |
10.2 |
10.8 |
10.9 |
10.3 |
9.2 |
8.6 |
7.9 |
|
| 1929 |
7.1 |
6.3 |
7.1 |
7.8 |
9 |
9.8 |
10.8 |
10.8 |
10.7 |
9.8 |
8.8 |
7.8 |
|
| 1930 |
6.5 |
6.6 |
7.1 |
8.2 |
9.3 |
10 |
10.6 |
10.8 |
10.6 |
9.4 |
8.6 |
8 |
|
| 1931 |
7.8 |
7.8 |
8.2 |
8.8 |
9.9 |
10.6 |
11.5 |
11.1 |
10.7 |
9.6 |
8.6 |
7.7 |
|
| 1932 |
7.1 |
6.8 |
7.3 |
8.2 |
9.3 |
10.4 |
10.8 |
10.9 |
10.7 |
9.6 |
8.9 |
7.7 |
|
| 1933 |
7.1 |
6.7 |
7.1 |
8 |
9.1 |
10.2 |
10.5 |
11.5 |
10.1 |
9.6 |
8.6 |
7.7 |
|
| 1934 |
7.8 |
7.9 |
8.3 |
9.2 |
10 |
10.8 |
10.9 |
11.6 |
10.7 |
9.7 |
9.2 |
8.4 |
|
| 1935 |
7.2 |
7.2 |
7.5 |
7.8 |
9.2 |
10.1 |
10.5 |
10.5 |
10.7 |
9.7 |
8.2 |
8.1 |
|
| 1936 |
7.9 |
6.7 |
7 |
7.8 |
9.3 |
10.4 |
11.3 |
11.3 |
10.5 |
10.1 |
8.6 |
7.9 |
|
| 1937 |
6.6 |
6.4 |
7.7 |
8.7 |
9.9 |
10.9 |
11.7 |
11.5 |
10.9 |
9.9 |
8.5 |
8.1 |
|
| 1938 |
7.4 |
7.2 |
8.1 |
9.4 |
10.6 |
12.3 |
12.7 |
11.9 |
11 |
9.9 |
8.6 |
7.5 |
|
| 1939 |
7.4 |
6.6 |
7.1 |
8.6 |
10.3 |
11.4 |
12.2 |
11.1 |
11.4 |
9.7 |
|
8.5 |
|
| 1940 |
7.9 |
8.2 |
9 |
10 |
11.4 |
11.6 |
|
|
|
|
|
|
|
| 1941 |
|
|
|
|
10 |
10.5 |
11.2 |
11 |
10.6 |
9.9 |
9 |
8.5 |
|
| 1942 |
7.9 |
7.9 |
7.8 |
8.5 |
9.6 |
9.8 |
10.5 |
11 |
10.3 |
9.5 |
8.4 |
7.9 |
|
| 1943 |
6.8 |
6.7 |
7.1 |
8.2 |
8.8 |
10 |
10.3 |
10.6 |
10.3 |
9.6 |
9 |
8.1 |
|
| 1944 |
7.7 |
7.5 |
7.3 |
8 |
9.2 |
10.5 |
11 |
10.9 |
10.5 |
9.6 |
9.2 |
8.1 |
|
| 1945 |
7.8 |
7.7 |
7.6 |
8 |
8.8 |
9.8 |
10.1 |
10.5 |
10 |
9.5 |
8.1 |
8.1 |
|
| 1946 |
7.7 |
7.3 |
7.7 |
8.1 |
9.4 |
10.2 |
10.7 |
10.8 |
10.3 |
9.4 |
8.1 |
7.7 |
|
| 1947 |
7.1 |
7 |
7.7 |
8.4 |
9.5 |
10.4 |
10.6 |
10.9 |
10.5 |
9.9 |
9.1 |
7.9 |
|
| 1948 |
7.5 |
6.9 |
7.2 |
7.9 |
9 |
10.2 |
10.8 |
10.7 |
10.4 |
9.5 |
8.2 |
7 |
|
| 1949 |
6.1 |
6.1 |
6.9 |
8.3 |
9.4 |
10.1 |
10.3 |
10.2 |
10.5 |
9.5 |
8.7 |
7.8 |
|
| 1950 |
6.2 |
5.8 |
6.6 |
7.7 |
8.7 |
9.4 |
10.1 |
10.4 |
10.3 |
9.3 |
8.5 |
8 |
|
| 1951 |
7.5 |
6.9 |
6.7 |
8.1 |
9.2 |
10.2 |
10.4 |
11.1 |
10.9 |
9.5 |
8.5 |
7.7 |
|
| 1952 |
6.9 |
7.1 |
7.6 |
8.2 |
9 |
9.6 |
10.4 |
10.5 |
10.2 |
9.8 |
8.6 |
7.9 |
|
| 1953 |
7.8 |
7.9 |
7.6 |
8.1 |
9.3 |
9.8 |
10.6 |
11 |
10.6 |
9.9 |
9.3 |
8.5 |
|
| 1954 |
7.1 |
7.3 |
7.5 |
7.9 |
8.7 |
9.3 |
9.9 |
10 |
10 |
9.4 |
9.1 |
8.4 |
|
| 1955 |
7.5 |
7.1 |
6.7 |
7.5 |
8.4 |
9.3 |
9.8 |
10.2 |
10 |
8.9 |
7.5 |
6.6 |
|
| 1956 |
6.7 |
6.4 |
6.3 |
7.6 |
8.7 |
9.6 |
10.2 |
10.4 |
10.1 |
9.2 |
8.1 |
7.1 |
|
| 1957 |
6.3 |
6.2 |
7.2 |
8.1 |
9.3 |
10 |
10.3 |
10.5 |
10.5 |
9.8 |
8.8 |
8.3 |
|
| 1958 |
8 |
8.3 |
8.6 |
9.3 |
10.3 |
10.7 |
11.5 |
11.5 |
11 |
9.9 |
8.7 |
8.1 |
|
| 1959 |
7.6 |
7.4 |
7.9 |
9.1 |
9.7 |
10.4 |
11.3 |
11 |
10.4 |
9.7 |
8.3 |
7.8 |
|
| 1960 |
7.1 |
7.5 |
7.5 |
8.6 |
9.6 |
10.3 |
11.4 |
10.8 |
10.1 |
9.5 |
8.6 |
7.9 |
|
| 1961 |
7.9 |
8.2 |
8.4 |
8.8 |
9.4 |
10.3 |
10.9 |
11.3 |
10.6 |
9.4 |
8.2 |
7.5 |
|
| 1962 |
7.2 |
7.3 |
7.3 |
8.4 |
9.3 |
10 |
10.4 |
10.5 |
10.5 |
10 |
9.3 |
8.7 |
|
| 1963 |
7.5 |
7.5 |
7.8 |
8.5 |
9.6 |
10.2 |
10.5 |
10.8 |
10.6 |
10.3 |
9.9 |
8.7 |
|
| 1964 |
8.2 |
7.9 |
7.7 |
8.2 |
8.8 |
9.6 |
10.3 |
10.5 |
10 |
9.4 |
8.3 |
7.4 |
|
| 1965 |
6.9 |
7.1 |
7.2 |
8 |
8.8 |
9.8 |
10 |
10.2 |
10.3 |
9.7 |
9.2 |
8.5 |
|
| 1966 |
7.7 |
7.6 |
7.7 |
8.5 |
9 |
9.1 |
99.9 |
10.7 |
10.1 |
9.5 |
8.7 |
8.6 |
|
| 1967 |
7.9 |
7.7 |
7.6 |
8.1 |
8.9 |
9.6 |
10.3 |
10.5 |
10.5 |
9.7 |
9.1 |
8 |
|
| 1968 |
7.3 |
7.3 |
8 |
8.3 |
8.7 |
9.5 |
10.2 |
10.2 |
10.4 |
9.3 |
8.8 |
7.8 |
|
| 1969 |
6.5 |
6.3 |
7.2 |
8.1 |
9.1 |
10.2 |
10.4 |
10.5 |
9.8 |
9.2 |
8.7 |
8.1 |
|
| 1970 |
7.5 |
7.7 |
7.9 |
8 |
8.7 |
9.6 |
10.2 |
10.2 |
10 |
9 |
8.3 |
7.5 |
|
| 1971 |
7 |
6.9 |
6.7 |
7.5 |
8.5 |
9.1 |
10 |
10.6 |
10.4 |
9.3 |
8.3 |
7.3 |
|
| 1972 |
6.4 |
6.2 |
6.9 |
7.6 |
8.8 |
9.5 |
10.5 |
10.6 |
10.2 |
9.1 |
8.4 |
7.3 |
|
| 1973 |
7 |
7.2 |
7.9 |
8.4 |
8.6 |
9.2 |
10.1 |
10.3 |
10 |
9.2 |
8.2 |
8 |
|
| 1974 |
7.2 |
7.2 |
7.3 |
8.1 |
8.5 |
9.7 |
10 |
10.9 |
10.6 |
9.7 |
8.6 |
8.2 |
|
| 1975 |
7.3 |
6.8 |
7.2 |
7.7 |
8.7 |
9.4 |
10.2 |
10.4 |
10.4 |
9.6 |
9.2 |
7.8 |
|
| 1976 |
7.2 |
7 |
7 |
7.8 |
8.7 |
9.3 |
10.1 |
10.1 |
10 |
9.4 |
8.6 |
8.1 |
|
| 1977 |
7.6 |
7.9 |
8 |
8.3 |
8.8 |
9.7 |
9.9 |
10.8 |
10.3 |
9.2 |
8.6 |
7.9 |
|
| 1978 |
7.6 |
7.9 |
8.3 |
8.9 |
9.4 |
10.3 |
10.4 |
10.9 |
10.5 |
9.8 |
8.2 |
7.3 |
|
| 1979 |
6.5 |
6.9 |
7.5 |
8.3 |
9.5 |
10 |
10.8 |
10.7 |
10.5 |
9.8 |
9 |
8.6 |
|
| 1980 |
7.7 |
7.6 |
7.9 |
8.6 |
9.5 |
9.5 |
10.6 |
10.9 |
10.5 |
9.9 |
9.2 |
8.6 |
|
| 1981 |
8.3 |
8.3 |
8.8 |
9.2 |
9.4 |
9.9 |
10.3 |
10.5 |
10.2 |
9.7 |
9.3 |
8.5 |
|
| 1982 |
7.2 |
7.5 |
8 |
8.8 |
9.9 |
10.7 |
11.4 |
11.8 |
11.4 |
10.3 |
8.8 |
8.3 |
|
| 1983 |
8.6 |
8.6 |
9.3 |
10 |
10.6 |
11.3 |
11.7 |
12.4 |
11.4 |
10.3 |
9.5 |
7.7 |
|
| 1984 |
7.5 |
7.8 |
8.4 |
9 |
9.7 |
10.3 |
11.4 |
11.6 |
10.6 |
9.7 |
8.5 |
6.9 |
|
| 1985 |
6.8 |
6.8 |
7.2 |
8.2 |
9.6 |
10.6 |
11.5 |
11.6 |
10.8 |
9.6 |
6.8 |
6.4 |
|
| 1986 |
7 |
6.6 |
8 |
8.4 |
9.4 |
11 |
10.9 |
11.8 |
10.8 |
9.8 |
8.4 |
7.8 |
|
| 1987 |
7.6 |
7.9 |
8.3 |
8.9 |
9.8 |
10.6 |
11.1 |
11.5 |
11.1 |
10 |
9 |
8.2 |
|
| 1988 |
7.4 |
7.5 |
7.5 |
8.6 |
9.6 |
10.4 |
11 |
11.4 |
10.6 |
9.6 |
8.7 |
7.9 |
|
| 1989 |
7 |
5.8 |
6.8 |
8.2 |
9.5 |
10.7 |
11.3 |
11.2 |
11 |
9.9 |
8.9 |
8.2 |
|
| 1990 |
8.1 |
7.7 |
8.2 |
9 |
9.9 |
10.8 |
11.8 |
12.1 |
12.1 |
10.7 |
9.9 |
8.2 |
|
| 1991 |
7.1 |
7.7 |
7.9 |
8.4 |
9.7 |
9.7 |
10.8 |
11 |
11.2 |
10.1 |
8.9 |
8.3 |
|
| 1992 |
7.9 |
8.1 |
9.5 |
9.5 |
10.2 |
10.7 |
11.1 |
11.4 |
11 |
10 |
9.1 |
7.8 |
|
| 1993 |
6.7 |
6.7 |
7.6 |
8.6 |
9.7 |
10.8 |
11 |
11.2 |
11 |
10.1 |
8.5 |
7.9 |
|
| 1994 |
8 |
7.4 |
8.6 |
9.3 |
10.1 |
10.6 |
11.6 |
11.5 |
11.3 |
10.7 |
9.3 |
8.4 |
|
| 1995 |
8.2 |
8.6 |
8.8 |
9.2 |
10.2 |
11.2 |
11.8 |
11.5 |
11.3 |
10.2 |
9.4 |
8.9 |
|
| 1996 |
8.2 |
7.8 |
8.4 |
9.2 |
10 |
10.4 |
11.5 |
11.5 |
10.5 |
9.9 |
8.7 |
7.6 |
|
| 1997 |
7.7 |
7.9 |
8.1 |
9 |
10.3 |
10.9 |
11.7 |
12.2 |
11.6 |
11.3 |
9.9 |
9.3 |
|
| 1998 |
8.7 |
9.2 |
9.7 |
9.9 |
10.4 |
11.4 |
11.7 |
12.3 |
12.1 |
10.7 |
9.8 |
9 |
|
| 1999 |
8 |
7.8 |
8.1 |
8.9 |
9.5 |
10.4 |
11.1 |
11.5 |
11.9 |
10.1 |
9 |
8.5 |
|
| 2000 |
7.5 |
7.7 |
8.1 |
9.1 |
10 |
11.1 |
11.3 |
11.7 |
11.4 |
10.3 |
9 |
8 |
|
| 2001 |
7.9 |
7.7 |
8.1 |
8.7 |
9.7 |
10.6 |
11.3 |
11.4 |
11.4 |
10.2 |
9.2 |
8.3 |
|
| 2002 |
8.1 |
7.9 |
7.7 |
8.7 |
9.4 |
10.5 |
11,2 |
11.7 |
11.3 |
10.0 |
9.0 |
8.8 |
|
| 2003 |
8.8 |
8.5 |
8.7 |
9.2 |
9.9 |
10.9 |
11.3 |
11.4 |
11.4 |
10.9 |
9.0 |
8.5 |
|
| 2004 |
7.8 |
7.9 |
8.3 |
9.1 |
10.4 |
11.0 |
11.8 |
11.9 |
11.2 |
10.6 |
9.4 |
8.6 |
|
| 2005 |
7.7 |
8.0 |
8.8 |
9.4 |
10.7 |
11.2 |
11.6 |
12.1 |
11.5 |
10.4 |
9.5 |
8.3 |
|
| 2006 |
8.61 |
8.49 |
8.41 |
8.75 |
10.08 |
10.86 |
11.66 |
12.09 |
11.49 |
10.55 |
9.29 |
8.5 |
|
| 2007 |
7.8 |
7.9 |
7.9 |
9.0 |
10.0 |
10.2 |
11.2 |
11.6 |
11.0 |
10.0 |
9.0 |
8.0 |
|
| 2008 |
7.46 |
7.33 |
7.68 |
8.06 |
9.36 |
9.77 |
10.84 |
11.30 |
11.16 |
10.14 |
9.39 |
7.87 |
|
| 2009 |
7.29 |
7.20 |
7.5 |
8.4 |
9.54 |
10.4 |
11.4 |
11.74 |
11.8 |
10.5 |
9.0 |
7.0 |
|
| 2010 |
8.11 |
8.68 |
9.12 |
8.96 |
9.54 |
10.36 |
11.16 |
11.93 |
11.08 |
10.37 |
8.98 |
8.5 |
|
| 2011 |
7.8 |
— |
— |
— |
— |
— |
— |
— |
— |
— |
— |
— |
|
| 2012 |
— |
— |
— |
— |
— |
— |
— |
— |
— |
— |
— |
— |
|
| 2013 |
— |
— |
— |
— |
— |
— |
— |
— |
— |
— |
— |
— |
|
| 2014 |
— |
— |
— |
— |
— |
— |
— |
— |
— |
— |
— |
— |
|
| 2016 |
— |
— |
— |
— |
— |
— |
— |
— |
— |
— |
— |
— |
|
| 2017 |
— |
— |
— |
— |
— |
— |
— |
— |
— |
— |
— |
— |
|
| 2018 |
— |
— |
— |
— |
— |
— |
— |
— |
— |
— |
— |
— |
|
| 2019 |
— |
— |
— |
— |
— |
— |
— |
— |
— |
— |
— |
— |
|
| 2020 |
— |
— |
— |
— |
— |
— |
— |
— |
— |
— |
— |
— |
|
| 2021 |
— |
— |
— |
— |
— |
— |
— |
— |
— |
— |
— |
— |
|
| 2022 |
— |
— |
— |
— |
— |
— |
— |
— |
— |
— |
— |
— |
|
| 2023 |
— |
— |
— |
— |
— |
— |
— |
— |
— |
— |
— |
— |
|
Note, The blanks for the years 1940-41 are due to the Second World War. Apparently during that time, data was not collected by a lightkeeper.
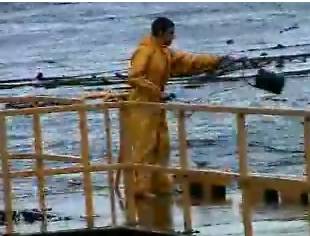
Original data was sent by the Lightkeepers and now by the Marine Protected Area Guardian of Race Rocks to the Institute of Ocean Sciences where it is compiled and displayed at
http://www.pac.dfo-mpo.gc.ca/science/oceans/data-donnees/lighthouses-phares/index-eng.htm
 Decade analysis by G. Fletcher.. NOTE probable evidence of climate change


