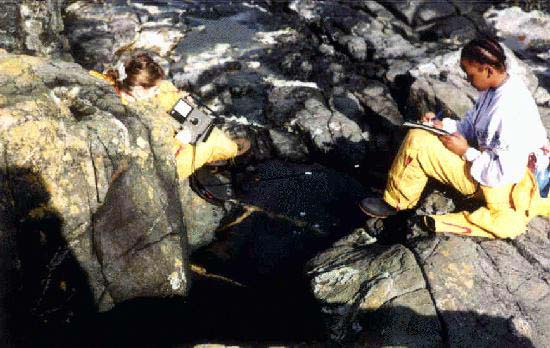
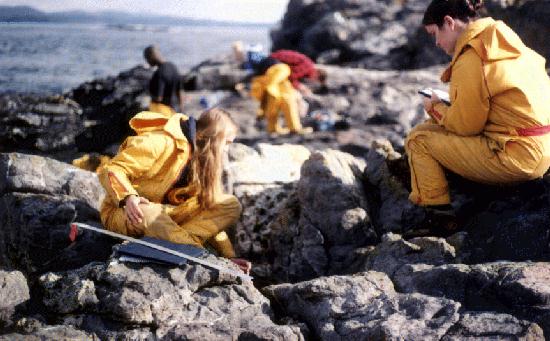
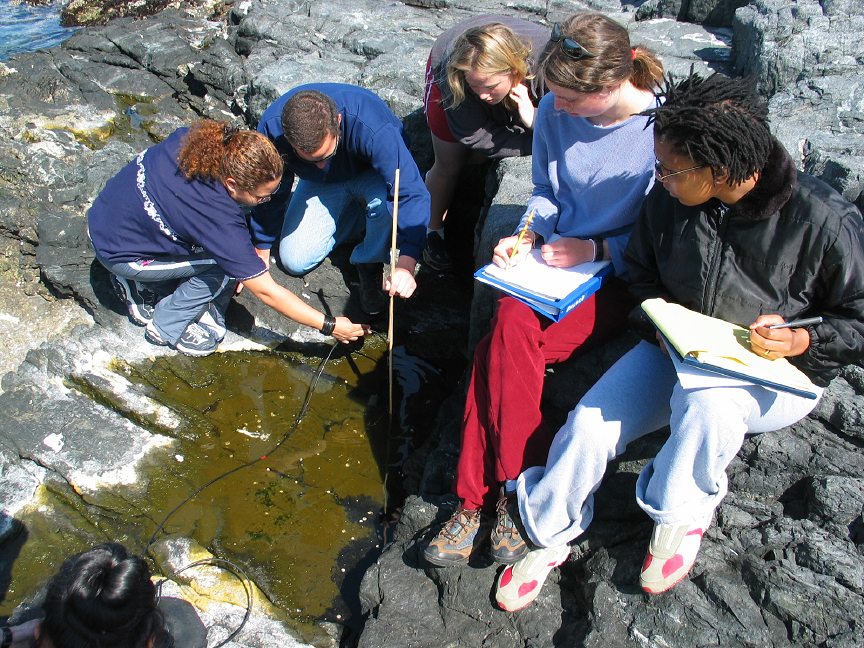
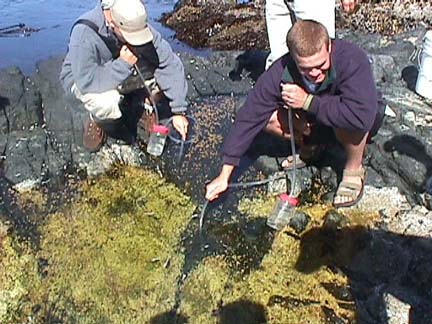
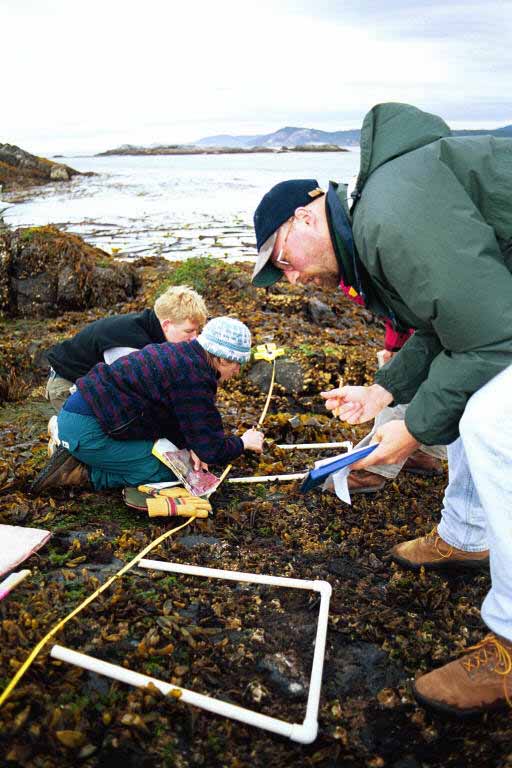
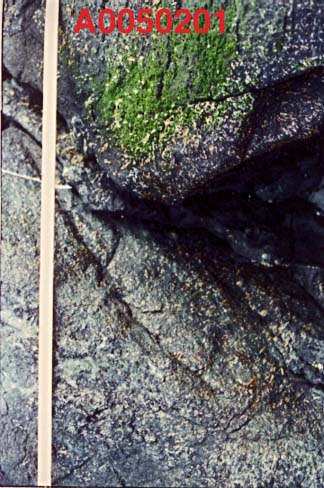
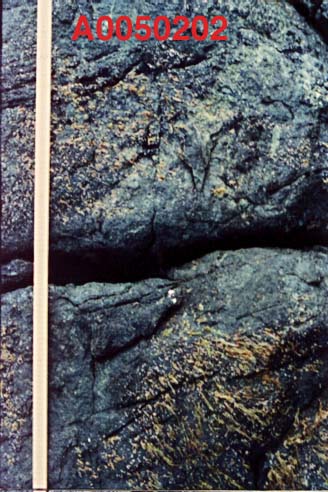
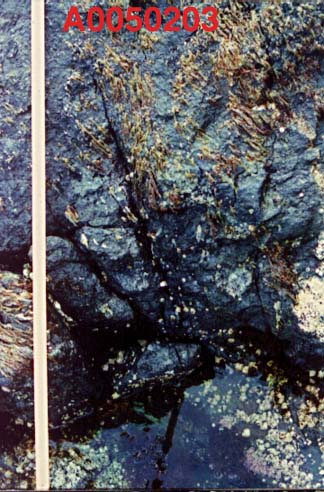
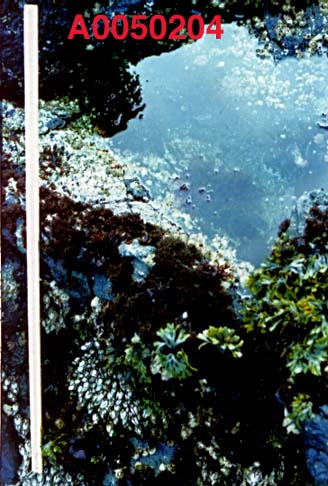
| BACKGROUND :It is intended that,students can access this file as a resource for an assignment in high school biology or college ecology coursers. For several years now, students of biology and environmental systems classes of Pearson College have been doing informal studies on the tidepools of Race Rocks. In April of 1996 we started to make some systematic records of some of the pools and establish a data base to which we could add in the future. The following represents the beginning of our tidepool work. |
| PURPOSE:by Michal Kozak
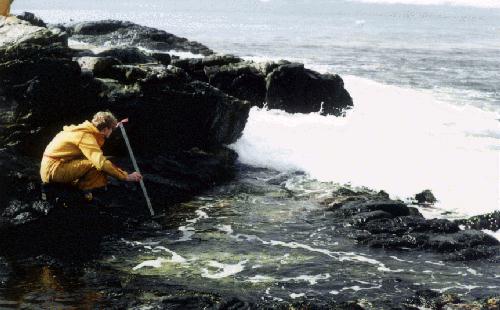
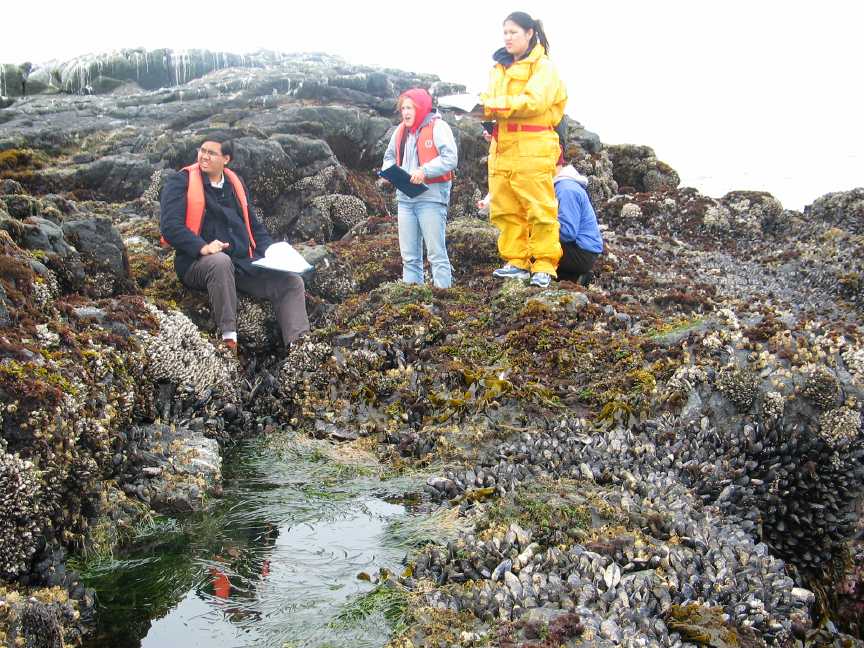
Tide pools are completely separate systems from that of the rocky shore. They form a sort of intermediate situation between the coastal sea and the well-drained intertidal zone, and thus give insights into factors controlling the structure and function of these two bordering systems. Tide pools are suitable for various student projects, similar to the one that we did. It is because of the amazing diversity of life and the wealth of physical, biological, and chemical processes in them. For instance, they show the importance of the desiccation factor on the open shore and they are also ideal observing pH and buffering phenomena. Their generally manageable proportion and simple ecosystems mean that thorough projects in tide pools can be undertaken in a short period. PROCEDURE: On Friday, 12th of April/96 during our block of environmental systems we went by boat to Race Rocks. We moored at the docks and then we went through across the island to the rocky shore. Besides numerous seagulls we saw there several tidepools. The tide level at that time was quite high (1.8 m), so at a lower tide we could have seen more tide pools. There we observed 3 different tide pools that were found close to the red peg, number 6. At each tidepool we measured the following :
We recorded our results and processed them ,thus trying to find general trends in the physical factors observed. The next Wednesday, we went to Race Rocks again. However, this time the tide was lower (0.9 m) which enabled us to observe tide pools at lower levels. We again followed the same procedure as described above. 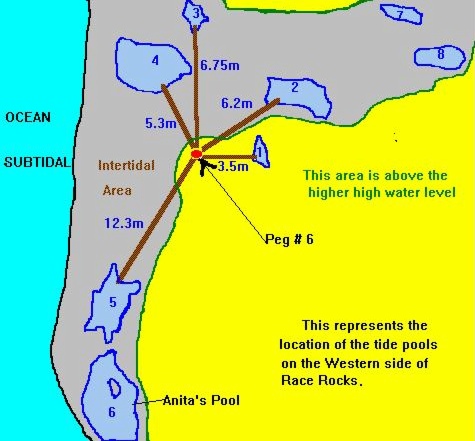
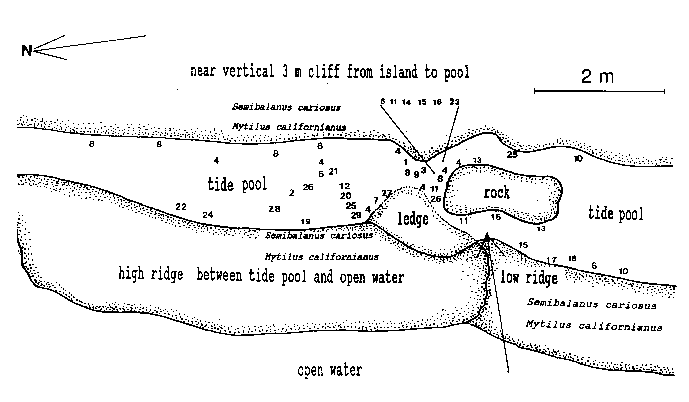
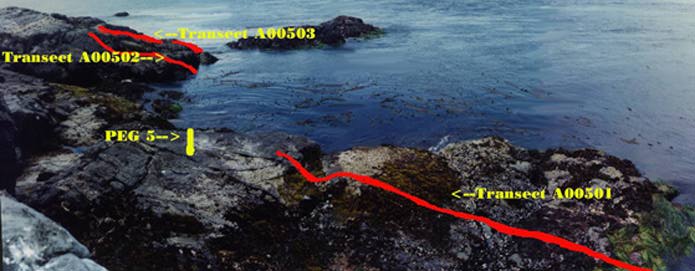
This map presents the horizontal distribution of the tide pools around a permanently installed reference peg on the Western side of Great Race Rock. We have over 15 of these reference pegs around the island. Many are used for subtidal transect work and surveys. Peg #6 is particularly well suited for intertidal work on this Western side of the island. Intertidal transect photos from the peg#5 location may be found at the Race Rocks Section of The Transect File. The magnetic compass bearings of the pools from the reference peg are listed below: Pool 3= 0 degrees. (compass bearing)
Pool 6= 205 degrees (compass bearing). . See the reference below to research work done on this pool by Dr. Anita Brinckmann Voss.
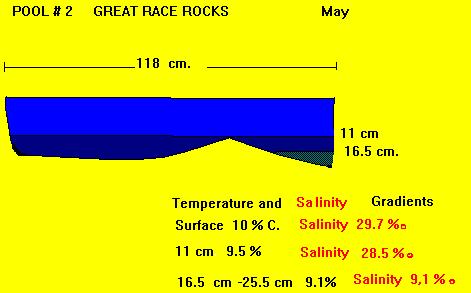
THE TEMPERATURE OF THE TIDE POOLS. Temperature of tide pools was measured for overall differences between pools and for stratification within pools BIOTIC FACTORS OF THE POOLS A species list was made of the pools and graphs were made to compare the numbers of plant and animal species in each pool.
A profile of the vertical distribution of the pools was done by Tamas in the spring of 1998. From this we can make hypothesis about correlations with vertical levels and differences in the pools. THE pH OF THE POOLS
PUBLICATIONS ON TIDEPOOLS:Brinckmann-Voss, A. 1996. Seasonality of Hydroids (Hydrozoa, Cnidaria) from an intertidal pool and adjacent subtidal habitats at Race Rocks, off Vancouver Island, Canada. Scientia Marina, 60 (1): 109-117This work done recently by Dr. Anita Brinckmann-Voss was in a tidepool (#6) adjacent to the ones we have been studying at Race Rocks. The purpose of her paper was “to provide information on the hydroids of a cold temperate tide pool with regard to seasonal occurrence, growth and regression, and reproductive periodicities.” She has reported an assemblage of 27 hydroid species and tracked their seasonal occurrence, growth, sexual maturity and systematics. Possible causes of hydroid species diversity are considered, including location of tide pool in an area of rapid tidal rapids, and shading by surfgrass and rock cliffs during low tide.Thomas, M.L.H.-1983. Marine and Coastal Systems of the Quoddy region, New Brunswick, Canada. Can. Spec.Publ.Fish.Aqua.Sci. 64: 1-306 This reference has been of use to us because it provides a classification scheme for tide pools and a series of charts and graphs which have provided useful models for our studies. Thomas notes that “Although there is a wealth of information on seashores, there is a paucity of information on tidal pools, particularly their functional aspects. There are no texts on pools and those on shores in general (Amos 1966; Carefoot 1977; Clayton 1974 ; Lewis 1964; Southward 1966; Stephenson and Stephenson 1972; Yonge 1949) provide little critical information about tidal pools. This undoubtedly results from the scarcity of scientific papers on tidal pools.”This file was prepared by the students of the Environmental Systems Classes and their teacher G.Fletcher. |
Category Archives: Ecology
Seasonality of hydroids (Hydrozoa, Cnidaria) from an intertidal pool and adjacent subtidal habitats at Race Rocks, off Vancouver Island, Canada*
SCI. MAR., 60 (1): 89-97
SCIENTIA MARINA 1996 ADVANCES IN HYDROZOAN BIOLOGY, S. PIRAINO, F. BOERO, J. BOUILLON, P.F.S. CORNELIUS and J.M. GILI (eds.)
A. BRINCKMANN-VOSS
Department of Invertebrate Zoology, Royal Ontario Museum, 100 Queen’s Park, Toronto, Ontario M5S 2C6, Canada.
Mailing address: P. 0. Box 653, Sooke, British Columbia VOS 1NO, Canada
see this link for images of hydroids studied in this paper: https://www.racerocks.ca/tag/hydroid/
See this link for images of Tidepool # 6 “Anita’a Pool”
*Received November 29, 1994, Accepted October 20, 1995
SUMMARY: An assemblage of 27 hydroid species was reported from a tide pool in the lower rocky intertidal zone, and compared with 42 hydroids of the adjacent subtidal region. Location of hydroids within the pool, seasonal occurrence, growth and sexual maturity were tabulated, and some systematic aspects discussed . Possible causes of hydroid species diversity were considered, including location of the tide pool in an area of tidal rapids, and shading by surfgrass and rock cliffs during low tide.
Key words: tide pools, hydroids, seasonality, Pacific coast.
INTRODUCTION
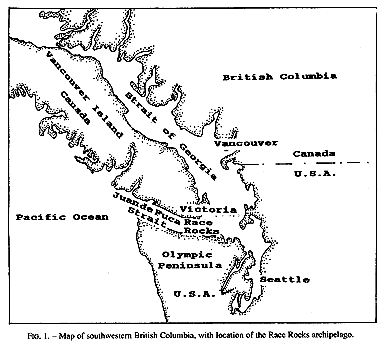
Invertebrate species diversity is high around Race Rocks (48′ 18′ N, 123′ 32′ E), an archipelago in the Strait of Juan de Fuca between Vancouver Island, Canada, and Washington state, USA. (Fig.1,2). Although publications of marine invertebrates are available for the areas to the east and west of Race Rocks (Henkel, 1906; Fraser, 1913; Kozloff, 1983), information about invertebrates from Race Rocks is mostly limited to personal observations or unpublished reports: P. Breen, Pacific Biological Station Nanaimo, Dpt.Fisheries and Oceans; P. Lambert, curator of invertebrates, Royal British Columbia Museum; Garry Fletcher and student essays from Lester Pearson College of the Pacific: in Race Rocks Ecological reserves #97 publications list 1988-1994). Because of its rich biota, the area is now protected as an ecological reserve. Research on hydroids there, started in 1984, continues today by permit.
Taxonomic investigations have been published previously to characterize some of the hydroid species mainly from a tide pool on the west side of Great” (great is ommitted trom here on) Race Rocks (Brinck-mann-Voss 1988; Brinckmann-Voss et al., 1993) . However, information about the cornpositon and distribution of hydroid species in the pool is lacking, as is a comparison of its hydroid fauna with that of the surrounding intertidal and adjacent subtidal shelf.
The purpose of this paper is, therefore, to provide information on the hydroids of a cold temperate tide pool with regard to seasonal occurrence, growth and regression, and reproductive periodicities. This research is intended as essentially a faunal study rather than a dedicated ecological work employing methods and analysis such as described for rocky shores by Paine (1994).
DESCRIPTION OF STUDY AREA
The study area may be classified as protected outer coast, the main island of Race Rocks being protected by surrounding rocks and reefs . The west and north sides of the island are swept by very swift tidal rapids with a maximum velocity of 3 m /s (Fig.2). The average maximum velocity for the first half of June 1995 , which included a neap and leap tide, was calculated at 2.7 m/s (Canadian Tide and Current Tables, 1995).
The tide pool studied here is located on the west side of the island in the low intertidal zone in the middle of the Pseudobalanus cariosus – Mytilus californianus – Pollicipes polymerus belt (Lewis, 1964; Ricketts and Calvin, 1968; Carefoot, 1977). It may be classified as “Ic” after the pool classification summarized by Thomas (1983). The pool surface emerges at 1.5 m above 0 tide level (0 represents the chart datum in Canadian Tide and Current Tables) (Figs.3,5).
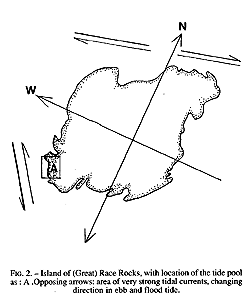
FiG. 2. – Island of (Great) Race Rocks, with location of the tide pool As: A .Opposing arrows: area of very strong tidal currents, changing direction in ebb and flood tide.
p89
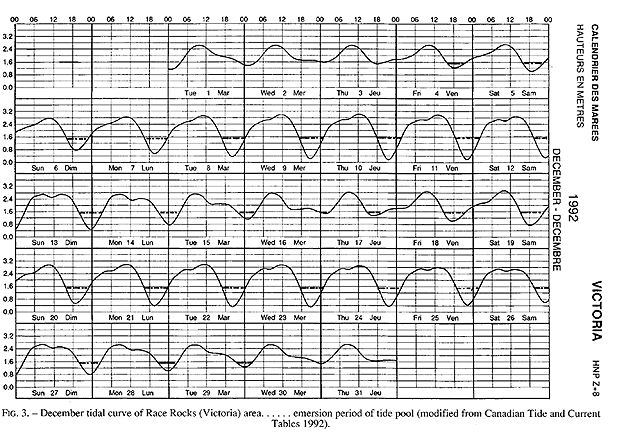
FIG. 3. – December tidal curve of Race Rocks (Victoria) area…… emersion period of tide pool (modified from Canadian Tide and Current Tables 1992).
Emersion of the pool surface is most obvious at leap tides. Although the pool may be exposed even at neap tides, waves and swells keep it awash, especially in stormy winter weather. During the emersion periods at leap tides, the pool does not drain and its water level changes are minimal. It is situated between a high cliff on the island side and a lower cliff toward the open sea. These two cliffs join at the north and south sides of the pool, thus forming a deep trough . Once emersed the pool is about 8m by 1.5m, slightly less wide in its northern part, with a maximum depth of 0.8m (Fig.4). It narrows in the middle with an exposed rock creating a small island (Fig.5). During incoming tide this is the first area to be flooded.
The surface temperature of the sea around Race Rocks varies during the year between 7 degrees C and 12 degrees C. Contrary to conditions in a shallow pool (without hydroids) 2m higher in the same area, surface and bottom temperatures in the lower and deeper pool, abundant with hydroids, scarcely differ from the sea temperature. Only during summer low tides, when the sun reaches the pool during the second third of the emersion period, are surface temperatures higher (2’C, rarely 42C )than the bottom temperatures or in the surrounding sea. Water temperatures were checked only February to October, because of the pool’s relative inaccessability in winter.
Unlike in the higher pool, salinities in the pool correspond with that of the adjacent sea (29-30%o, measurements provided partly by Garry Fletcher) from February to October.
No measurements of salinity and temperature were taken from November to January. However, the state of the surfgrass (Phyllospadix scouleri) lining the upper rim of the pool indicated that heavy winter rains in combination with low temperatures (Tokioka, 1963) impact the intertidal environment, including the rock pool. Lewis (1964), Carefoot (1977), and Thomas (1983) report on similar destructive effects of winter rains. The study area also encompassed the rocky infralittoral and subtidal, extending from 0-18m depth, to a distance of about 50 m from the shore around Race Rocks.
page 91
MATERIAL AND METHODS
Collections of hydroids from the tide pool were made from March to October, over a period from 1984 to 1994.
Hydroid specimens were returned live to the laboratory, where they were examined and some photographed. Many were cultured to establish their identity, especially when specimens were collected in the hydrorhiza stage only. Species, depth and location of the hydroids were mapped on a diagram on the site.
Samples from the sublittoral shelf were taken by divers. The samples that were collected included both hydroids and a variety of bottom material, such as kelp holdfasts, barnacles, and mussels. These substrates were examined for small hydroids in the laboratory.
RESULTS
92
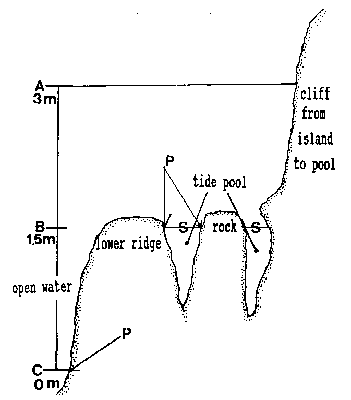
FiG. 5. – Cross-section of tide pool at area of rock in center of pool. A: High water of high spring tide. B: Emersion level of tide PWI. C: Lower low water of spring tide. A to C represent the intertidalregion. S: Surface of tide pool at 1.5 m tide level and lower tides. P: phyllospadix scouleir belt, located 1.5 m higher in the pool than on the open shore, where it can be found at the border between the intertidal and subtidal, marked as C
Except for one hydroid species (Rhizogeton nudus) among the stalks of Pollicipes polymerus, no hydroids were found in the intertidal outside the pool between pool and infralitioral fringe.
Species composition of the pool and of adjacent subtidal regions was similar, with a few notable exceptions: luxurious colonies ofSarsia eximia and Phialella sp. occurred on the rhizomes of Phyllospadix sculeri (Zosteraceae, Angiospermeae) lining the rim of the rock pool, but these species were less abundant in the Phyllospadix scouleri belt of the infralittoral of the open coast, (for location ofPhyllospadix scouleri see Fig.5). Conversely, larger species of the Sertulariidae were more diverse and abundant subtidally than in thepool. Plumularia setacea was common in the pool but less so subtidally, whereas Plumulara lagenifera was not found in the pool, but was abundant subtidally.
Hydroids of the tide pool were referrable to three groups. Group A showed marked seasonal cycles of activity and regression, with hydroid colonies represented during a dormant phase by hydrorhizae only. Species of group B were present periodically as small colonies, typically in early spring, and then enlarged during late spring and summer. Group C included species in which the activity patterns and colony sizes remained relatively unchanged throughout the year.
Included in group A was Hybocodon prolifer, abundant and fertile in late winter and spring, but reduced only to stolons in summer and fall. Sarsia eximia and Phialelia sp. (described by Boero 1987, but not named), living among the rhizomes of Phyllospadix scouleriplants (Zosteraceae), were reduced to hydrorhiza or to small colonies with a few sterile hydranths in late winter and spring. Both species occurred as large and fertile colonies in summer spreading occasionally onto the outer dead leaf sheadi of Phyllospadix or onto the surrounding rocks.
Peak reproduction was in June and July for Sarsia eximia and in September for Phialella sp.
Species of group B (e.g. Orthopyxis integral Obelia dichotoma, Garveia annulata, and Clavactinia sp.) were present as small patches in early spring. By late summer their colonies had enlarged and stolonal species covered wide areas on the rock walls of the pool. InClavactinia sp., reduction and expansion of the same colony was observed over a period of two years.
Species assigned to group C changed little in colony size during the year. These included representatives of the families Stylasteridae, Plumulariidae, and Sertulariidae. This may be related to their morphology, as their hydranths are more protected through the extensive perisarc of the colony, than species of group A and B.
DISCUSSION
Systematics: The taxonomy of hydroids from the northeastern Pacific, and especially of the Leptothecatae (terminology after Cornelius, 1992), is inadequately known. A large number of species has been reported from the area by Fraser (1913,1937), and before him by authors including Nutting (190015), Torrey (1902), and Clark (1876, 1877). However, many specimens collected from Race Rocks and adjacent areas do not correspond with descriptions of such species, a problem discussed by Brinckmann-Voss (1983) and Mills and Miller (1987). Detailed monographic revision is therefore needed from hydroids of the northeast Pacific. Comparisons are warranted with the hydroid fauna of the northwest Pacific (Yamada, 1959; Naumov, 1960; Antsulevich, 1992; Antsulevich and Vervoort, 1993), and with that of the circumpolar Arctic (Broch, 1909), as done by Kramp (1959, 1965, 1968) for the hydromedusae.
Accordingly, several species in this paper were identified only to the genus level (Tables 1-3). Work is currently underway on the Plumulariidae from Race Rocks and elsewhere on the British Columbia coast (Brinckmann-Voss and Calder, unpublish data). Changes of family and genus were made of two species of Anthoathecatac. Hataia parva Hirai and Yamada 1965, previously assigned to the Clavidae, is assigned here to the Acaulidae. Features described in the original (Hirai and Yamada, 1965) and in recent (Yamada and Kubota, 1989) work on the species as to its solitary nature, mode of asexual reproduction, and presence of stenoteles, justified placing Hataia near the genus Acaulis Stimpson, family Acaulidae. A species identified as Hydractinia milleriTorrey 1902 in Morris et al. (1980) is tentatively referred to the genus Clavactinia Thomely as Clavactinia sp. because its gastrozooids have several whorls of tentacles (Millard, 1975). The species listed in Morris, Abbott and Haderlie and found in the Race Rocks area is distinguished from H. milleri Torrey in
93
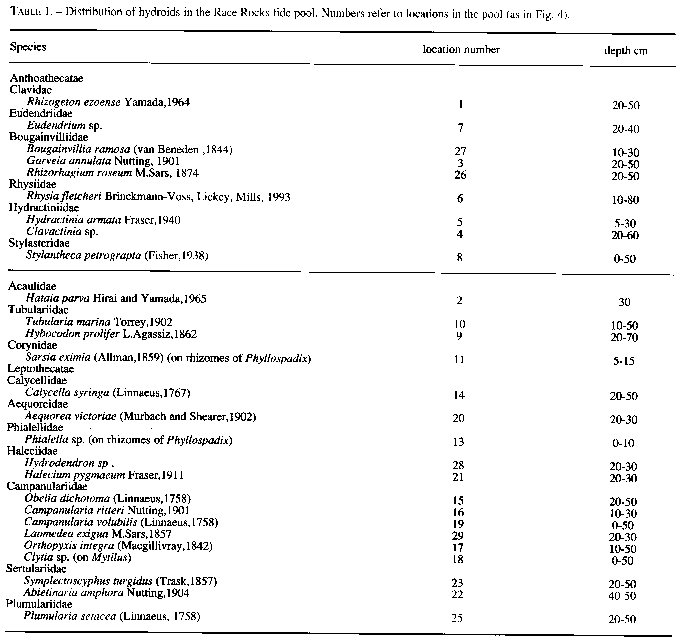
TABLE 1. Distribution of hydroids in the Race Rocks tide pool. Numbers refer to locations in the pool (as in Fig. 4).
Species
Anthoathecatae
Clavidae
Rhizogeton ezoense Yamada,1964
Eudendriidae
Eudendrium sp.
Bougainvilliidae
Bougainvillia ramosa (van Beneden , I 844)
Garveia annulata Nutting, 1901
Rhizorhagium roseum M.Sars, 1874
Rhysiidae
Rhysia fletcheri Brinckmann-Voss, Lickey, Mills, 1993
Hydractiniidae
Hydractinia armatata Fraser, 1940
Clavactinia sp.
Stylasteridae
Hataia parva Hirai and Yamada, 1 965
Tubulariidae
Tubularia marina Toney, 1902
Hybocodon prolifer L.Agassiz, 1 862
Corynidae
Sarsia eximia (Allman,1859) (on rhizomes of Phyllospadix)
Leptothecatae
Calycellidae
Calycella syringa (Linnaeus, 1767)
Aequoreidae
Aequorea victoriae (Murbach and Shearer, 1902)
Phialellidae
Phialella sp. (on rhizomes of Phyllospadix)
Haleciidae
Campanularidae
Canpanularia volubilis (Linnaeus,1758)
Laomedea exiguae M.Sars,1857
Orthopyxis integra (Mugillivray,1942)
Clytia sp. (on Mytilus)
Sertulariidae
Abietinaria amphora Nutting, 1904
Plumulariidae
having several purple eggs per gonophore, in lacking spines on the colony, and in having two types of gastrozooids. Torrey (1902) originally described H. milleri from Monterey Bay, California, and reported only one orange egg per gonophore. Mills and Miller (1978) also reported Hydractinia milleri with one egg. Clavactinia sp. is common on rock walls in the tide pool, and on rockwalls and overhangs in sheltered spots exposed during tides below the 0 level or chart datum (in Canadian tide and current tables 1984-1995). A description of this species is in preparation, together with a revision of the Hydractiniidae of the British Columbia coast (Brinckmann-Voss, unpublished data).
. Ecological remarks:
Although tide pools have
94
been studied frequently in different parts Of the world, little research has been published about them. Most work on tide pools has involved studies of algae and their reaction to changing salinity, temperature, desiccation, sometimes in comparison to open waters (Doty, 1957; Lewis, 1964; Carefoot, 1977; Newell, 1979; Thomas, 1983). More detailed investigation on fauna and flora of tidepools was reported by Stephenson et al. (1934), Pyefinch (1943), and Emson (1986), but there is very little information on hydroids in such pools. This is probably because the hydroid fauna of the intertidat zones – except for the infralittoral fringe (Stephenson and Stephenson, 1972; Carefoot, 1977; Kozloff, 1983; Calder, 1991 a,b) – is rather limited, as papers
on intertidal zonation show (e.g. Southward, 1958; Ricketts and Calvin, 1968).
Cornelius (1988) listed the hydroid fauna of tide pools at Holme next the Sea (U.K.), but in that case the hydroids were swept in from offshore areas, and were not autochthonous to the pool.
Some of the references cited above may help explain the diversity and abundance of hydroids in the Race Rocks tide pool:
1. Doty (1957) mentioned the abundance of organisms at the rim of tide pools, probably related to the “edge effect” reported by other ecologists (Carefoot, 1977). It may be assumed that the luxurious colonies of Phialella sp. and Sarsia eximia in the root system of the surfgrass immediately below the water surface of the pool could be related to
this edge effect, although its cause may be difficult to pinpoint.
2. Wedler (1975), studying comparable sites, reported of a greater abundance of hydroids in shaded than in sunny areas , where algae tend to dominate. (The same was observed by the author on the shaded and sunny side of floating docks). The qualitative and quantitative abundance of hydroids and relatively few algae in the pool may be influenced by this “shade ” effect, because the pool is shaded during emersion by the leaves of the surfgrass which form a canopy on its surface.
3. Lewis (1964) reported the influence of different velocities of tidal rapids on the intertidal fauna. From that work it may be inferred that the tidal rapids sweeping the tide pool area of Race Rocks
TABLE 2. – Seasonality of hydroids in the Race Rocks tide pool, March to October. Smaller and less abundant hydroid species, difficult to detect without taking material out of the pool, are marked (?); species with living hydranths absent were marked (-); those with hydranths present (+); those with gonads < colonies augmenting in size, > diminishing in size. For authors see table I
Species M A M J J A S O
Anthoathecatae
Clavidae
Rhizogeton ezoe se – – + – ++ ++ + +
Eudendriidae
Eudendrium sp. + + + + + + + +
Bougainvilliidae
Bougainvillia ramosa + + + + + + + +
Garveia annulata + +< ++ ++ ++ ++ ++ ++
Rhizorhagium roseum + + ++ ++ + ? ? ?
Rhysiidae
Rhysiafletcheri + ++ ++ ++ ++ ++ ++ ++
Hydractiniidae
Hydractinia armata – + < ++ ++ ++ ++ ++ ++
Clavactinia sp. + + ++ ++ ++ ++ ++ ++
Stylasteriidae
Stylantheca petrograpta + + + + + + + +
Acaulidae
Hataia parva ? ? ? + ? ? ? ?
Tubulariidae
Tubularia marina – – ++ ++ ++ ++ ++ ++
Hybocodon prolifer ++ ++ + – – – – –
Corynidae
Sarsia eximia + ++ ++ ++ >+ + + +
Leptothecatae
Calycellidae
Calycella syringe ? ? ++ ++ ++ ++ + +
Aequoreidae
Aequorea victoriae Phialellidae? ? ? ? + ? ? ?
Phiatella sp. < ++ ++ ++ ++ ++ ++ >
Haleciidae
Halecium pymaeum + + + ++ ++ ++ ++ ++
Hydrodendron sp. + + + + + + + +
Campanulariidae
Obelia dichotoma + <++ <++ ++ ++ ++ ++ ++
Campanularia ritteri + + ++ ++ ++ + + +
Campanularia volubilis + ++ ++ ++ ++ ++ ++ ++
Orthopyxis integra + <+ <++ <++ ++ ++ ++ ++
Laomedea exigua ? ? ? ? ? ++ ? ?
Clytia sp. ? ? ? + ++ ++ ++ ++
Sertulariidae
Symplectoscyphus turgidu s + + ++ ++ ++ ++ ++ ++
Abietinaria amphora ++ ++ ++ ++ ++ ++ ++ ++
Plumulariidae
Plumularia setacea + ++ ++ ++ ++ ++ ++ ++
95
TABLE 3. – Hydroids identified from the infralittoral fringe and subtidal areas of Race Rocks, to a depth of 18 m, mostly west and north of the tide pool. Asterisks indicate species which were also found in the tide pool.
Anthoathecatae
Clavidae
Rhizogeton nudus Broch, 1910
Eudendriidae
Eudendrium sp. (probably not same species as in tide pool) Bougainvilliidae
Bougainvillia sp. (not ramosa)
Garveia annulata* Nutting, 1901
Rhizorhagium roseum* M.Sars, 1864
Rhysiidae
Rhysiafletcheri* Brinckmann-Voss, Lickey and Mills, 1993 Hydractiniidae
Clavactinia sp. *
Stylasteridae
Tubulariidae
Corynidae
Sarsiaproducta (Wright, 1858)
Sarsia tubulosa (M.Sars, 1835)
Leptothecatae
Calycellidae
Haleciidae
Lafoeidae
Campanularia sp.
Clytia sp.
Obelia dichotoma* (Linnaeus, 1758)
Orthopyxis Integra
Sertulariidae
Abietinaria greenei (Murray, 1860)
Abietinaria anguina (Trask, 1857)
Hydrallmania distans Nutting, 1899
Symplectoscyphus turgidus* (Trask, 1857)
Symplectoscyphus sp. tricuspidatus? (Alder, 1856)
Thuiaria sp.
Aglaopheniidae
Plumulariidae
Plumularia setacea*(Linnaeus, 1758)
Plumularia lagenifera Allman, 1885
Kirchenpaueriidae
Kirchenpaueria plumularoides (Clark, 1876)
play an important role in the establishment of the hydroid fauna there.
Work on seasonality of hydroids has been done in different marine environments and climates (Riedl, 1959; Bouillon, 1975; Wedler, 1975; Boero and Fresi, 1986; Brinckmann-Voss, 1987; Calder, 1990; Garcia-Rubies, 1987,1992). Seasonal changes in the Race Rocks tide pool are most evident from late fall to spring – mainly on the species near the surface, when a marked regression occurs in numerous species. This regression is most likely caused by dilution of surface salinities during rain storms in the low winter tides (Carefoot, 1977; Thomas, 1983).
ACKNOWLEDGEMENTS
Research for this paper would not have been possible without the help of Garry Fletcher (senior biologist), Theo Dombrowsky and students of the Lester Pearson College of the Pacific (Metchosin, B.C., Canada). I thank them and the administration of the College for their help. Garry Fletcher introduced me to the tide pool on Race Rocks, instructed his students in searches for hydroids by diving, and made numerous collections by diving himself. Joan and Charles Redhead, former lighthouse keepers at Race Rocks, allowed me to stay at their lighthouse residence for several days during low tide periods, which allowed me to go back to the tide pool and check details during the same low tide period. I acknowledge their hospitality and help. Dale Calder (Royal Ontario Museum, Toronto, Canada) helped with this paper from its early stages through numerous discussions, advice and reviews, for which I am very thankful. I thank Paul Cornelius ( Natural History Museum, London, U.K.) for all help, especially with search for ecological literature, and I thank Stephen Cairns (National Museum of Natural History, Washington, U.S.A.) for identifying the Stylasteridae.
96
PLEASE NOTE: THIS VERSION HAS BEEN SCANNED BY OPTICAL CHARACTER RECOGNITION. MOST HAS BEEN CORRECTED BUT IT MAY STILL HAVE A FEW ERRORS. -GF
REFERENCES
Antsulevich, A. – 1992. Observations on the hydroid fauna of the Kurile Islands. Sci. Mar. 56(2-3):213-216.
Antsulevich, A. and W. Vervoort. – 1993. Some little known species of hydroids (Cnidaria: Hydrozoa: Lafoeidae) and description ofPapillionella pterophora gen. nov. spec. nov. Zool. Meded. 67: 431-443.
Boero, F. 1987. – Life cycles of Phialella zappai n.sp., Phialella fragilis and Phialella sp. (Cnidaria, Leptomedusae,Phialellidae) from central California. J. nat. Hist. 21: 265-480.
Boero, F. and E.Fresi. – 1986. Zonation and evolution of a rocky bottom hydroid community. P.S.N.I.-Mar. Ecol. 7:123-150.
Bouillon, J. – 1975. Sur la reproduction et 1’6cologie de Paracoryne huvei Picard (Tubularoidea-Athecata-Hydrozoa- Cnidaria). Arch. Biol., 86:45-96.
Brinckrnann-Voss, A.- 1983. British Columbia marine faunistic report on the Hydrozoa, part 2 Hydroids. Canadian Technical Rep.of Fish. Aquat Sci, 1185: 1-20.
Brinckmann-Voss, A. – 1987. Seasonal distribution of hydromedusa (Cnidaria, Hydrozoa) from the Gulf of Naples and vicinity, with observation on sexual and asexual reproduction in some species. In: J. Bouillon, T. Boero, F. Cicogna and P.F.S. Cornelius (eds.)Modern Trends in the Systemtics, Ecology, and Evolution of Hydroids and Hydromedusae, pp. 133-141. Clarendon Press, Oxford.
Brinckmann-Voss, A. – 1988. Sarsia cliffordi n.sp. (Cnidaria, Hydfozoa, Anthomedusn) from British Columbia with distribution records and evaluation of related species. Can. J. Zool. 67: 685-691.
Brinckmann-Voss, A., D.M. Lickey, and CF. Mills. – 1993. Rhysia fletcheri (Cnidaria, Hydrozoa, Rhysiidae) a new species of colonial hydroids from Vancouver Island (British Columbia, Canada) and the San Juan Archipelago (Washington, U.S.A.). Can. J. Zool. 71: 401-406.
Broch, H. – 1909. Die Hydroiden der arktischen Meere. Faun Arctica 5: 129-247.
Calder, DR. – 1990 . Seasonal cycles of activity and inactivity to some hydroids from Virginia and South Carolina, U.S.A. Can.J. Zool.68: 442-450.
Calder, DR. – 1991 a. Associations between hydroid species assemblages and substrate types in the mangal at Twin Cays, Belize. Can. J. Zool. 69:2067-2074.
Calder,D.R. 1991 b.Vertical zonation of the hydroid Dynamena crisioides ( Hydrozoa, Sertulaiiiidae) in a mangrove ecosystem at Twin Cays,.Belize. Can. J. Zool. 69: 2993 2999.
Canadian Tide and Current Tables, Volume 5, Juan de Fuca Strait and Strait of Georgia.- 1984-95. Dpt. Fish. Oceans, Ottawa, Canada.
Carefoot, T. – 1977. Pacific Seashores. J.J. Douglas Ltd, Vancouver.
Clark, S. F. – 1876. The hydroids of the Pacific coast of the United States, south of Vancouver Island. With a report on on those in the museum of Yale College. Trans Connecticut Acad Arts Set., 3: 249-264.
Clark, S. F. – 1877. Repon on the hydroids collected on the coast of Alaska and the Aleutian Islands, by W. H. Dall, U. S. Coast Survey, and party, from 1871 to 1874 inclusive Proc. Acad. Nat. Sci. Philadelphia 1876: 209-238.
Cornelius, P.F.S. 1988. Hydroid collection from intertidal pools at Holme next the Sea, Norfolk. Trans. Norfolk and Norwich Field Soc., 28: 72 78.
Cornelius, P.F.S. – 1992. Medusa loss in leptolid Hydrozoa (Cnidaria), hydmid rafting, and abbreviated life-cycles among their mmote-island faunae: an interim review. Sci. Mar. 56: 245-261.
Doty, M.S. – 1957. Rocky Intertidal Surfaces. Geol.Soc. Ame. Mem. 67: 535-585.
Emson,R.H. 1986.Life history patterns in rock pool animals.in: P.G.Moore and R.Seed (eds), The Ecology of Rocky Coasts. pp. 220-222. Columbia University Press, New York.
Fraser, C.M. – 1913. Hydroids from Vancouver Island and Nova Scotia. Bull. Victoria Mem. Mus. :147-188.
Fraser,C.M. 1937.Hydroids of thePacificCoast ofCanada and the United States. University of Toronto Press, Tomnto.
Garcia Rubies, A. – 1987. Distribution of epiphytic hydroids on Posidonia sea gmss. In: J. Bouillon, T. Boero , F. Cicogna and P.F.S. Cornelius (eds.) Modern Trends in the Systematics, Ecology, and Evolution of Hydroids and Hydromedusae, pp. 143-155. Clarendon Press, Oxford.
Garcia Rubies, A. – 1992. Habitat differentiation among epiphytic hydroids of the smgms Posidonia Oeanica from the Medes islands (NE Catalonia, Spain). Sci.Mar. 56: 263-267.
Henkel, I. – 1906. A study of tide-pools on the west coast of Vancouver Island. Postelsia 2:277-304.
Hirai E. and M. Yamada. – 1965. On a new athecate hydroid Hataia parva – n. gen., n. so. Bull. Mar. Biol. Stn. Asamuchi, .12: 59-62.
Kozloff, EN. – 1983. Seashore Life of the northern Pacific coast, rev. edition. Douglas and McIntyre, Vancouver.
Kramp, P.L. – 1959. The Hydromedusn of the Atlantic Ocem and Adjacent Waters. Dana Rep. 46: 1-283.
Kramp, P.L. – 1965. The Hydmmedusae of the Pacific and Indian Oceans, 1. Dana Rep. 68: 1-162.
Kramp, P.L. – 1968. The Hy&medusae of the Pacific and Indian Oceans, 11, III. Dana Rep. 72: 1-200.
Lewis, JR. – 1964. The Ecology of the rocky shores. ‘The English University Press, London.
Millard, N.A.H. – 1975. Monograph of the Hydroida of Southern Africa. Ann. S. Afri. Mus. 68: 1-513.
Mills, C. and R. Miller. – 1987. Hyroid polyps. In: Kozloff, E.N. (ed), Marine Invertebrates of the Pacific Northwest. pp. 44-62 Univ. Washington Press, Seattle.
Morris, R.H., Abbott, D.P, and Haderlie, E.C. – 1980. Intertidal Invertebrates of California. Stanford University Press, Stanford, California.
Naumov, D.V. 1960. Hydroids and Hydrowdusae of the USSR pan I-VI. English translation of original Russian in Israel Program for Scientific Translation , Jerusalem 1969 cat. no. 5108.
Newell, RC. – 1979. Biology of Intertidal Animals. Marine Ecological Surveys Ltd., Famshm, Kent.
Nutting, C.C. – 1900-1915. American hydroids, part 1-3. Smithsonian Institution, United States National Museum, Special Bulletin.
Paine, R.T. – 1994. Marine Rocky Shores and Commnity Ecology: An Experiwntalist’s Perspective. Excellence in Ecology:4. Ecology Institue, Oldendort/Luhe.
Pyefinch, K.A. – 1943.The interlidal ecology of Bardsey Island, North Wales , with special reference to the m-colonisation of rock surfaces, and the rock pool environment. J. Anim.Ecol. 12:82 108
Race Rocks Ecological Reserves #97. Publications List. B.C Parks, Ecological Reserves Office, 800-2 Johnsen Street, Victoria, B.C. V8V I X4 Canada.
Ricketts, E.F. and J. Calvin. 1968. Between Pacific Tides, 4th. ed., revised by J.W. Hedgpeth. Stanford Univ. Press, Stanford.
Riedl,R. – 1959. Die Hydroiden des Golfes von Neapel und ihr Anteil and der Fauna unterseeischer H6hlen. Ergebnisse der osterreichischen Tyrrhenia Expedition 1952 Teil 16. Pubbl. Stn. Zool. Napoli. 30 ( Suppl.) :589-755.
Southward, A.J. – 1958. The Zonation of Plants and Animals m Rocky Sea Shares. Biol-R”., Cambridge Phil. Soc. 33: 137-177.
Stephenson, T.A. and A. Stephenson. – 1972. Life between Tidemarks on Rocky Shores. W.H. Freeman and Company, San Francisco.
Stephenson,T.A., Zmnd, A. and J. Eym. – 1934.The liberation and ufilisation of oxygen by the population of rock pools. J. Exp.Biol. II: 162-172.
Thomas, M.L.H. – 1983. Marine and coastal systems of the Quoddy region, New Bmnswick, Canada. Can. Spe. Publ. Fish. Aqua.Sci. 64: 1-306.
Tokioka,T. – 1963. Supposed effects of the cold weather of the winter 1962-63 upon the intertidal fauna of the vicinity of Seto.Publ. Seto Mar. Lab. 9(2) :415-437.
Torrey, H.B. – 1902. The Hydroids of the Pacific Coast of North America with special reference to the species in the collection of the University of California. Univ. Calif. Public. Zool. 1: 1-104.
Wedler, E. – 1975. Okologische Untmuchungen an Hydroiden des Felslitorals von Santa Marta (Kolumbien). Heigolinder wiss.Meeresunters. 27: 324-363.
Yamada, M. – 1959. Hydroid fauna of Japan and its adjacent water. Publ. Akkeshi Mar. Biol. Star. 9: 1-101.
97
Transects for Environmental Monitoring at Race Rocks
CONTENTS: This section on Transects is composed of Several Parts:
1. This Page with background and some ideas.
2. Why do Transects.. overview and Techniques.
3. For a more in depth exercise on the Ecological Niche of organisms see this file: Ecological niche, The Empirical Model
4.See the following completed photographic transects:
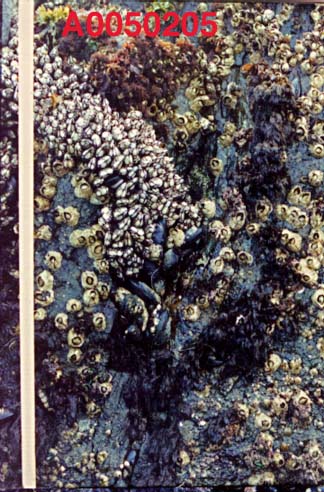
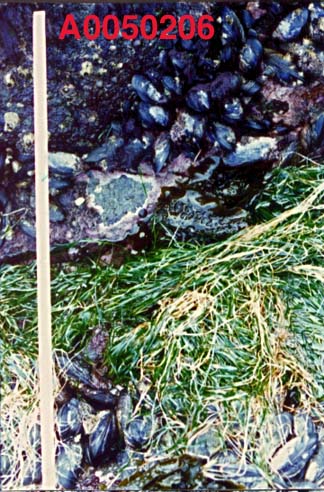
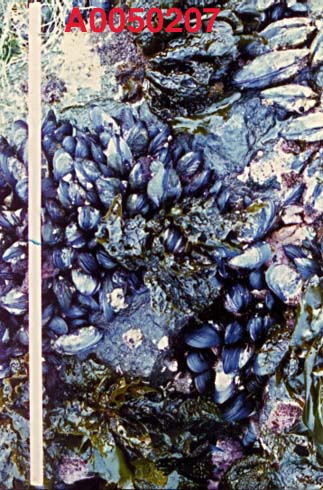
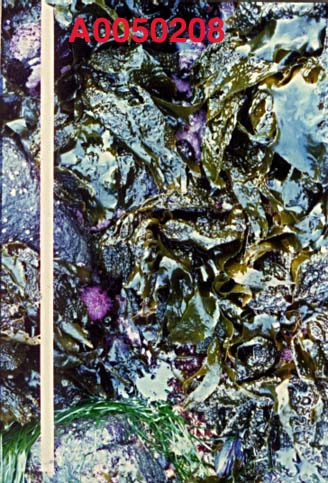
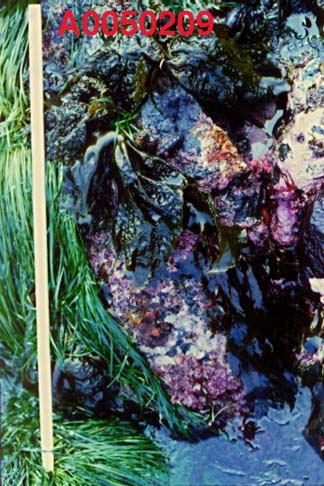
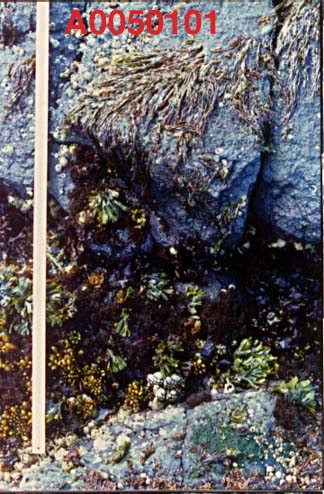
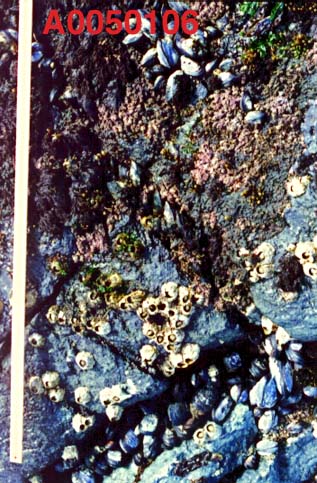
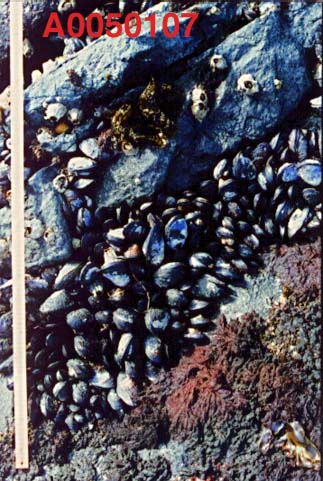
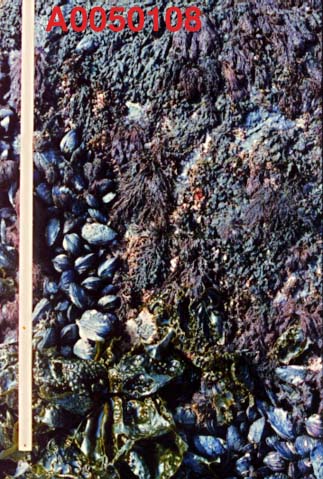
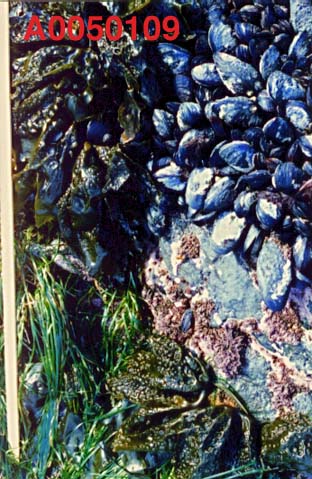
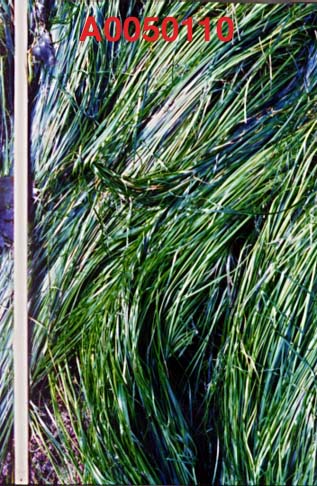
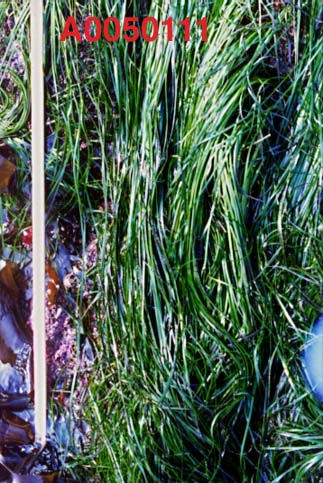
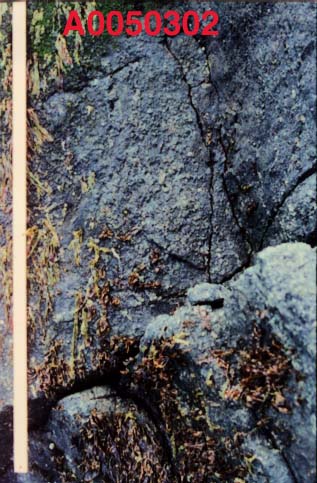
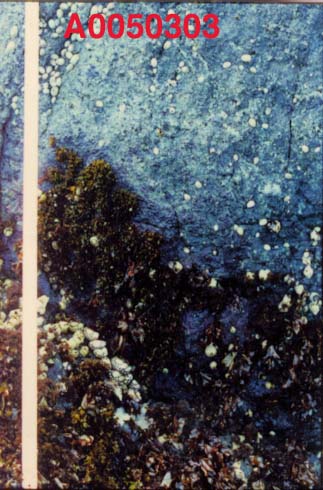
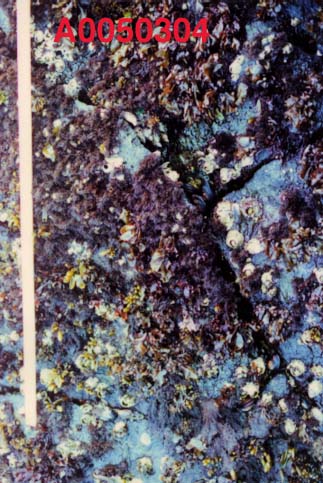
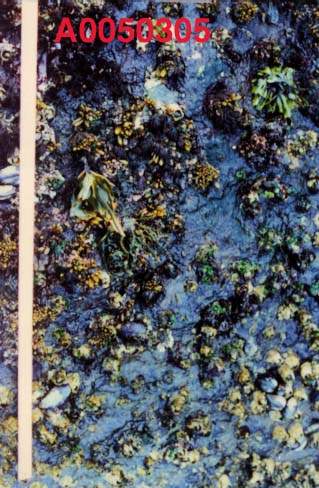
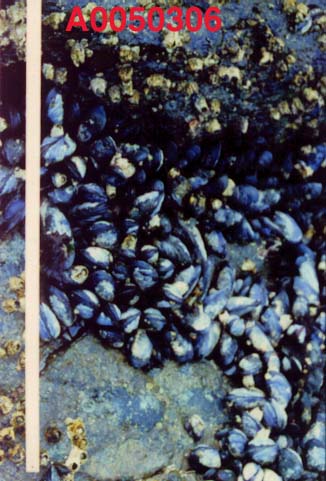
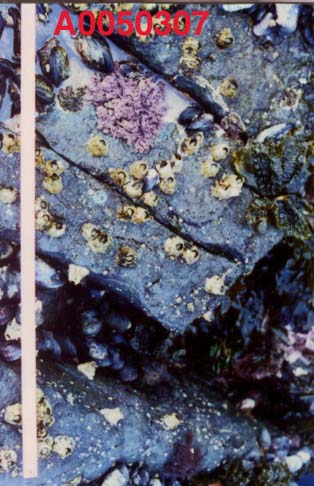
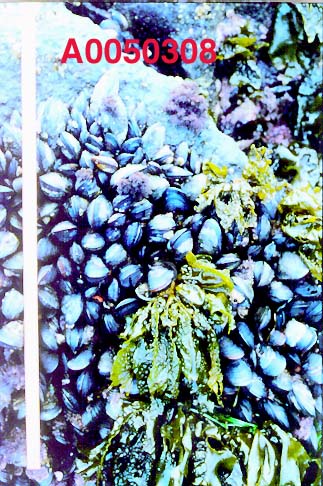
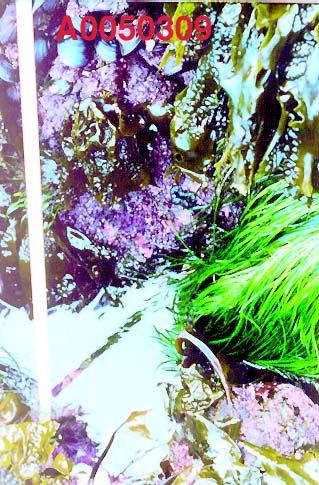
See Transect A0050101
See Transect A0050102
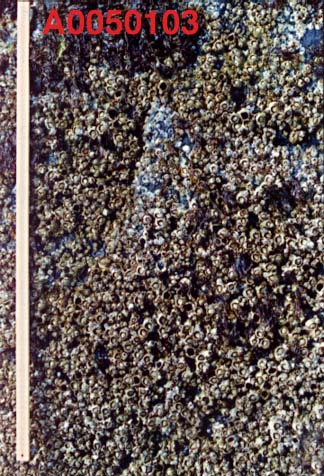
See Transect A0050103
BACKGROUND
The students and faculty of Lester B. Pearson College which is a member of the United World Colleges have used the ecological reserve and now the MPA of Race Rocks for studies of marine ecosystems, both sub-tidally and inter-tidally since1978. During that time a number of exercises have been developed to use in teaching ecological concepts in the International Baccalaureate Environmental Systems and Biology classes.
Transect Peg Locations on Race Rocks
Carmen’s Lab on Transects – kite Diagrams
1998 Class Photos and – Transects of Peg #`15
1999- Royal Roads Environmental management students visit Race Rocks
Underwater Transect at Race Rocks -Video
While using basic research techniques it has been possible to start to build up a library of information that can be more useful for determination of the effects of long term climatic changes or changes induced by humans, (anthropogenic). In addition this record may provide ideas to encourage others to apply the techniques to other ecosystems.
This program was developed at the 1995 BioQUEST Summer Workshop on Collaborative Learning, Peer Review, and Persuasion in Biology Education at Beloit College, WI. USA
See the following completed photographic transects:
See Transect A0050101
See Transect A0050102
See Transect A0050103
NUMBERING SYSTEM
A numbering system had to be developed that reflected the concept that this was only one of many that could be referenced from this site if individuals from around the world were willing to collaborate with us in building the project.
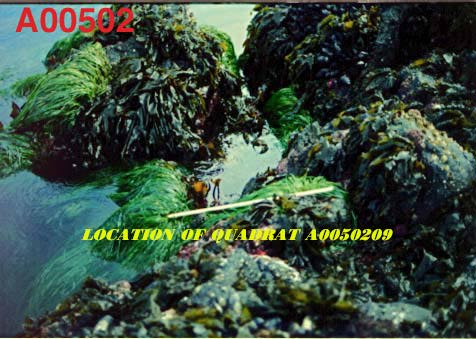
LOCATION….PEG NUMBER…TRANSECT NUMBER….QUADRAT NUMBER..
A0……..05…………01…………01………
Where:
| A0 | refers to the first site to be added to this WWW site |
| 05 | refers to the peg location ( we have 15 such locations permanently identified at the Race Rocks Ecological Reserve.) |
| 01 | refers to the first transect entered from this location. |
| 01 | refers to the first quadrat picture that you can access on this photographic strip. |
TIDAL LEVELS
Since the location of organisms in the intertidal zone is partially determined by tidal levels, that is one of the essential measurements given with our transect images. It is important to understand that the levels given here are based on the Canadian tide tables
Victoria Tide TablesThese are not calculated the same way as tables from the United States. To convert the elevations given here to conform to the US pattern in which 0.0 equals mean lower low water, subtract 0.8 meters from these Canadian readings.You may find further explanation on the operation of Tides in any marine biology or Oceanography text. One that may be useful is:
Seashore Life of the Northern Pacific Coast– by Eugene Kozloff, page 7-9.
For TIDAL Heights of Other LOCATIONS, use this link
SOME IDEAS FOR USE OF THESE TRANSECT PHOTOS
- Quantify the distribution of organisms
- Relate the distribution to the intertidal elevation
- Find out how to capture these images
- Use other technology to analyze the photos
- Study the mussels in greater depth
- Study other organisms from the transects in greater depth.
- Students in environmental systems will use this as a source to prepare for investigations in the intertidal zone when we have the opportunity to do a field lab at the ecological reserve. The photo strips also could be used by those living far from an ocean shore to study the relationship between abiotic or physical factors and organism distribution. Also by noting the location of certain species, for instance the mussels, M. californianus and then seeing where they would fit on a tidal level chart for the area (using the Victoria Tide Tables), students could calculate the length of times for submergence and emergence of the species in a week, a month, or a year. In addition they could compare the conditions in the winter months, with the extreme low tides occurring in the night with the conditions in the summer months when the low tides occur every two weeks in the daytime. Students should be encouraged to discuss the results of their investigations and pose further questions about conditions in the intertidal zone.
See Transect A0050101
See Transect A0050102
See Transect A0050103
THIS IS JUST A START!
By looking here you might get a few ideas of how you can do some interesting investigations using these pictures. But don’t stop there, we would like you to collaborate with us by adding ideas and new transects to our list. It would be excellent if someone living on another ocean shore with different intertidal zonation patterns could supply a similar set of photographs for comparison.Go back to techniques for directions on how to contribute
Transects on the west side of Race Rocks-2
LOCATION….PEG NUMBER…TRANSECT NUMBER….QUADRAT NUMBER..
A0………..05………….01……………01………
Where:
| A0 | refers to the first site to be added to this website |
| 05 | refers to the peg location ( we have 15 such locations permanently identified at the Race Rocks Ecological Reserve.) |
| 03 | refers to the third transect entered from this location. |
| 01 | refers to the first quadrat picture that you can access on this photographic strip. |
- Elevation 3.1 metres
- Elevation 2.9 metres
- Elevation 2.3metres
- Elevation 1.8 metres
- Elevation1.0 metres
- Elevation 0.6 metres
- Elevation 0.3 metres
- Elevation0.0 metres
- Elevation 0.0 metres
See Transect A0050101
See Transect A0050102
See Transect A0050103
_____________________________________________________________
Return to the Contents page for Environmental modelling with Transects..
Transects on the west side of Race Rocks-1
LOCATION….PEG NUMBER…TRANSECT NUMBER….QUADRAT NUMBER..
A0………..05………….01……………01………
Where:
| A0 | refers to the first site to be added to this website |
| 05 | refers to the peg location ( we have 15 such locations permanently identified at the Race Rocks Ecological Reserve.) |
| 03 | refers to the third transect entered from this location. |
| 01 | refers to the first quadrat picture that you can access on this photographic strip. |
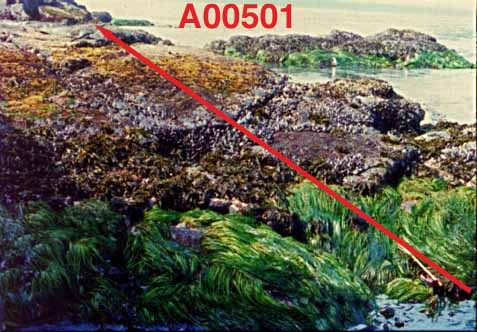 Transect A0050101
Elevation 3.7 metres
- Elevation 2.6 metres
- Elevation 2.3 metres
- Elevation 2.2 metres
- Elevation 1.9 metres
- Elevation 1.5 metres
- Elevation 1.2 metres
- Elevation 0.9 metres
- Elevation 1.1 metres
- Elevation 0.4 metres
- Elevation 1.1 metres
- Elevation0.0 metres
See Transect A0050101
See Transect A0050102
See Transect A0050103
Transects on the west side of Race Rocks-3
LOCATION….PEG NUMBER…TRANSECT NUMBER….QUADRAT NUMBER..
A0………..05………….01……………01………
Where:
| A0 | refers to the first site to be added to this website |
| 05 | refers to the peg location ( we have 15 such locations permanently identified at the Race Rocks Ecological Reserve.) |
| 03 | refers to the third transect entered from this location. |
| 01 | refers to the first quadrat picture that you can access on this photographic strip. |
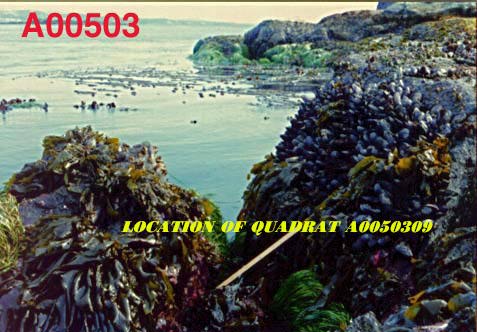
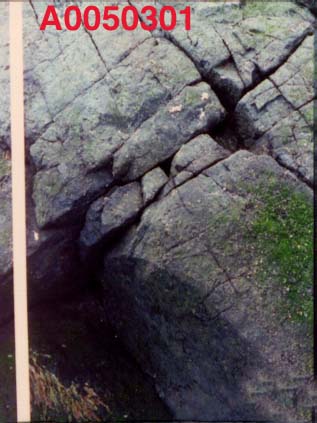
Transect A00503
Elevation 3.7 metres
- 2.3 metres
- 1.4 metres
- 0.0 metres
See Transect A0050101
See Transect A0050102
See Transect A0050103
Kalle Kallstrom’s extended essay on the Tidal Current meter
Race Rocks Sampling Programme
Long-term sampling programmes are often used to follow changes in the abundance of plants and animals over time. We will be looking at changes in the abundance of algae and invertebrates at Race Rocks. These changes will be examined with respect to changes in water temperature. The sampling method we will be using is called a stratified-random sample.
What is stratified random sampling?
In a stratified random sample we will sample the sea floor in a random manner, that is there will be no predetermined pattern to the sampling programme. The samples will be stratified because we will make sure that three depths are represented equally in our random samples.
What will we need?
Each dive pair will need
– a slate (with pencil)
– a pair of vernier calipers
– pre-mixed epoxy, and petersen discs
– a set of 20 random number
How will we sample?
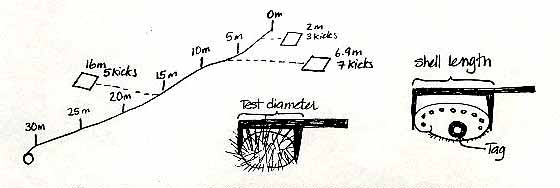
We have established 6 permanent transects around Race Rocks. Each transect is 30 metres long and runs from the shallow subtidal to about 10m depth. Once a dive pair has located the transect they will be working on, a tape measure will be tied to the shallowest pin (the 0 metre pin) and laid out down to the last pin (30 metre pin).
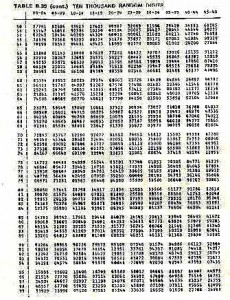
Before the dive, each dive pair will determine a set of 20 random numbers from a random number table (attached to these pages). There will be two numbers, both between 0 and 9. The first number will refer to the distance along the tape measure, let us say 6.9 metres (it will be the first two numbers, where-ever you start on the table, ie:69). The second number, let us say 7, will refer to the number of flipper kicks right or left of the line. The dive pair will swim along the tape locate the 6.9 mark, then left 7 kicks to the right or left of the 6.9 metre mark. After 7 kicks the diver drops the quadrat and starts to count all the invertebrates and seaweed in the quadrat.
While one diver does the counting and recording, the second diver will measure all of the sea urchins in the quadrat, recording the test diameter of each sea urchin to the nearest cm. Likewise the length of any abalone in the quadrat should also be measured, the abalone should also be tagged, using epoxy and a Petersen disc tag. The tag number should be recorded along with the length of the ablaone. Any abalone you see outside of the quadrat can also be measured and tagged.
Once the quadrat count and the measuring is completed, the dive pair returns to the tape measure, and repeats the process, using the next set of random numbers. In total divers will sample 20 quadrats between 0-10m (10 quadrats on the right side of the line, 10 quadrats on the left side), 20 quadrats between 10-20m and 20 quadrats between the 20-30m, for a total of 60 quadrats per transect. The transects will be sampled twice a year.
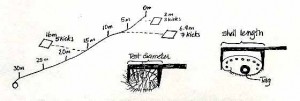 Once the dive pair has sampled 20 quadrats from between the 0-10 pins, they move down to the 10-20 metre pins and repeat the process, as time and air supply allow. If it is easier, three dive pairs can work on each transect line, one dive pair working in the 0-10m area, the next pair in the 10-20m area and the third pair in the 20-30m area. Dividing the transect into three areas is the stratified part of the sampling design, using the random number table is the random part of the sampling design.
Back at the College
Wash all the sampling gear you used with fresh water, and return to its appropriate place. Back in the lab you will need to wash the salt off your data sheet, and copy the sea urchin measurements and abalone tag/measurements onto the back of the data sheet for the section of the transect line you and your partner sampled. You will also need to make sure that all of your numbers are readable, and that you have filled in all of the blanks on the data sheet.
During later lab periods you will be entering this data, and calculating the average (mean) density of the animals and seaweed you counted along each transect line. Subsequent years of Pearson College students will continue this sampling programme to generate a long-term view of how invertebrate and algae abundance changes over time.
Temperature records.
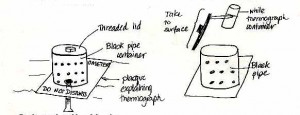 The Hobo thermograph that you will be installing, will automatically record water temperature. The temperatures are stored in the thermograph, and are down-loaded onto a programme that will be installed on the computers in the biology lab. The programme is very easy to use.
The thermograph will be installed in a black plastic pipe, bolted to the sea floor. The thermograph will be in a white water-tight container inside the pipe. To retrieve the thermograph divers will swim to the black pipe and using a filter wrench and a pipe wrench they will unscrew the lid on the black plastic pipe. Attached to the lid of the black plastic pipe, will be the white thermograph container. The divers bring the lid and the white thermograph container to the surface. DO NOT UNSCREW THE WHITE THERMOGRAPH CONTAINER UNDERWATER, THE COMPUTER INSIDE IT IS NOT WATER PROOF. THE THERMOGRAPH CAN ONLY BE REMOVED IN THE DRYNESS OF THE LAB.
Once the data have been down-loaded, the thermograph can be placed back in the white container, (the o-ring should be re-greased), the white container should be reattached the black lid, and on then the black re-screwed into the black pipe on the next dive. You will need to reset the thermograph right before you go diving.
Diagram of Hobo temperature apparatus appears here
Insert Random number table and data sheet.
Following is a page of random numbers, you should make sure that you are comfortable using this table. Likewise there is a data sheet, please make sure that you are familiar with the species listed on the data sheet, and that you will be able to identify them underwater.
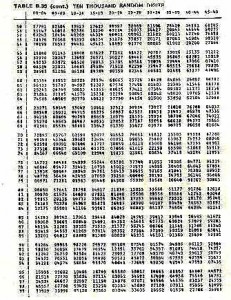 Random number table — 10,000 random numbers
27791 82504 33523
33147 46058 92388
67243 10545 40269
78176 70368 95523
70199 70547 94331
The first ten numbers in the last line are interpreted as: 7.0 m 1 kick, 9.9 m 7 kicks, 0.5 m 4 kicks, 7.9 m 4 kicks
TABLE B.39 (cont.) TEN THOUSAND RANDOM DIGITS
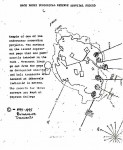
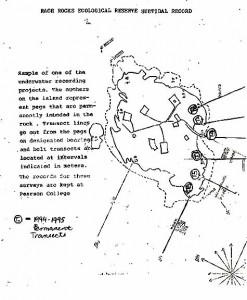 Sample of one of the underwater recording projects. The numbers on the island represent pegs that are permanently imbedded in the rock. Transect lines go out from the pegs on designated bearings and belt transects are located at intervals indicated in meters. The records for these surveys are kept at Pearson College.
T = 1994-1995 permanent transects
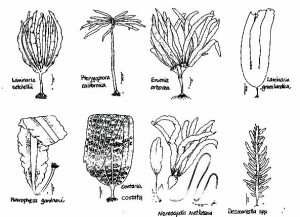 There will be other species of algae that we add to our list.
Sampling
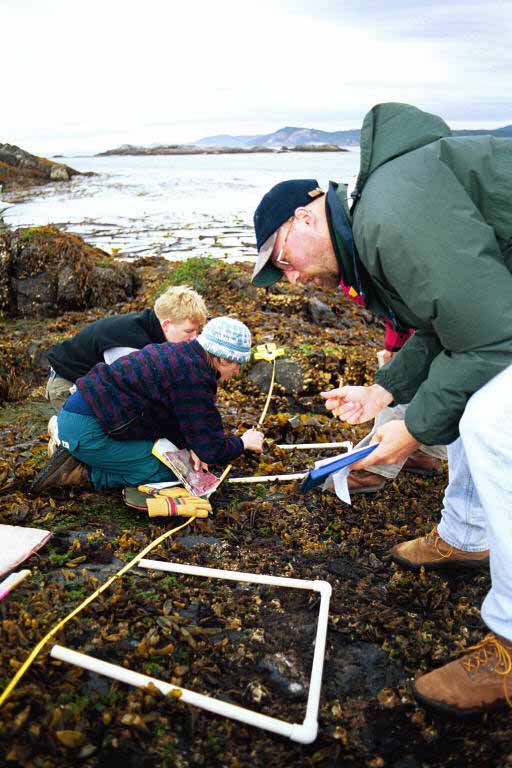
To sample the invertebrates at each of the permanently marked sites we will be using quadrats. Most of you will have done quadrat sampling before.
We will be using a random – sampling method, in which quadrats are placed randomly along / or near the transect line, and the selected invertebrates and algae in each quadrat will be counted. From these data we will calculate the mean (average) abundance as well as the variation in abundance that occurs at each site. These data will plotted in graphs which compare the abundance of each species over time, and with respect to changes in temperature.
We will go over the sampling methods prior to starting the project. Data will be recorded on data sheets pre-printed on underwater paper. An example of the type of data sheet we will be using is attached.
Race Rocks Long-Term Monitoring Programme
Dr. Jane Watson produced this report in the early 1980s.
What is the purpose of long-term monitoring projects?
Long-term monitoring projects are often used to follow changes in community composition or structure that occur over time. In this case you will be looking at natural changes in marine algae and invertebrate populations with respect to both long and short-term changes in water temperature.
How will this project be carried out?
You will be helping to establish the study sites which ultimately Pearson college will monitor two to three times a year. At least four of these sites will be at Race Rocks, others will be established at other sites that Pearson College divers visit regularly.
What will this involve?
Over the next three months we will be putting the permanently marked transects in. Once we have established all of the transects we will start to sample them. On each permanently marked transect Coast-watch divers will use randomly placed quadrats to estimate the abundance of selected invertebrates and algae.
In the lab the data will be entered and analyzed. These data should show how the abundance of many of many marine plants and animals change over time.
We will also be installing an underwater thermograph. This small instrument will record water temperature at predetermined intervals. Several times a year Pearson college divers will retrieve the instrument and down-load the data onto a computer. Changes in the composition of the marine community can then be examined with respect to mean temperatures, extreme temperatures and so on.
In addition to counting the abundance of marine invertebrates and algae, we will be tagging abalone, in an attempt to follow growth and mortality of individual abalone. We will also be measuring urchins which will allow us to follow changes in the population structure over time.
What will you need to know to sample these sites?
There are a number of plant and invertebrate species that you will need to be able to identify before we can sample the sites. You will also need to know how to sample using a quadrat, tag abalone and use vernier callipers… not exactly difficult stuff.
You will also need to know how to enter and analyze the data you collect. We will set things up so that this is straightforward. At the end of the school term you will be able to plot the mean abundance of the organisms we sample at all of our permanent transects. In subsequent years other Pearson College divers will continue to sample these sites.
Invertebrates
Phylum Echinodermata
Red urchin – Strongylocentrotus franciscanus
This is the most abundant of the urchins, it is unmistakable, being big and red. We will count the number of red urchins in each quadrat, as well as measuring the test diameter of the urchins. This will be done with vernier callipers. By measuring the size of the urchin tests we will be able to trace the settlement of new “recruits” and follow their growth.
Green urchin – S. droebachiensis
This is the smaller green urchin that is quite common in sheltered areas. We will count green urchins, but not measure them, unless they are very abundant at any of our sites.
Purple urchin – S. purpuratus
A small purple urchin that is generally found in the very shallow subtidal, and sometimes in the intertidal. If it occurs on any of our sites we will count them only.
Green urchins – S. droebachiensis
A small green urchin that is generally found in more sheltered waters, we will probably not encounter too many green urchins.
Giant sea cucumber – Parastichopus californicus
A large browny red sea cucumber, These are generally found in sheltered areas, or in water depths of greater than 10m. They are found on both hard and soft-bottoms.
Orange sea cucumber – Cucumaria miniata
This cucumber has a browny red body and bright orange tentacles. It is found in crevices wifli its tentacles extending beyond the crevice.
Sunflower star – Pycnopodia helianthoides
The largest of the sea stars, it can be up to lm in diameter, it comes in a variety of colours, usually orangy brown. It has up to 24 legs.
Leather star – Dermasterias imbricata
The leather star has a red back with greeny makings. It derives its name from its ieather-like texture. If you smell it (no not underwater) it has a gunpowder/garlic smell.
Beach star – Pisaster ochraceus
Yellow or purple, generally intertidal, but also found subtidally at some locations .
Painted star – Orthasterias khoeleri
Orange pink and purple, a very attractive sea star that occurs subtidally on rocky bottoms.
Blood star – Henticia spp.
This bright red, star is very common on both rocky and soft-bottomed areas.
Basket star – Gorganocephalus eucnemis
This species usually occurs in deep water, but Race Rocks is unique in having this species in shallow subtidal water.
Phylum Mollusca
Abalone – Haliotois kamtschatkana
The pinto abalone occurs from the lower intertidal to depths of about 10m. We will count, measure and tag all of the abalone we encounter. When tagged abalone are re-encountered they will be re-measured to follow growth in abalone.
Red turban snail – Astraea gibbersoa
A medium-sized snail that is very common on coralline algae. It has a hard operculum, and a shell that becomes covered with coralline algae.
Gumboot chiton – Cryptochiton stelleri
‘Ite largest chiton on our coast. You cannot see the 8 shell or plates that make up the gumboot chiton’s shell, they are hidden beneath the pinky brown tissue on the dorsal surface.
Cnidaria
Plumose anenome – Metridum senile
A very abundant bright white anenome, that does particularly well in high current areas. We will count anemones as we encounter them.
There will be other invertebrates added to this list once we determine which species are representative of the areas we are sampling.
Brown Algae
Kelps – Laminariales
 Bull kelp – Nereocystis luetkeana
Bull kelp is an annual species, it grows rapidly in areas that are highly disturbed. Bull kelp forms a floating canopy, it is very common at Race Rocks.
Tree kelp – Ptrerygophora californica
Tree kelp looks very much like a tree. It is a perennial species that lives in excess of 17 years. Pterygophora can be aged by cutting it down and counting the rings in its stalk or stipe. We will be tagging tree kelp on one of the transects at Race Rocks this will allow us to look at the persistence of tree kelp
Eisenia arborea
Eisenia looks very much Pterygophora, except that it has blades which are serrated at the edges, and the blades grow in two “bunches” at the top of the plant.
Laminafia setcheIlii
Laminaria groenlandica
These two species do not have a common name. Laminaria setchellii found in similar areas to Pterygophora, except that Laminaria setchellii is generally found in slightly more exposed areas.
Laminaria groenlandica is found in more sheltered areas. It looks quite different than Laminaria setchellii, since the two species are found in different areas you should have no trouble sorting them out.
Costaria costata
Costaria is really distinctive, it has three ribs on one side and two ribs on the other. It is generally an annual species but frequently manages to overwinter.
Acid weed – Desmarestia spp.
Acid weed is an annual species, which has a very “weedy” life history, it grows in highly disturbed areas, and is one of the first species to grow in areas that have been disturbed. It is very hard to count, because it forms a blanket over the sea floor, to count it you have to go down to the holdfast.
Pleurophycus gardneri
This species is generally found in very shallow areas in wave-washed areas. It is very distinctive.
There will be other species of algae that we add to our list.
SAMPLING
To sample the invertebrates at each of the permanently marked sites we will be using quadrats. Most of you will have done quadrat sampling before.
We will be using a random – sampling method, in which quadrats are placed randomly along / or near the transect line, and the selected invertebrates and algae in each quadrat will be counted. From these data we will calculate the mean (average) abundance as well as the variation in abundance that occurs at each site. These data will plotted in graphs which compare the abundance of each species over time, and with respect to changes in temperature.
We will go over the sampling methods prior to starting the project. All data will be recorded on data sheets pre-printed on underwater paper. An example of the type of data sheet we will be using is attached.
Race Rocks Long-Term Monitoring Program
What is the purpose of long-term monitoring projects?
Long-term monitoring projects are often used to follow changes in community composition or structure that occur over time. In this case you will be looking at natural changes in marine algae and invertebrate populations with respect to both long and short-term changes in water temperature.
How will this project be carried out?
You will be helping to establish the study sites which ultimately Pearson college will monitor two to three times a year. At least four of these sites will be at Race Rocks, others will be established at other sites that Pearson College divers visit regularly.
What will this involve?
Over the next three months we will be putting the permanently marked transects in. Once we have established all of the transects we will start to sample them. On each permanently marked transect Coast-watch divers will use randomly placed quadrats to estimate the abundance of selected invertebrates and algae.
In the lab the data will be entered and analyzed. These data should show how the abundance of many of many marine plants and animals change over time.
We will also be installing an underwater thermograph. This small instrument will record water temperature at predetermined intervals. Several times a year Pearson college divers will retrieve the instrument and down-load the data onto a computer. Changes in the composition of the marine community can then be examined with respect to mean temperatures, extreme temperatures and so on.
In addition to counting the abundance of marine invertebrates and algae, we will be tagging abalone, in an attempt to follow growth and mortality of individual abalone. We will also be measuring urchins which will allow us to follow changes in the population structure over time.
What will you need to know to sample these sites?
There are a number of plant and invertebrate species that you will need to be able to identify before we can sample the sites. You will also need to know how to sample using a quadrat, tag abalone and use vernier callipers… not exactly difficult stuff.
You will also need to know how to enter and analyze the data you collect. We will set things up so that this is straightforward. At the end of the school term you will be able to plot the mean abundance of the organisms we sample at all of our permanent transects. In subsequent years other Pearson College divers will continue to sample these sites.
Some species you will need to know
Invertebrates
Phylum Echinodermata
Red urchin – Strongylocentrotus franciscanus
This is the most abundant of the urchins, it is unmistakable, being big and red. We will count the number of red urchins in each quadrat, as well as measuring the test diameter of the urchins. This will be done with vernier callipers. By measuring the size of the urchin tests we will be able to trace the settlement of new “recruits” and follow their growth.
Green urchin – S. droebachiensis
This is the smaller green urchin that is quite common in sheltered areas. We will count green urchins, but not measure them, unless they are very abundant at any of our sites.
Purple urchin – S. purpuratus
A small purple urchin that is generally found in the very shallow subtidal, and sometimes in the intertidal. If it occurs on any of our sites we will count them only.
Green urchins – S. droebachiensis
A small green urchin that is generally found in more sheltered waters, we will probably not encounter too many green urchins.
Giant sea cucumber – Parastichopus californicus
A large browny red sea cucumber, These are generally found in sheltered areas, or in water depths of greater than 10m. They are found on both hard and soft-bottoms.
Orange sea cucumber – Cucumaria miniata
This cucumber has a browny red body and bright orange tentacles. It is found in crevices wifli its tentacles extending beyond the crevice.
Sunflower star – Pycnopodia helianthoides
The largest of the sea stars, it can be up to lm in diameter, it comes in a variety of colours, usually orangy brown. It has up to 24 legs.
Leather star – Dermasterias imbricata
The leather star has a red back with greeny makings. It derives its name from its ieather-like texture. If you smell it (no not underwater) it has a gunpowder/garlic smell.
Beach star – Pisaster ochraceus
Yellow or purple, generally intertidal, but also found subtidally at some locations .
Painted star – Orthasterias khoeleri
Orange pink and purple, a very attractive sea star that occurs subtidally on rocky bottoms.
Blood star – Henticia spp.
This bright red, star is very common on both rocky and soft-bottomed areas.
Basket star – Gorganocephalus eucnemis
This species usually occurs in deep water, but Race Rocks is unique in having this species in shallow subtidal water.
Phylum Mollusca
Abalone – Haliotois kamtschatkana
The pinto abalone occurs from the lower intertidal to depths of about 10m. We will count, measure and tag all of the abalone we encounter. When tagged abalone are re-encountered they will be re-measured to follow growth in abalone.
Red turban snail – Astraea gibbersoa
A medium-sized snail that is very common on coralline algae. It has a hard operculum, and a shell that becomes covered with coralline algae.
Gumboot chiton – Cryptochiton stelleri
‘Ite largest chiton on our coast. You cannot see the 8 shell or plates that make up the gumboot chiton’s shell, they are hidden beneath the pinky brown tissue on the dorsal surface.
Cnidaria
Plumose anenome – Metridum senile
A very abundant bright white anenome, that does particularly well in high current areas. We will count anemones as we encounter them.
There will be other invertebrates added to this list once we determine which species are representative of the areas we are sampling.
Brown Algae
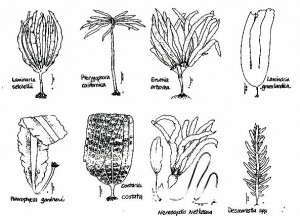 Kelps – Laminariales
Bull kelp – Nereocystis luetkeana
Bull kelp is an annual species, it grows rapidly in areas that are highly disturbed. Bull kelp forms a floating canopy, it is very common at Race Rocks.
Tree kelp – Ptrerygophora californica
Tree kelp looks very much like a tree. It is a perennial species that lives in excess of 17 years. Pterygophora can be aged by cutting it down and counting the rings in its stalk or stipe. We will be tagging tree kelp on one of the transects at Race Rocks this will allow us to look at the persistence of tree kelp
Eisenia arborea
Eisenia looks very much Pterygophora, except that it has blades which are serrated at the edges, and the blades grow in two “bunches” at the top of the plant.
Laminafia setcheIlii
Laminaria groenlandica
These two species do not have a common name. Laminaria setchellii found in similar areas to Pterygophora, except that Laminaria setchellii is generally found in slightly more exposed areas.
Laminaria groenlandica is found in more sheltered areas. It looks quite different than Laminaria setchellii, since the two species are found in different areas you should have no trouble sorting them out.
Costaria costata
Costaria is really distinctive, it has three ribs on one side and two ribs on the other. It is generally an annual species but frequently manages to overwinter.
Acid weed – Desmarestia spp.
Acid weed is an annual species, which has a very “weedy” life history, it grows in highly disturbed areas, and is one of the first species to grow in areas that have been disturbed. It is very hard to count, because it forms a blanket over the sea floor, to count it you have to go down to the holdfast.
Pleurophycus gardneri
This species is generally found in very shallow areas in wave-washed areas. It is very distinctive.
There will be other species of algae that we add to our list.
SAMPLING
To sample the invertebrates at each of the permanently marked sites we will be using quadrats. Most of you will have done quadrat sampling before.
We will be using a random – sampling method, in which quadrats are placed randomly along / or near the transect line, and the selected invertebrates and algae in each quadrat will be counted. From these data we will calculate the mean (average) abundance as well as the variation in abundance that occurs at each site. These data will plotted in graphs which compare the abundance of each species over time, and with respect to changes in temperature.
We will go over the sampling methods prior to starting the project. All data will be recorded on data sheets pre-printed on underwater paper. An example of the type of data sheet we will be using is attached.
Long-term sampling programmes are often used to follow changes in the abundance of plants and animals over time. We will be looking at changes in the abundance of algae and invertebrates at Race Rocks. These changes will be examined with respect to changes in water temperature. The sampling method we will be using is called a stratified-random sample.
What is stratified random sampling?
In a stratified random sample we will sample the sea floor in a random manner, that is there will be no predetermined pattern to the sampling programme. The samples will be stratified because we will make sure that three depths are represented equally in our random samples.
What will we need?
Each dive pair will need
– a 30m tape measure
– a 0.7m X 0.7m quadrat (0.5m squared)
– a clip board and data sheet (with pencil)
– a slate (with pencil)
– a pair of vernier calipers
– pre-mixed epoxy, and petersen discs
– a set of 20 random number
How will we sample?
We have established 6 permanent transects around Race Rocks. Each transect is 30 metres long and runs from the shallow subtidal to about 10m depth. Once a dive pair has located the transect they will be working on, a tape measure will be tied to the shallowest pin (the 0 metre pin) and laid out down to the last pin (30 metre pin).
Before the dive, each dive pair will determine a set of 20 random numbers from a random number table (attached to these pages). There will be two numbers, both between 0 and 9. The first number will refer to the distance along the tape measure, let us say 6.9 metres (it will be the first two numbers, where-ever you start on the table, ie:69). The second number, let us say 7, will refer to the number of flipper kicks right or left of the line. The dive pair will swim along the tape locate the 6.9 mark, then left 7 kicks to the right or left of the 6.9 metre mark. After 7 kicks the diver drops the quadrat and starts to count all the invertebrates and seaweed in the quadrat.
While one diver does the counting and recording, the second diver will measure all of the sea urchins in the quadrat, recording the test diameter of each sea urchin to the nearest cm. Likewise the length of any abalone in the quadrat should also be measured, the abalone should also be tagged, using epoxy and a Petersen disc tag. The tag number should be recorded along with the length of the ablaone. Any abalone you see outside of the quadrat can also be measured and tagged.
Once the quadrat count and the measuring is completed, the dive pair returns to the tape measure, and repeats the process, using the next set of random numbers. In total divers will sample 20 quadrats between 0-10m (10 quadrats on the right side of the line, 10 quadrats on the left side), 20 quadrats between 10-20m and 20 quadrats between the 20-30m, for a total of 60 quadrats per transect. The transects will be sampled twice a year.
Once the dive pair has sampled 20 quadrats from between the 0-10 pins, they move down to the 10-20 metre pins and repeat the process, as time and air supply allow. If it is easier, three dive pairs can work on each transect line, one dive pair working in the 0-10m area, the next pair in the 10-20m area and the third pair in the 20-30m area. Dividing the transect into three areas is the stratified part of the sampling design, using the random number table is the random part of the sampling design.
Back at the College
Wash all the sampling gear you used with fresh water, and return to its appropriate place. Back in the lab you will need to wash the salt off your data sheet, and copy the sea urchin measurements and abalone tag/measurements onto the back of the data sheet for the section of the transect line you and your partner sampled. You will also need to make sure that all of your numbers are readable, and that you have filled in all of the blanks on the data sheet.
During later lab periods you will be entering this data, and calculating the average (mean) density of the animals and seaweed you counted along each transect line. Subsequent years of Pearson College students will continue this sampling programme to generate a long-term view of how invertebrate and algae abundance changes over time.
Following is a page of random numbers, you should make sure that you are comfortable using this table. Likewise there is a data sheet, please make sure that you are familiar with the species listed on the data sheet, and that you will be able to identify them underwater.
Random number table — 10,000 random numbers
33147 46058 92388
67243 10545 40269
78176 70368 95523
70199 70547 94331
The first ten numbers in the last line are interpreted as: 7.0 m 1 kick, 9.9 m 7 kicks, 0.5 m 4 kicks, 7.9 m 4 kicks
TABLE B.39 (cont.) TEN THOUSAND RANDOM DIGITS
 Sample of one of the underwater recording projects. The numbers on the island represent pegs that are permanently imbedded in the rock. Transect lines go out from the pegs on designated bearings and belt transects are located at intervals indicated in meters. The records for these surveys are kept at Pearson College.
T = 1994-1995 permanent transects
 There will be other species of algae that we add to our list.
Sampling
To sample the invertebrates at each of the permanently marked sites we will be using quadrats. Most of you will have done quadrat sampling before.
We will be using a random – sampling method, in which quadrats are placed randomly along / or near the transect line, and the selected invertebrates and algae in each quadrat will be counted. From these data we will calculate the mean (average) abundance as well as the variation in abundance that occurs at each site. These data will plotted in graphs which compare the abundance of each species over time, and with respect to changes in temperature.
We will go over the sampling methods prior to starting the project. Data will be recorded on data sheets pre-printed on underwater paper.
Long-term sampling programmes are often used to follow changes in the abundance of plants and animals over time. We will be looking at changes in the abundance of algae and invertebrates at Race Rocks. These changes will be examined with respect to changes in water temperature. The sampling method we will be using is called a stratified-random sample.
What is stratified random sampling?
In a stratified random sample we will sample the sea floor in a random manner, that is there will be no predetermined pattern to the sampling programme. The samples will be stratified because we will make sure that three depths are represented equally in our random samples.
What will we need?
Each dive pair will need
– a 30m tape measure
– a 0.7m X 0.7m quadrat (0.5m squared)
– a clip board and data sheet (with pencil)
– a slate (with pencil)
– a pair of vernier calipers
– pre-mixed epoxy, and petersen discs
– a set of 20 random number
We have established 6 permanent transects around Race Rocks. Each transect is 30 metres long and runs from the shallow subtidal to about 10m depth. Once a dive pair has located the transect they will be working on, a tape measure will be tied to the shallowest pin (the 0 metre pin) and laid out down to the last pin (30 metre pin).
Before the dive, each dive pair will determine a set of 20 random numbers from a random number table (attached to these pages). There will be two numbers, both between 0 and 9. The first number will refer to the distance along the tape measure, let us say 6.9 metres (it will be the first two numbers, where-ever you start on the table, ie:69). The second number, let us say 7, will refer to the number of flipper kicks right or left of the line. The dive pair will swim along the tape locate the 6.9 mark, then left 7 kicks to the right or left of the 6.9 metre mark. After 7 kicks the diver drops the quadrat and starts to count all the invertebrates and seaweed in the quadrat.
While one diver does the counting and recording, the second diver will measure all of the sea urchins in the quadrat, recording the test diameter of each sea urchin to the nearest cm. Likewise the length of any abalone in the quadrat should also be measured, the abalone should also be tagged, using epoxy and a Petersen disc tag. The tag number should be recorded along with the length of the ablaone. Any abalone you see outside of the quadrat can also be measured and tagged.
Once the quadrat count and the measuring is completed, the dive pair returns to the tape measure, and repeats the process, using the next set of random numbers. In total divers will sample 20 quadrats between 0-10m (10 quadrats on the right side of the line, 10 quadrats on the left side), 20 quadrats between 10-20m and 20 quadrats between the 20-30m, for a total of 60 quadrats per transect. The transects will be sampled twice a year.
Once the dive pair has sampled 20 quadrats from between the 0-10 pins, they move down to the 10-20 metre pins and repeat the process, as time and air supply allow. If it is easier, three dive pairs can work on each transect line, one dive pair working in the 0-10m area, the next pair in the 10-20m area and the third pair in the 20-30m area. Dividing the transect into three areas is the stratified part of the sampling design, using the random number table is the random part of the sampling design.
Back at the College
Wash all the sampling gear you used with fresh water, and return to its appropriate place. Back in the lab you will need to wash the salt off your data sheet, and copy the sea urchin measurements and abalone tag/measurements onto the back of the data sheet for the section of the transect line you and your partner sampled. You will also need to make sure that all of your numbers are readable, and that you have filled in all of the blanks on the data sheet.
During later lab periods you will be entering this data, and calculating the average (mean) density of the animals and seaweed you counted along each transect line. Subsequent years of Pearson College students will continue this sampling programme to generate a long-term view of how invertebrate and algae abundance changes over time.
Insert Random number table and data sheet.
Following is a page of random numbers, you should make sure that you are comfortable using this table. Likewise there is a data sheet, please make sure that you are familiar with the species listed on the data sheet, and that you will be able to identify them underwater.
Random number table — 10,000 random numbers
27791 82504 33523
33147 46058 92388
67243 10545 40269
78176 70368 95523
70199 70547 94331
The first ten numbers in the last line are interpreted as: 7.0 m 1 kick, 9.9 m 7 kicks, 0.5 m 4 kicks, 7.9 m 4 kicks
TABLE B.39 (cont.) TEN THOUSAND RANDOM DIGITS
T = 1994-1995 permanent transects
There will be other species of algae that we add to our list.
Sampling
To sample the invertebrates at each of the permanently marked sites we will be using quadrats. Most of you will have done quadrat sampling before.
We will be using a random – sampling method, in which quadrats are placed randomly along / or near the transect line, and the selected invertebrates and algae in each quadrat will be counted. From these data we will calculate the mean (average) abundance as well as the variation in abundance that occurs at each site. These data will plotted in graphs which compare the abundance of each species over time, and with respect to changes in temperature.
We will go over the sampling methods prior to starting the project. Data will be recorded on data sheets pre-printed on underwater paper. An example of the type of data sheet we will be using is attached.
Jane Watson
Faculty of Science &Technology
900 fifth Street, Nanaimo,
British Columbia, Canada V9R 5S5
Tel (250) 741-2300 – Fox (250) 755-8749 http:llwww.mala.bc.cal

