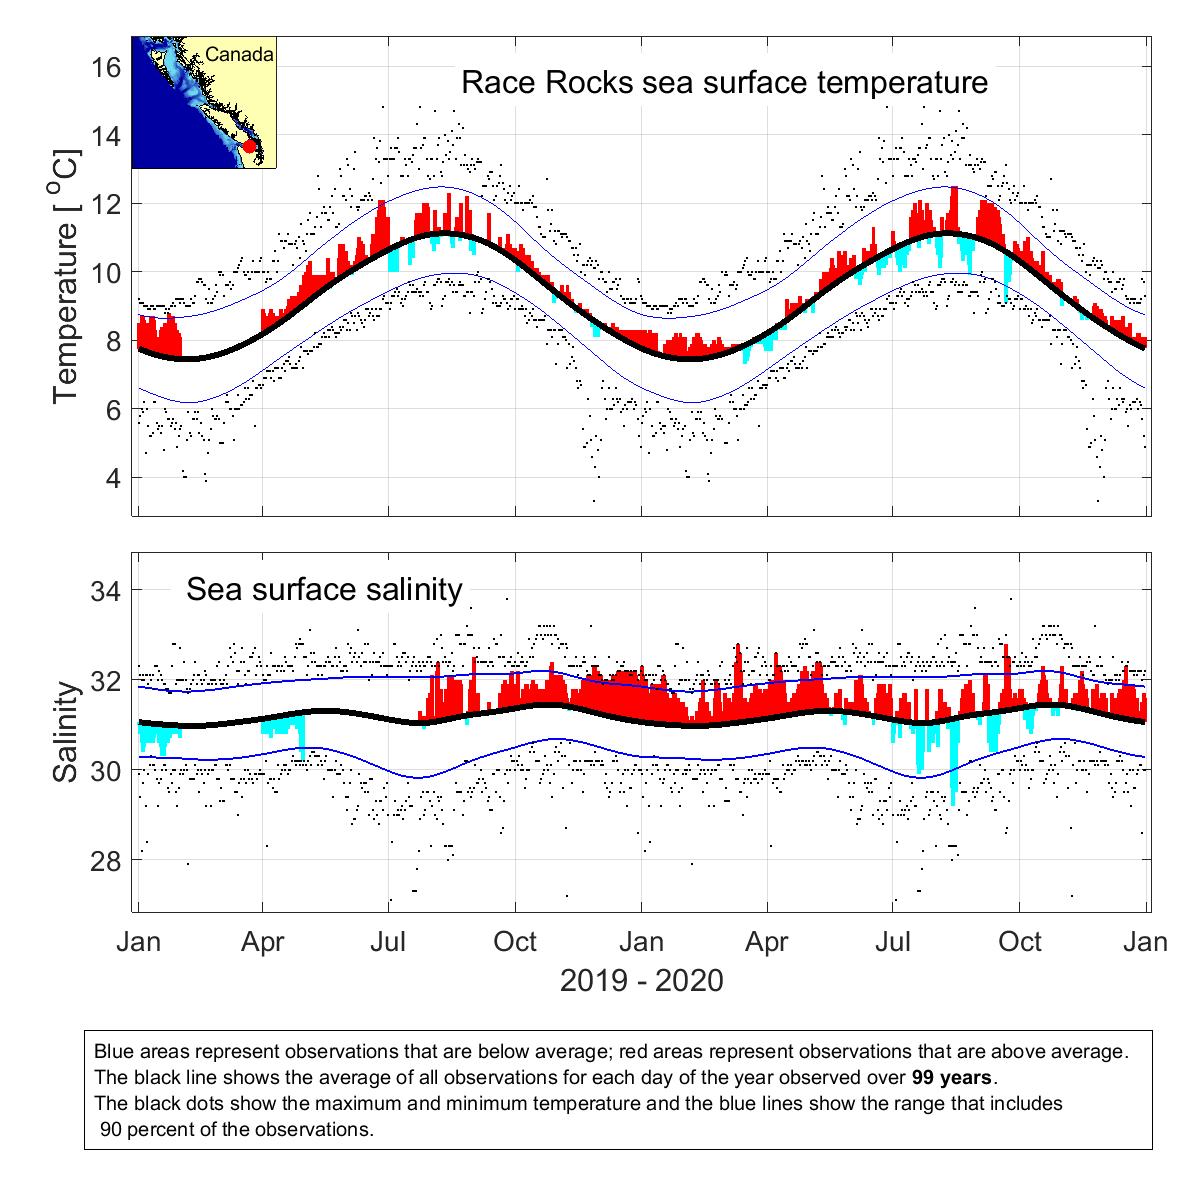
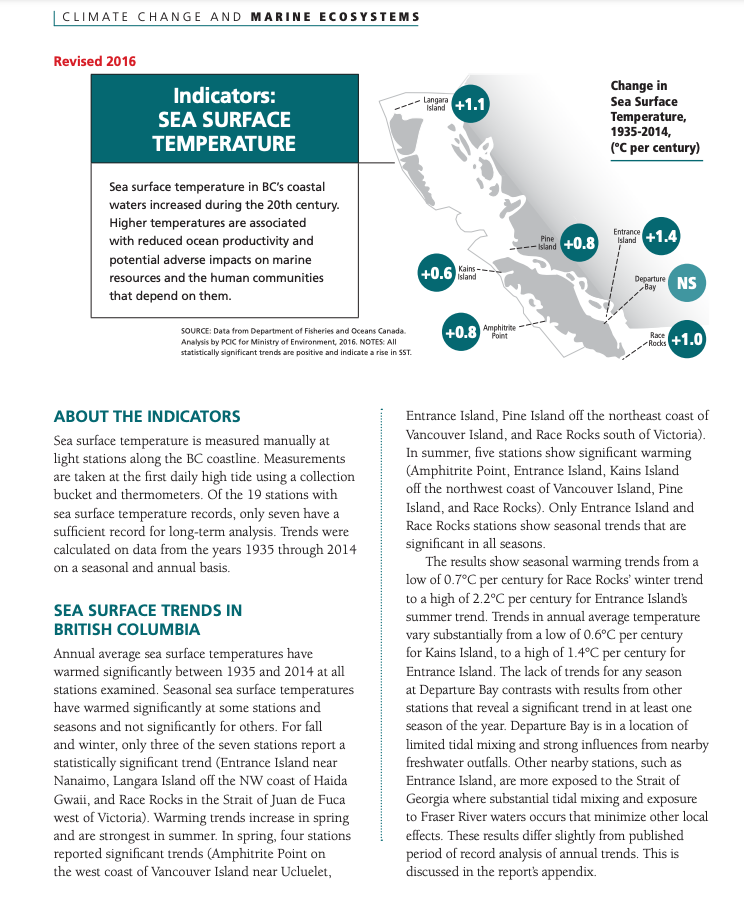
This graphic analysis was done by Peter Chandler of the Institute of Ocean Sciences.
Category Archives: Climate Change
Decade Comparisons:Sea Surface Temperature at Race Rocks-
Link to Race Rocks Mean Monthly Sea Temperature 1921-present,
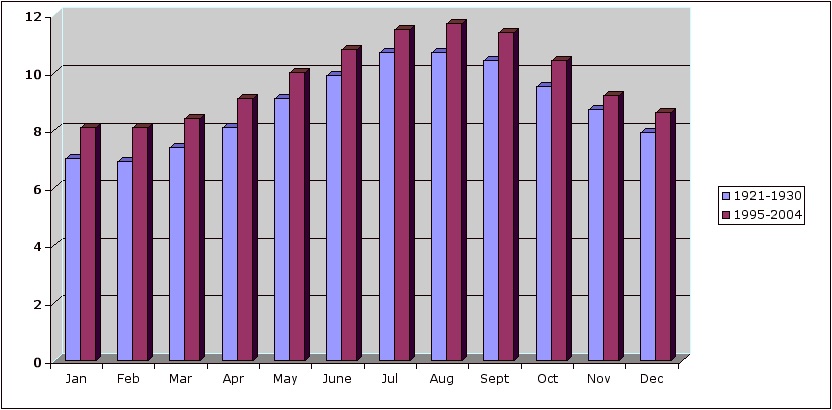
| Monthly temperature averages in degrees Celsius for Race Rocks | ||||||||||||
| 1921 | 1922 | 1923 | 1924 | 1925 | 1926 | 1927 | 1928 | 1929 | 1930 | Average | Month | |
| Jan | 6.4 | 7.1 | 7.1 | 6.6 | 7.8 | 7.6 | 6.9 | 7.1 | 6.5 | 7.0 | Jan | |
| Feb | 7.1 | 6.1 | 6.4 | 7.3 | 6.9 | 8 | 7.4 | 7.3 | 6.3 | 6.6 | 6.9 | Feb |
| Mar | 7.3 | 6.6 | 6.7 | 7.7 | 7.3 | 8.6 | 7.8 | 7.8 | 7.1 | 7.1 | 7.4 | Mar |
| Apr | 7.7 | 7.5 | 7.6 | 7.9 | 8 | 9.2 | 8 | 8.6 | 7.8 | 8.2 | 8.1 | Apr |
| May | 8.5 | 8.3 | 8.6 | 9 | 9.2 | 10.1 | 8.8 | 9.7 | 9 | 9.3 | 9.1 | May |
| June | 9.5 | 9.5 | 9.3 | 9.8 | 10.1 | 10.7 | 9.8 | 10.2 | 9.8 | 10 | 9.9 | June |
| Jul | 10.3 | 10.5 | 10.3 | 10.5 | 11.1 | 11.1 | 10.5 | 10.8 | 10.8 | 10.6 | 10.7 | Jul |
| Aug | 10.5 | 10.3 | 10.5 | 10.3 | 10.8 | 10.9 | 10.9 | 10.9 | 10.8 | 10.8 | 10.7 | Aug |
| Sept | 10.3 | 10.2 | 10.6 | 10.2 | 10.2 | 10.5 | 10.3 | 10.3 | 10.7 | 10.6 | 10.4 | Sept |
| Oct | 9.8 | 9.3 | 9.6 | 9.2 | 9.2 | 9.8 | 9.7 | 9.2 | 9.8 | 9.4 | 9.5 | Oct |
| Nov | 9.1 | 8.4 | 8.7 | 8.8 | 8.3 | 9.1 | 8.6 | 8.6 | 8.8 | 8.6 | 8.7 | Nov |
| Dec | 8.2 | 7.1 | 7.9 | 7.3 | 8.2 | 8.5 | 7.6 | 7.9 | 7.8 | 8 | 7.9 | Dec |
| 8.8 | Decade average |
|||||||||||
| Average | ||||||||||||
| 1995 | 1996 | 1997 | 1998 | 1999 | 2000 | 2001 | 2002 | 2003 | 2004 | |||
| Jan | 8.2 | 8.2 | 7.7 | 8.7 | 8 | 7.5 | 7.9 | 8.1 | 8.8 | 7.8 | 8.1 | Jan |
| Feb | 8.6 | 7.8 | 7.9 | 9.2 | 7.8 | 7.7 | 7.7 | 7.9 | 8.5 | 7.9 | 8.1 | Feb |
| Mar | 8.8 | 8.4 | 8.1 | 9.7 | 8.1 | 8.1 | 8.1 | 7.7 | 8.7 | 8.3 | 8.4 | Feb |
| Apr | 9.2 | 9.2 | 9 | 9.9 | 8.9 | 9.1 | 8.7 | 8.7 | 9.2 | 9.1 | 9.1 | Apr |
| May | 10.2 | 10 | 10.3 | 10.4 | 9.5 | 10 | 9.7 | 9.4 | 9.9 | 10.4 | 10.0 | May |
| June | 11.2 | 10.4 | 10.9 | 11.4 | 10.4 | 11.1 | 10.6 | 10.5 | 10.9 | 11 | 10.8 | June |
| Jul | 11.8 | 11.5 | 11.7 | 11.7 | 11.1 | 11.3 | 11.3 | 11.2 | 11.3 | 11.8 | 11.5 | Jul |
| Aug | 11.5 | 11.5 | 12.2 | 12.3 | 11.5 | 11.7 | 11.4 | 11.7 | 11.4 | 11.9 | 11.7 | Aug |
| Sept | 11.3 | 10.5 | 11.6 | 12.1 | 11.9 | 11.4 | 11.4 | 11.3 | 11.4 | 11.2 | 11.4 | Sept |
| Oct | 10.2 | 9.9 | 11.3 | 10.7 | 10.1 | 10.3 | 10.2 | 10 | 10.9 | 10.6 | 10.4 | Oct |
| Nov | 9.4 | 8.7 | 9.9 | 9.8 | 9 | 9 | 9.2 | 9 | 9 | 9.4 | 9.2 | Nov |
| Dec | 8.9 | 7.6 | 9.3 | 9 | 8.5 | 8 | 8.3 | 8.8 | 8.5 | 8.6 | 8.6 | Dec |
| 9.8 | Decade Average |
|||||||||||
| This analysis has been done by Garry Fletcher using the monthly averages of the daily temperatures. See this file for the complete set of monthly data1921 to present |
 |
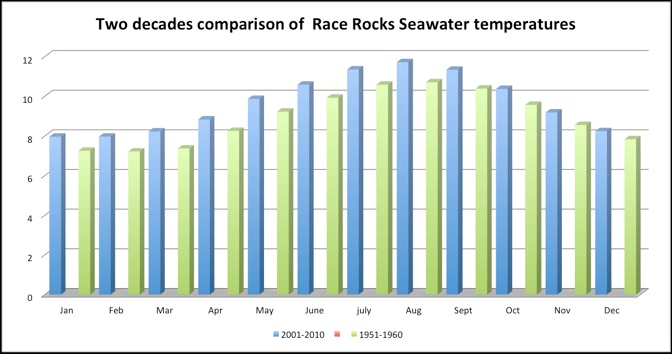
| The following is a comparison between 1951-1960 and 2001-2010
Jan Feb Mar Apr May Jun Jul Aug Sept Oct Nov Dec 2001 7.9 7.7 8.1 8.7 9.7 10.6 11.3 11.4 11.4 10.2 9.2 8.3 Monthly Means
|
See also https://www.env.gov.bc.ca/soe/indicators/climate-change/sea-surface-temperature.html
Sea Surface temperature as Indicators of Climate change
Temperature Changes Through Time
PROCEDURE:
1. Describe how this set of sea-water temperature records have been obtained. This file provides examples of the records which have been submitted to The Institute of Ocean Sciences at Sidney, Vancouver Island.
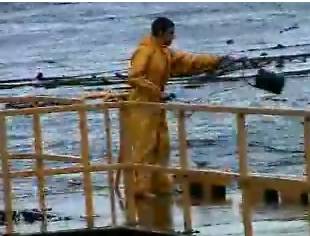
daily duties video
The students from Lester Pearson College often stay at the island and take over the daily duties such as the water sampling for temperature and salinity. This video shows the process used in the manual determination of these factors.
IOS
When the records have been submitted, they are added to a database which is maintained by the Institute of Ocean Sciences. This link shows historic sets of raw data from IOS for the British Columbia Light Stations.
2. Go to this file to obtain the Race Rocks Mean Monthly Sea Temperature 1921-present,
a) open an excel workbook and save it as “Temperature records at Race Rocks. We will copy the data for the first ten years of the record and the last ten years of the record to an empty Excel file.
b) Highlight years 1921 to 1930 from the data, copy and paste to the open Excel file.
c) Cut out each year and paste it side by side so that you have the rows representing the months and the columns representing the years. Make a horizontal table of the data
d) highlight across the able, the temperatures for each month of the ten year group. Then click on the symbol in the menu line which produces an average. This average will appear to the right of the last years column.
e) Do the same with the last ten years set of data. You now have two sets of averages by month of the two decades.
f) Compare the monthly averages for the two decades. What do you find?
3. There are of course many ways of looking at this data. Try summing the total averages for each decade. Simply highlight the column of averages and click on the tool for SUM. What is your finding.
4. You could also do the same for all the decades.Once you have a chart made up of the monthly averages of all the decades, It is easy to have Excel draw a graph for you. Click on the Wizard symbol and choose the type of graph.
5. After manipulating the data, and looking at it in several ways, write a statement which expresses your understanding of the whether or not there has been a temperature change in the Strait of Juan de Fuca as measured by daily samples taken at Race Rocks. Be sure that you do not generalize beyond the evidence provided by your data. Also discuss the assumptions that you must recognize before drawing a conclusion from this data.
6. For Extension work: Run a statistical program to determine if the difference you find is significant.
7. For Extension work: Read the review below and if possible, read the book! Present a summary to your class.
The long-term Sea temperature record at Race Rocks has been pointed out as one of the pieces of evidence that has accumulated on global warming. Author Terry Glavin, in reviewing the book The Weather Makers by Tim Flannery ( Harper Collins Publishers, 2006) says :
” The Pacific Ocean itself is getting warmer. Measurements at the Race Rocks lighthouse near Victoria show an average rise in temperature of 1°C since 1921, which doesn’t sound like much until you remember that its only 10°C in the other direction that separates us from the deep freeze of the Ice Age. The ocean, absorbing increasing volumes of carbon dioxide, is becoming more acidic, too, inhibiting the production of plankton, the basis of all life in the sea.”
The rest of the article may be seen at http://www.straight.com/content.cfm?id=17132
8. Refer to the file: Sea Temperature as an abiotic factor .
castSeveral ideas are discussed in this file about how the sea water temperature affects marine organisms. Discuss how organisms adapt to changes in sea temperature.
9. Extension: Find out the monthly water temperature averages from your own area. Compare them with Race Rocks and discuss the geoclimatic factors which lead to the similarities and or the differences, and the implications for organisms living in the two ecosystems.
Temperature Changes Through Time
| BACKGROUND: With so much information in the media about Climate Change, it is important to be able to sort out and analyze the evidence first hand. From 1921 until the present, records of temperature of the sea water have been taken daily at Race Rocks. The question is, do we have evidence of an increase in ocean temperature over this time period? | |||||||||||||||||||||||
| OBJECTIVES: After doing this assignments, you will be able to: a) Comment on the importance of maintaining a database of environmental factors over time.b) Compare the monthly temperature averages for the decade of the 1920’s with the last decade c) Examine data temperature records and determine if there is evidence of a change through time..d) Evaluate temperature change through time as an abiotic factor that affects the biodiversity of organisms in an ecosystem.e) Account for the geoclimatic reasons for similarities and differences of water temperatures, and indicate the implications for organisms living in these ecosystems.
|
|||||||||||||||||||||||
See
|
|||||||||||||||||||||||
See also https://racerocks.ca/category/education/climate-change/