Stylaster parageus columbiensis- Lindner & Cairns in Cairns & Lindner, 2011

Record in the Smithsonian Institute, from : http://collections.si.edu/search/record/nmnhinvertebratezoology_910698?q=set_name:%22Invertebrate+Zoology%22

Stylaster parageus columbiensis Lindner & Cairns  (**in Cairns & Lindner, 2011)

Paratype for Stylaster parageus columbiensis Lindner & Cairns in Cairns & Lindner, 2011
Catalog Number: USNM 1096625
Collection: Smithsonian Institution, National Museum of Natural History, Department of Invertebrate Zoology

Microhabitat Description:
shallow water
Collector:
Dr. Alberto Lindner
Ocean/Sea/Gulf:
North Pacific Ocean
Preparation: Dry
  • Sex: male
  • Type Status: Paratype
Place:
Strait of Juan de Fuca, Race Rocks near Sooke Community, British Columbia, Canada, North Pacific Ocean
Collection Date:
Jul 2002
Common name:
Hydrozoans
Taxonomy:
Animalia ,
Cnidaria ,
Hydrozoa,
Anthoathecatae
Stylasteridae
Published Name:
Stylaster parageus columbiensis Lindner & Cairns in Cairns & Lindner, 2011
Stylaster campylecus parageus (Fisher, 1938)
Stylaster sp.
Stylaster parageus (Fisher, 1938)
USNM Number:
1096625
Specimen Count:
1
Site Number:
AL 470
Record Last Modified:
17 Jul 2013
See more items in:
Invertebrate Zoology
Data Source:
NMNH – Invertebrate Zoology Dept.
Visitor Tag(s):
**Paratype: Cairns, S. D. & Lindner, A. 2011. A Revision of the Stylasteridae (Cnidaria, Hydrozoa, Filifera) from Alaska and Adjacent Waters. Zookeys. 158: 1-88.

See the entry of the Race Rocks Taxonomy

Tidal Current Energy Experiment Comes to an End.

September 17, 2011: Clean Current Staff and diving contractors return to Race Rocks to remove the generator for the last time. The generator returns to Vancouver for a final analysis of structural details after exposure in the ocean over the last three years . After cleaning,  it is to be sent to the Museum of Science and Technology in Ottawa, since it was the first ocean tidal generator to be built and deployed in Canada.

“In conclusion: The Tidal Current Generator operation over the past six years has been an interesting experiment and a good demonstration of the potential power from tidal energy.  The added value to the availability of energy for Race Rocks  was however very disappointing.

The main value to the Race Rocks program has been in the infrastructure that has been developed and installed and the potential for further research. The provision now of most of the energy needs by solar power was only made possible by the large bank of storage batteries provided by the project, the island energy building electrical infrastructure and the partnership with the BC Ministry of Mines and energy which were instrumental in providing the initial solar panels.  Installation of further solar panels and upgrades by Lester Pearson College UWC has helped to ensure energy sustainability for Race Rocks.

–Garry Fletcher


Race Rocks (XwaYeN) Proposed Marine Protected Area Ecosystem Overview and Assessment Report

Correct citation for this publication: Backe, N., S. Davies, K. Conley, G. Kosmider, G. Rasmussen, H. Ibey and K. Ladell.2011. Race rocks (XwaYeN) proposed marine protected area ecosystem overview and assessment report. Can. Manuscr. Rep. Fish. Aquat. Sci. 2949: ii + 30
Executive Summary
Background
Race Rocks (XwaYeN), located 17 km southwest of Victoria in the Strait of Juan de Fuca, consists of nine islets, including the large main island, Great Race. Named for its strong tidal currents and rocky reefs, the waters surrounding Race Rocks (XwaYeN) are a showcase for Pacific marine life. This marine life is the result of oceanographic conditions supplying the Race Rocks (XwaYeN) area with a generous stream of nutrients and high levels of dissolved oxygen. These factors contribute to the creation of an ecosystem of high biodiversity and biological productivity.In 1980, the province of British Columbia, under the authority of the provincial Ecological Reserves Act , established the Race Rocks Ecological Reserve. This provided protection of the terrestrial natural and cultural heritage values (nine islets) and of the ocean seabed (to the 20 fathoms/36.6 meter contour line). Ocean dumping, dredging and the extraction of non-renewable resources are not permitted within the boundaries of the Ecological Reserve. However, the Ecological Reserve cannot provide for the conservation and protection of the water column or for the living resources inhabiting the coastal waters surrounding Race Rocks (Xwa YeN) as these resources are under the jurisdiction of Fisheries and Oceans Canada (DFO). The federal government, through the authority of theOceans Act (1997), has established an Oceans Strategy, based on the principles of sustainable development, integrated management and the precautionary approach. Part II of the Oceans Act also provides authority for the development of tools nece ssary to carry out the Oceans Strategy, tools such as the establishment of Marine Protecte d Areas (MPA). This federal authority will complement the previously established protection to the area as an Ecological Reserve, by affording protection and conservation measures to the living marine resources. Under Section 35 of the Oceans Act, the Governor in Council is authorized to designate, by regulation, Marine Protected Areas (MPA) for any of the following reasons:

  • (a) the conservation and protection of commercial and non-commercial fishery resources, including marine mammals and their habitats;
  • (b) the conservation and protection of endangered or threatened species and their habitats;
  • (c) the conservation and protection of unique habitats;
  • (d) the conservation and protection of marine areas of high biodiversity or biological productivity; and
  • (e) the conservation and protection of any other marine resource or habitat as is necessary to fulfill the mandate of the Minister of Fisheries and Oceans.

In 1998, the Minister of Fisheries and Oceans announced Race Rocks (XwaYeN) as one of four pilot Marine Protected Area (MPA) initiatives on Canada’s Pacific Coast. Race Rocks (XwaYeN) meets the criteria set out in paragraphs 35(1) (a), (b) and (d) above. Establishing a MPA within the Race Rocks (XwaYeN) area will provide for a more comprehensive level of conservation and protection for the ecosystem than can be achieved by an Ecological Reserve on its own. Designating a MPA within the area encompassing the Ecological Reserve will facilitate the integration of conservation, protection and management initiatives under the respective authorities of the two governments.

physical and biological systems of Race Rocks (XwaYeN) was completed by Wright and Pringle (2001). The 2001 report provides an extensive ecological overview describing the geological, physical oceanographic and biological components of
Race Rocks (XwaYeN) and the surrounding waters of the Strait of Juan de Fuca at the time. Natural history observations and some traditional knowledge were also included. The following report is a brief update to summarize new information that has been collected in the Race Rocks (XwaYeN) area since that time and describe any changes
to trends in species distributions and oceanographic conditions. This work is meant to supplement the existing ecological overview (Wright and Pringle 2001).

See the full 32 page PDF  Ecosystem overview2011

Race Rocks Mean Monthly Sea Temperature 1921-present,

Seawater Temperature: Race Rocks
Decade Comparisons:Sea Surface Temperature at Race Rocks-
 

Year Jan Feb Mar Apr May Jun Jul Aug Sep Oct Nov Dec
1921 7.1 7.3 7.7 8.5 9.5 10.3 10.5 10.3 9.8 9.1 8.2
1922 6.4 6.1 6.6 7.5 8.3 9.5 10.5 10.3 10.2 9.3 8.4 7.1
1923 7.1 6.4 6.7 7.6 8.6 9.3 10.3 10.5 10.6 9.6 8.7 7.9
1924 7.1 7.3 7.7 7.9 9 9.8 10.5 10.3 10.2 9.2 8.8 7.3
1925 6.6 6.9 7.3 8 9.2 10.1 11.1 10.8 10.2 9.2 8.3 8.2
1926 7.8 8 8.6 9.2 10.1 10.7 11.1 10.9 10.5 9.8 9.1 8.5
1927 7.6 7.4 7.8 8 8.8 9.8 10.5 10.9 10.3 9.7 8.6 7.6
1928 6.9 7.3 7.8 8.6 9.7 10.2 10.8 10.9 10.3 9.2 8.6 7.9
1929 7.1 6.3 7.1 7.8 9 9.8 10.8 10.8 10.7 9.8 8.8 7.8
1930 6.5 6.6 7.1 8.2 9.3 10 10.6 10.8 10.6 9.4 8.6 8
1931 7.8 7.8 8.2 8.8 9.9 10.6 11.5 11.1 10.7 9.6 8.6 7.7
1932 7.1 6.8 7.3 8.2 9.3 10.4 10.8 10.9 10.7 9.6 8.9 7.7
1933 7.1 6.7 7.1 8 9.1 10.2 10.5 11.5 10.1 9.6 8.6 7.7
1934 7.8 7.9 8.3 9.2 10 10.8 10.9 11.6 10.7 9.7 9.2 8.4
1935 7.2 7.2 7.5 7.8 9.2 10.1 10.5 10.5 10.7 9.7 8.2 8.1
1936 7.9 6.7 7 7.8 9.3 10.4 11.3 11.3 10.5 10.1 8.6 7.9
1937 6.6 6.4 7.7 8.7 9.9 10.9 11.7 11.5 10.9 9.9 8.5 8.1
1938 7.4 7.2 8.1 9.4 10.6 12.3 12.7 11.9 11 9.9 8.6 7.5
1939 7.4 6.6 7.1 8.6 10.3 11.4 12.2 11.1 11.4 9.7 8.5
1940 7.9 8.2 9 10 11.4 11.6
1941 10 10.5 11.2 11 10.6 9.9 9 8.5
1942 7.9 7.9 7.8 8.5 9.6 9.8 10.5 11 10.3 9.5 8.4 7.9
1943 6.8 6.7 7.1 8.2 8.8 10 10.3 10.6 10.3 9.6 9 8.1
1944 7.7 7.5 7.3 8 9.2 10.5 11 10.9 10.5 9.6 9.2 8.1
1945 7.8 7.7 7.6 8 8.8 9.8 10.1 10.5 10 9.5 8.1 8.1
1946 7.7 7.3 7.7 8.1 9.4 10.2 10.7 10.8 10.3 9.4 8.1 7.7
1947 7.1 7 7.7 8.4 9.5 10.4 10.6 10.9 10.5 9.9 9.1 7.9
1948 7.5 6.9 7.2 7.9 9 10.2 10.8 10.7 10.4 9.5 8.2 7
1949 6.1 6.1 6.9 8.3 9.4 10.1 10.3 10.2 10.5 9.5 8.7 7.8
1950 6.2 5.8 6.6 7.7 8.7 9.4 10.1 10.4 10.3 9.3 8.5 8
1951 7.5 6.9 6.7 8.1 9.2 10.2 10.4 11.1 10.9 9.5 8.5 7.7
1952 6.9 7.1 7.6 8.2 9 9.6 10.4 10.5 10.2 9.8 8.6 7.9
1953 7.8 7.9 7.6 8.1 9.3 9.8 10.6 11 10.6 9.9 9.3 8.5
1954 7.1 7.3 7.5 7.9 8.7 9.3 9.9 10 10 9.4 9.1 8.4
1955 7.5 7.1 6.7 7.5 8.4 9.3 9.8 10.2 10 8.9 7.5 6.6
1956 6.7 6.4 6.3 7.6 8.7 9.6 10.2 10.4 10.1 9.2 8.1 7.1
1957 6.3 6.2 7.2 8.1 9.3 10 10.3 10.5 10.5 9.8 8.8 8.3
1958 8 8.3 8.6 9.3 10.3 10.7 11.5 11.5 11 9.9 8.7 8.1
1959 7.6 7.4 7.9 9.1 9.7 10.4 11.3 11 10.4 9.7 8.3 7.8
1960 7.1 7.5 7.5 8.6 9.6 10.3 11.4 10.8 10.1 9.5 8.6 7.9
1961 7.9 8.2 8.4 8.8 9.4 10.3 10.9 11.3 10.6 9.4 8.2 7.5
1962 7.2 7.3 7.3 8.4 9.3 10 10.4 10.5 10.5 10 9.3 8.7
1963 7.5 7.5 7.8 8.5 9.6 10.2 10.5 10.8 10.6 10.3 9.9 8.7
1964 8.2 7.9 7.7 8.2 8.8 9.6 10.3 10.5 10 9.4 8.3 7.4
1965 6.9 7.1 7.2 8 8.8 9.8 10 10.2 10.3 9.7 9.2 8.5
1966 7.7 7.6 7.7 8.5 9 9.1 99.9 10.7 10.1 9.5 8.7 8.6
1967 7.9 7.7 7.6 8.1 8.9 9.6 10.3 10.5 10.5 9.7 9.1 8
1968 7.3 7.3 8 8.3 8.7 9.5 10.2 10.2 10.4 9.3 8.8 7.8
1969 6.5 6.3 7.2 8.1 9.1 10.2 10.4 10.5 9.8 9.2 8.7 8.1
1970 7.5 7.7 7.9 8 8.7 9.6 10.2 10.2 10 9 8.3 7.5
1971 7 6.9 6.7 7.5 8.5 9.1 10 10.6 10.4 9.3 8.3 7.3
1972 6.4 6.2 6.9 7.6 8.8 9.5 10.5 10.6 10.2 9.1 8.4 7.3
1973 7 7.2 7.9 8.4 8.6 9.2 10.1 10.3 10 9.2 8.2 8
1974 7.2 7.2 7.3 8.1 8.5 9.7 10 10.9 10.6 9.7 8.6 8.2
1975 7.3 6.8 7.2 7.7 8.7 9.4 10.2 10.4 10.4 9.6 9.2 7.8
1976 7.2 7 7 7.8 8.7 9.3 10.1 10.1 10 9.4 8.6 8.1
1977 7.6 7.9 8 8.3 8.8 9.7 9.9 10.8 10.3 9.2 8.6 7.9
1978 7.6 7.9 8.3 8.9 9.4 10.3 10.4 10.9 10.5 9.8 8.2 7.3
1979 6.5 6.9 7.5 8.3 9.5 10 10.8 10.7 10.5 9.8 9 8.6
1980 7.7 7.6 7.9 8.6 9.5 9.5 10.6 10.9 10.5 9.9 9.2 8.6
1981 8.3 8.3 8.8 9.2 9.4 9.9 10.3 10.5 10.2 9.7 9.3 8.5
1982 7.2 7.5 8 8.8 9.9 10.7 11.4 11.8 11.4 10.3 8.8 8.3
1983 8.6 8.6 9.3 10 10.6 11.3 11.7 12.4 11.4 10.3 9.5 7.7
1984 7.5 7.8 8.4 9 9.7 10.3 11.4 11.6 10.6 9.7 8.5 6.9
1985 6.8 6.8 7.2 8.2 9.6 10.6 11.5 11.6 10.8 9.6 6.8 6.4
1986 7 6.6 8 8.4 9.4 11 10.9 11.8 10.8 9.8 8.4 7.8
1987 7.6 7.9 8.3 8.9 9.8 10.6 11.1 11.5 11.1 10 9 8.2
1988 7.4 7.5 7.5 8.6 9.6 10.4 11 11.4 10.6 9.6 8.7 7.9
1989 7 5.8 6.8 8.2 9.5 10.7 11.3 11.2 11 9.9 8.9 8.2
1990 8.1 7.7 8.2 9 9.9 10.8 11.8 12.1 12.1 10.7 9.9 8.2
1991 7.1 7.7 7.9 8.4 9.7 9.7 10.8 11 11.2 10.1 8.9 8.3
1992 7.9 8.1 9.5 9.5 10.2 10.7 11.1 11.4 11 10 9.1 7.8
1993 6.7 6.7 7.6 8.6 9.7 10.8 11 11.2 11 10.1 8.5 7.9
1994 8 7.4 8.6 9.3 10.1 10.6 11.6 11.5 11.3 10.7 9.3 8.4
1995 8.2 8.6 8.8 9.2 10.2 11.2 11.8 11.5 11.3 10.2 9.4 8.9
1996 8.2 7.8 8.4 9.2 10 10.4 11.5 11.5 10.5 9.9 8.7 7.6
1997 7.7 7.9 8.1 9 10.3 10.9 11.7 12.2 11.6 11.3 9.9 9.3
1998 8.7 9.2 9.7 9.9 10.4 11.4 11.7 12.3 12.1 10.7 9.8 9
1999 8 7.8 8.1 8.9 9.5 10.4 11.1 11.5 11.9 10.1 9 8.5
2000 7.5 7.7 8.1 9.1 10 11.1 11.3 11.7 11.4 10.3 9 8
2001 7.9 7.7 8.1 8.7 9.7 10.6 11.3 11.4 11.4 10.2 9.2 8.3
2002 8.1 7.9 7.7 8.7 9.4 10.5 11,2 11.7 11.3 10.0 9.0 8.8
2003 8.8 8.5 8.7 9.2 9.9 10.9 11.3 11.4 11.4 10.9 9.0 8.5
2004 7.8 7.9 8.3 9.1 10.4 11.0 11.8 11.9 11.2 10.6 9.4 8.6
2005 7.7 8.0 8.8 9.4 10.7 11.2 11.6 12.1 11.5 10.4 9.5 8.3
2006 8.61 8.49 8.41 8.75 10.08 10.86 11.66 12.09 11.49 10.55 9.29 8.5
2007 7.8 7.9 7.9 9.0 10.0 10.2 11.2 11.6 11.0 10.0 9.0 8.0
2008 7.46 7.33 7.68 8.06 9.36 9.77 10.84 11.30 11.16 10.14 9.39 7.87
2009 7.29 7.20 7.5 8.4 9.54 10.4 11.4 11.74 11.8 10.5 9.0 7.0
2010 8.11 8.68 9.12 8.96 9.54 10.36 11.16 11.93 11.08 10.37 8.98 8.5
2011 7.8
2012
2013
2014
2016
2017
2018
2019
2020
2021
2022
2023


Note, The blanks for the years 1940-41 are due to the Second World War. Apparently during that time, data was not collected by a lightkeeper.

Original data was sent by the Lightkeepers and now by the Marine Protected Area Guardian of Race Rocks to the Institute of Ocean Sciences where it is compiled and displayed at

http://www.pac.dfo-mpo.gc.ca/science/oceans/data-donnees/lighthouses-phares/index-eng.htm

Decade Average GraphDecade analysis by G. Fletcher.. NOTE probable evidence of climate change


Pseudocnus curatus: Black brooding sea cucumber–The Race Rocks Taxonomy


by Ryan Murphy, April, 2010 See Ryan’s underwater set on Flickr with a range of invertebrates:

In the early 1980’s while doing subtidal surveys, we discovered a major concentration of the small subtidal sea cucumber Pseudocnus curatus ( formerly Cucumaria pseudocnus) living in high density off the West side of Great Race Rocks. On April16, 2004, six divers, Ramiro, Mael, Mike, Carmen, Aven and Chris were able to do a preliminary survey of the area and have produced the results shown here.
To do the survey, they ran out a reel tape measure from shore to 75 meters in a bearing of 255 degrees magnetic from peg number 7- a permanent reference peg on the very South West corner of the Island. This took them into water that is 8 to 10 meters in depth.
We are uncertain as to why this organism concentrate here in these numbers, and this also happens at other locations such as Beecher bay 3 km to the West. This is the only area we find them in at Race Rocks.
Also included in this file are the raw data values from the divers. One may clip and paste these into an EXCEL program in order to do alternate analysis.

This species is distinguished from Cucumaria pseudocurata which lives up in the mussel beds by having 10 tentacles instead of 8. It is s found in great abundance on the surface of boulders at a depth of 10 meters 60 meters offshore of the south west tip of Great Race Rock ( peg7) Counts of up to 1000 per square meter have been estimated. It can also be found intertidally among the mussel beds on the Western side of the main island.

The following count done by students of the diving activity gives an idea of how dense this species is in one location at Race Rocks. Recently Ryan Murphy found another population of this density on the Eastside  of Great Race Rock.
The book Sea Cucumbers of British Columbia, Southeast Alaska, and Puget Sound by Phil Lambert is the best source for identification of most of the 45 species of local sea cucumbers. In it he notes that the habitat of Pseudocnus curatus “in the Juan de Fuca Strait tends to be shallow subtidal in areas where the tidal currents are strong….. They nestle together in large aggregations on open rocky surfaces …..and….. are eaten by many species of sea stars……although their body wall is toxic to some fish predators providing a strong defense mechanism.”

See also Taxing Problems by Philip Lambert – Now Curator Emeritus of Invertebrates, Royal BC Museum for a description of the difficulty in classification and the need to classify by the skin ossicles.
Google Pseudocnus curatus for a link to the page describing this species..

Pseudocnus curatus Is similar to another species, Cucumaria pseudocurata which is found more shallow in the intertidal zone at Race Rocks. Both species average 1.5 to 3cm in length. C. pseudocurata has 5 bands of tube feet in single or zig zag rows. As a rule there are 8 equal sized tentacles. P.curatus on the other hand has 10 equal sized tentacles. and tube feet scattered on the Dorsal side. At Race Rocks, it lives in the subtidal zone at 8 to 10 meters in depth.

Domain Eukarya
Kingdom Animalia
Phylum Echinodermata
Sub-Phylum Eleutherozoa
Class Holothuroidea
Subclass Dendrochirotacea
Order Dendrochirotida
Family Cucumariidae
Genus Pseudocnus
Species curatus, (Lambert,1997?)
Common Name: Black brooding sea cucumber

POPULATION DISTRIBUTION at RACE ROCKS

In the early 1980’s while doing subtidal surveys, we discovered a major concentration of the small subtidal sea cucumber Pseudocnus curatus ( formerly Cucumaria pseudocnus) living in high density off the West side of Great Race Rocks. On April16, 2004, six divers, Ramiro, Mael, Mike, Carmen, Aven and Chris were able to do a preliminary survey of the area and have produced the results shown here.
To do the survey, they ran out a reel tape measure from shore to 75 meters in a bearing of 255 degrees magnetic from peg number 7- a permanent reference peg on the very South West corner of the Island. This took them into water that is 8 to 10 meters in depth.
We are uncertain as to why this organism concentrate here in these numbers, and this also happens at other locations such as Beecher bay 3 km to the West. This is the only area we find them in at Race Rocks.
Also included in this file are the raw data values from the divers. One may clip and paste these into an EXCEL program in order to do alternate analysis.

Raw Data from 0.125 meter quadrats Ramiro and Mike and Av Carmen and Chris
meters from the shore 40
41
42 0
43
44
45
46 0
47 1
48 7
49 20
50 8
51
52 9
53
54 3
55
56
57 2
58 14
59
60
61
62 20
63
64 20
65 1
66 16 1
67 8
68 25
69 2
70 19 13
71 29
72 19
73 31
74 0


Other Members of the Phylum Echinodermata at Race Rocks 
taxonomyiconReturn to the Race Rocks Taxonomy
and Image File
pearsonlogo2_f2The Race Rocks taxonomy is a collaborative venture originally started with the Biology and Environmental Systems students of Lester Pearson College UWC. It now also has contributions added by Faculty, Staff, Volunteers and Observers on the remote control webcams.

Garry Fletcher

Wind Sentinnel Research

The Wind Sentinnel deployed at Race Rocks on October 18, 2009
-Estimated duration is Oct. 16 – Nov. 16 (logistics/weather dependant)
-Buoy Deployment Location – Lat: 48° 17.606’N    Long: 123° 32.370’W
-Communications – Buoy: Cellular phone
-Communications – land station: Race Rocks LAN wired Ethernet connection
.AXYSWindSentinelWe will be able to benefit by adding the information collected to the knowledge base for the reserve. It will also be useful for planning for future sustainable energy applications.

In October, 2009, Lester Pearson College had an opportunity to participate in an offshore wind assessment test by AXYS Technologies Inc. in the Strait of Juan de Fuca .See video of test in Juan de Fuca off Race Rocks
Sidney firm deploys world’s first wind buoy :
Times Colonist,October 28, 2009
Great Race Rocks was used to host the land station for an offshore buoy which is designed to record  wind speed and direction data profiles up to 200 meters height. It is anchored outside of the Race Rocks Ecological Reserve in the Strait of Juan de Fuca. Data from the buoy is relayed automatically every 10 minutes by cell phone to the instrument trailer on land and is transmitted to the internet through our LAN on Race Rocks.

See the Link below to this brochure pdf with more specifications


Link for more specifications AXYSWindSentinel

We will be able to benefit by adding the information collected to the knowledge base for the reserve. It will also be useful for planning for future sustainable energy applications

Our current wind measurements done by the Davis weather instrument we have installed on the ground level, often show at least a 10 km/h difference in wind velocity when compared with the Environment Canada data from the top of the tower at 36 metres. A set of data with projections to 200 metres will provide an excellent profile for comparisons.

See this sample file on Analyzing the data as an exercise
To access the Live Streaming Data from the instrument AXYS Technologies has provided the fiollowing link:http://data.axystechnologies.com/AXYSWebView/WEBVIEW/webview.aspx
Username: windtrial
Password: axyswind
The left hand window shows the station, which if you click on will expand out to show the messages (metocean and Waves) and if you click the + beside these you will get the individual data parameters which you can plot into a graph by selecting the checkbox of the parameter you want to graph and then clicking the Graph icon at the top of that window.
You can also see a table of the data by simply clicking on the message (click on the 1 MetOcean name and a table will appear on the RHS window with all the data) 

Times Colonist Article on Wind buoy deployed at RR

Sidney firm deploys world’s first wind buoy :
Times Colonist,October 28, 2009
http://www.timescolonist.com/technology/Sidney+firm+deploys+world+first+wind+buoy/2153639/story.html

Sidney’s AXYS Technologies has deployed the world’s first offshore wind resource assessment buoy near Race Rocks in order to test the machine prior to its commercial launch.

The WindSentinel was launched this week to compare wind data collected on the moving buoy to wind data collected from a station on Race Rocks about a half kilometre away.

The WindSentinel is designed to assist offshore wind farm developers in determining the available wind resource at potential wind farm sites. It is the world’s first wind resource assessment buoy capable of accurately measuring wind data at heights of conventional offshore wind turbines.

AXYS said wind farm developers have had to construct permanent offshore meteorological towers to do that work at an estimated cost of about $10 million. By contrast, a basic WindSentinel model is approximately $1 million.

The test site was chosen to thoroughly assess the buoy’s capabilities as the waters at Race Rocks see currents of between five and six knots, waves measuring between two and four metres high and winds up to 50 knots.

The results of the study are to be released in early 2010.

“The WindSentinel allows developers to collect crucial wind resource assessment data more accurately, more quickly and less expensively than every other available option,” said AXYS spokesman Dennis Stacey.
© Copyright (c) The Victoria Times Colonist

Test of AXYS Wind Assessment Technology

In October, 2009, Lester Pearson College had an opportunity to participate in an offshore wind assessment test by AXYS Technologies Inc. in the Strait of Juan de Fuca .

See video of test in Juan de Fuca off Race Rocks

Sidney firm deploys world’s first wind buoy :
Times Colonist,October 28, 2009

rm191009buoydeployed

The Wind Sentinnel deployed at Race Rocks on October 18, 2009 -Estimated duration is Oct. 16 – Nov. 16 (logistics/weather dependant) -Buoy Deployment Location – Lat: 48° 17.606’N Long: 123° 32.370’W -Communications – Buoy: Cellular phone -Communications – land station: Race Rocks LAN wired Ethernet connection

Great Race Rocks was used to host the land station for an offshore buoy which is designed to record  wind speed and direction data profiles up to 200 meters height. It is anchored outside of the Race Rocks Ecological Reserve in the Strait of Juan de Fuca. Data from the buoy is relayed automatically every 10 minutes by cell phone to the instrument trailer on land and is transmitted to the internet through our LAN on Race Rocks


https://www.racerocks.ca/wp-content/uploads/2009/09/AXYSWindSentinel.pdfLink to this brochure pdf with more specifications. AXYSWindSentinel

We will be able to benefit by adding the information collected to the knowledge base for the reserve. It will also be useful for planning for future sustainable energy applications.Our current wind measurements done by the Davis weather instrument we have installed on the ground level, often show at least a 10 km/h difference in wind velocity when compared with the Environment Canada data from the top of the tower at 36 metres. A set of data with projections to 200 metres will provide an excellent profile for comparisons.

See this sample file on Analyzing the data as an exercise.

Username: windtrial
Password: axyswind
The left hand window shows the station, which if you click on will expand out to show the messages (metocean and Waves) and if you click the + beside these you will get the individual data parameters which you can plot into a graph by selecting the checkbox of the parameter you want to graph and then clicking the Graph icon at the top of that window.

You can also see a table of the data by simply clicking on the message (click on the 1 MetOcean name and a table will appear on the RHS window with all the data)

Return to the Wind as an Abiotic Factor at Race Rocks File

Race Rocks Tidal Turbine Generator

GROUP 4 PROJECT- 2009Connor Scheu and Wouter Zwart April 2, 2009

Race Rocks Tidal Turbine Generator

Background:

Connor communicated with Russ Stothers of Clean Current for his project;

“Here is a simple synopsis of the project I will be doing this week. It is called a group four project (which pertains to the experimental science department here at the college), and the theme for everyones project is resource allocation/sustainability. Every student has to decide upon a project in which they will research something in this area. This usually involves the identification of a question, and then variables, presented in a lab format and accompanied by a presentation, but not overly formal.
For my project I really wanted to do something close to home, so I naturally thought of the tidal generator. I thought it would be so great if I could use this project to become more familiar with the project, and learn more about the field in general. It was for this reason that I wanted to contact you.

So basically what I would require for my project is some simple data, on the energy output of the generator, hopefully in relation to the tidal currents. From this I hope to create a simple relationship, proportional or not, which will help me identify the output and efficiency as current varies. This would satisfy the lab component of my project. The next component I would pursue would be the application of this knowledge. Simply from the results of the data and correlation I hope to receive, I would apply some simple reasoning to determine how effective or feasible such technology would be in other circumstances. That is, different magnitudes, in size and tidal extremes. An example of this would be; if the generator receives pique efficiency at the lowest speeds, then the technology would be more widely applicable to more general locations in the world, as opposed to selective areas of high tidal motion. Or if the energy benefits of higher speeds outweigh the selectivity of the projects.
This may be a rather ambitious goal, however this is a less formal project than others at the college (the extended essay is a full research paper) and as such it is OK to have lofty goals and then only achieve some of them in the allotted time. However I am sure that with your help I will be fully capable of receiving satisfactory results.
So I guess what I am asking of you would be the data I have previously outlined, in addition to the answering of some basic questions on the running of the turbine (included below this message).
This help would be most appreciated, I think it would be highly beneficial for the students of the college to have a little more information on the nature of this project. As it is so unique in design, important to global issues, and close to home. This is what my project will allow, as I will be presenting my findings to the student body towards the end of the week. I am very grateful for your generosity and aid
thank you again
Connor Scheu

Here are some of the questions which I have identified as what I think I need to know. But please feel free to include any relevant knowledge that you think would help. I am still quite unfamiliar with the project, and as such my questions may be a little vague. Also feel free to not answer any questions if they breach any kind of protocol or patent information.
1. Is this in fact just a simple turbine generator (similar to those in other hydro operations) placed in the presence of a fast moving current, or does it have certain defining characteristics.
No, it is significantly different from other hydro turbines. The requirement to extract power from a bi-directional flow means that the design of the turbine blade is very different. All standard hydro applications have blades that are designed to accept flow in one direction. Another major difference is that our machine is direct drive so that the speed of the generator is very slow compared to traditional applications which use a gearbox and a high speed generator.
2. What is the magnitude of energy created, when compared with other forms of green energy, is it relatively efficient etc.
The magnitude of the energy with respect to efficiency is very similar to wind in that the same basic laws of physics apply. The big difference/benefit is that the energy produced by tides is completely predictable whereas wind energy is statistically predictable over long periods of time but impossible to predict from one minute to the next.
I wouldn’t try to compare tidal energy to solar, biomass or other renewables. Each form of renewable energy is site specific.
3. Is this technology quite expensive to install, does it require very specific natural circumstances to operate effectively.
At the present time, yes. One of the biggest challenges facing the industry is to develop a system to cost effectively deploy, maintain and retrieve these devices. As you can understand from your experience at Race Rocks, the weather combined with the high tidal currents makes any deployment activity very difficult. The technology is best suited to sites that have peak tidal velocities between 2.5 m/s and 5.0 m/s. At current speeds less than 2 m/s there is very little energy in the flow and at speed greater than 5 m/s cavitation becomes a significant issue.
4. Is it true that this is one of only four projects like this in the world, and if so, what are the natures of the others. That is how do they differ, or are similar. Also, what immediate repercussions could this technology have on the world if proven to be effective.
Clean Current’s principal competitors are based in Europe. There are many competitors but the ones Clean Current considers threats are:
Marine Current Turbines is the most advanced with the deployment of a 1.2MW unit at Strangford Lough in 2008. Clean Current believes the challenges of this system compared to the Clean Current technology are as follows:
This unit has a high capital cost due to the complexity and large number of moving parts (gearbox, variable pitch blades, mechanism to raise and lower rotor).
The structure is surface piercing and therefore a navigational hazard to recreational and commercial traffic.
The exposed rotating blades pose a threat to fish, marine life and divers.
The above water structure must be designed to survive extreme weather such as hurricanes and tsunamis.
The turbine is sensitive to flow directional changes as it does not have an upstream augmenter to redirect the flow.
The system is complex and not applicable in deep water applications which comprise the majority of the world’s resources.

Open Hydro is a well financed company based in Ireland.  They have deployed a 6m prototype of their technology at the EMEC testing centre. They are also planning to deploy a second unit in the Bay of Fundy in the summer of 2009. Clean Current believes the challenges of this system compared to the Clean Current technology are as follows:
The fixed pitch blades are similar to flat plates and therefore have a poor efficiency. Clean Current’s blades are also fixed pitch but use a highly efficient hydrodynamic shape.
The overall efficiency of this unit is much lower than Clean Current’s turbine due to the lack of a power augmenting outer duct.
The lack of a central support makes the turbine more susceptible to vibration caused by the turbulent tidal flow The turbine cannot compensate effectively for flow directional changes as it does not have an upstream augmenter to redirect the flow.
The design information currently available does not indicate the use of a maintenance module potentially resulting in significant downtime.

5. Is this technology a great improvement on the other forms of tidal generation, which typically involve the use of dikes and grand structures.
The traditional barrage types of technology have large environmental impacts. The type of tidal generation that we are promoting does not have the same effect on the ecosystem; however, it is important to note that barrage types of technology can extract greater amounts of energy as all of the flow is forced through the turbine.
6. What are some of the typical pitfalls in this kind of project, some main difficulties either with engineering, or other aspects.
Some of the main challenges from the engineering side are as follows:
Deployment in fast moving waters (as discussed above)
Operation of bearings in a submerged environment
Operation of an electrical machine in a submerged environment.
Transmission of the power to shore
Achieving maintenance free operation for 5+ years.
Prevent bio-fouling
Some of the non-technical issues include:
Regulatory approvals from organizations such as DFO on the perceived impact on marine life
Negotiations with existing users of area (fisherman, tug operators, commercial vessels) to accommodate the installation of a tidal farm

I think these are sufficient to give me a basic comprehension of what this project is about. I will also make an effort to research what I can on my own, I just thought I would make use of you as a resource if possible.
thanks again
Connor Scheu
Questions:
1. I am still unsure as to the nature of the “upstream augmenter.” I know that it allows for the turbine to compensate for flow direction changes, I am just not sure how it does this, or what it is really.
The curved shape of the augmentor redirects the flow so that the water is directly aligned with the turbine rotor. Without an augmentor, the flow would intersect the rotor at an acute angle which would result in reduced power output. You can also think of the augmentor as functioning similar to a sail on a sailboat. When the sail is trimmed properly, the wind follows the shape of the sail. We have designed the augmentor so that for flow deviations, the water follows the surface of the augmentor.
2. The transmission of power to shore, is done by means of an underwater cable? Is this the only means by which this can be done, and is this a very difficult procedure?
The only way to bring significant power ashore is through the use of a subsea cable. The challenges of this technology are ensuring the cable is adequately protected on the seabed. Due to the high current environment, the cable is very susceptible to damage through abrasion on the rocky seabed. Another challenge is electrical connectors. The majority of the connectors available in industry are not designed for both high power and long life. A specific design for tidal generators is required.
3. You mentioned the biological impact, I understand how this turbine is significantly better than the barrage designs, and even than the open bladed design of the other company. I presume that it is fairly safe (simply by looking at the design) because large animals will avoid the turbine, and smaller fish may pass through without harm. Is this somewhere in the right ballpark. Are there any other concerns for the local wildlife?
You thoughts are inline with ours. I think your best source for an opinion here is probably Chris.
4. It seems to me as if you guys are the best outfit going, would you consider yourselves the world leaders in this technology, or at least one of the most promising companies.
Thanks for the comments! Yes, we believe that we are one of the leading technologies. Having said this; however, there is still significant work to be performed to make this product commercial.
5. You mentioned that the majority of the world’s resources are located in deep water, what kind of limitations does your technology have on depth? Are there a multitude of possible locations for this technology around the world, what would be some of the ideal circumstances?
When we refer to deep water, we are referring to 40-65m of water. Our technology is well suited to these depths. As you go deeper, the greatest challenge will be installation. The paragraph below is an excerpt from our assessment of the market.
Global demand for electric power is expected to increase from 14.8 trillion kilowatt hours in 2003 to 30.1 trillion kilowatt hours by 2030, according to the Energy Information Administration. To meet this demand, the International Energy Agency estimates that investments in new generating capacity will exceed $4 trillion in the period from 2003 to 2030, of which $1.6 trillion will be for renewable energy generation equipment.
A variety of factors are contributing to the development of renewable energy systems that capture energy from replenishable natural resources, such as ocean currents and waves, flowing water, wind and sunlight and convert it into electricity. These factors include the rising cost of fossil fuels, dependence on energy from foreign sources, environmental concerns, government incentives and infrastructure constraints.
Tidal energy is positioned favourably to capitalize on the growing demand for renewable energy. It is expected that tidal energy generation costs for large sites will be competitive with other renewable energy sources. In addition to having the potential to be a very large source of competitive renewable energy, tidal energy is a very predictable source of energy, is not affected by climate change and has a minimal environmental footprint.
Clean Current expects early adoption of tidal power generation will be driven by those countries and regions that are looking to satisfy government or regulatory renewable energy mandates and that have potential tidal energy resources situated near populations with high electricity demand and relatively high power prices. A number of communities and utilities in the United Kingdom, North America and Asia are currently pursuing tidal energy feasibility studies, and are expected to be some of the first regions to pursue tidal farms when a proven commercial technology becomes available.
Recent government sponsored initiatives have included tidal resource assessments from leading engineering consulting firms, Black & Veatch Corporation (“Black & Veatch”) (United Kingdom) and Triton Consultants Ltd. (“Triton Consultants”)(Canada), respectively. Black & Veatch estimated the world’s “Technically Extractable Resource” to be 155 TWh per annum, including 18 TWh  At an average capacity factor of 26%, this?per annum in the United Kingdom. translates to installed capacity of approximately 67,400 MW for the world and 7,800 MW for the United Kingdom.
In Canada, Triton Consultants assessed the tidal energy potential at approximately 42,000 MW. Approximately 7,000 MW of this potential resource is located in accessible regions on the east and west coasts of Canada.? Clean Current estimates that approximately 15% to 20% of the power in the accessible regions is currently extractable, resulting in 9.2 to 12.3 TWh per annum of electrical energy. At an average capacity factor of 26%, this translates to installed capacity of approximately 4,000 to 5,500 MW for Canada.
1. Source: Phase II, UK tidal Stream Energy Resource Assessment; Black & Veatch
2. Source: Canada Ocean Energy Atlas (Phase 1) Potential Tidal Current Energy Resources Analysis Background; Triton Consultants

Again, I am very grateful for all of your help, I read on the company site that one of the mandates of this project was to aid in the education of the students of Pearson College. I think this is very thoughtful, and says something about the quality of your company, and of course, its employees.
Purpose: To determine the correlation between the rates of current flow through the channel and the power produced by the generator, and then apply said correlation to real world applications.

Procedure: Experimentation performed by Clean Current and its employees

Data:

Diameter of Turbine m 3.5
Frontal Area m2 9.62
Density of Seawater Kg/m3 1024
Current Speed Blade Tip Speed RPM Power in water Efficiency Power Extracted
(m/s) (m/s)   (kW) (%) (kW)
         
1.0 3.9 21.4 4.9 28.2% 1.4
1.1 4.3 23.5 6.6 28.9% 1.9
1.2 4.7 25.7 8.5 29.5% 2.5
1.3 5.1 27.8 10.8 30.1% 3.3
1.4 5.5 30.0 13.5 30.7% 4.1
1.5 5.9 32.1 16.6 31.2% 5.2
1.6 6.3 34.2 20.2 31.7% 6.4
1.7 6.7 36.4 24.2 32.2% 7.8
1.8 7.1 38.5 28.7 32.6% 9.4
1.9 7.5 40.7 33.8 33.0% 11.1
2.0 7.8 42.8 39.4 33.3% 13.1
2.1 8.2 44.9 45.6 33.6% 15.3
2.2 8.6 47.1 52.5 33.9% 17.8
2.3 9.0 49.2 59.9 34.2% 20.5
2.4 9.4 51.4 68.1 34.4% 23.4
2.5 9.8 53.5 77.0 34.5% 26.6
2.6 10.2 55.6 86.6 34.7% 30.0
2.7 10.6 57.8 97.0 34.8% 33.7
2.8 11.0 59.9 108.1 34.8% 37.7
2.9 11.4 62.1 120.1 34.9% 41.9
3.0 11.8 64.2 133.0 34.9% 46.4
3.1 12.2 66.3 146.8 34.8% 51.1
3.2 12.5 68.5 161.4 34.6% 55.8
3.3 12.9 70.6 177.0 34.3% 60.8
3.4 13.3 72.8 193.6 33.8% 65.4
3.5 13.7 74.9 211.2 32.6% 68.9


These graphs are representative of the data presented in the table. They indicate the relationship between rate of current flow in meters per second to a variety of other variables (Blade Speed, RPM, Theoretical Energy, Efficiency, and Produced Energy).
 bladevscurrspeed
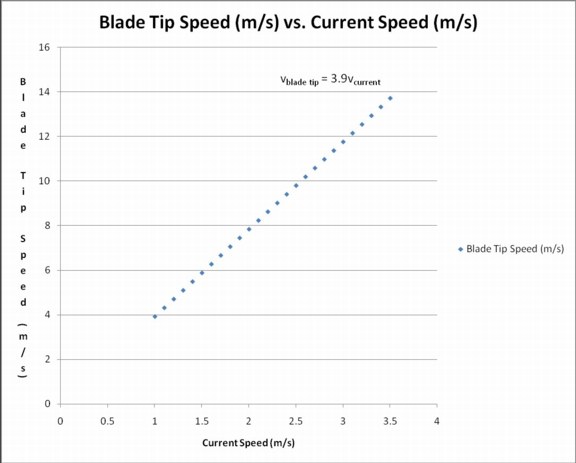
  This graph shows how there is a perfectly linear relationship between the current speed, and the rotational speed of the blade tips. This is self evident as it is in fact the current that drives this motion. It is notable however that there is virtually no impact from friction or other environmental forces. There is a uniform constant (value 3.9) which relates blade tip speed to current speed for this model of generator.rpmvscurrspeed

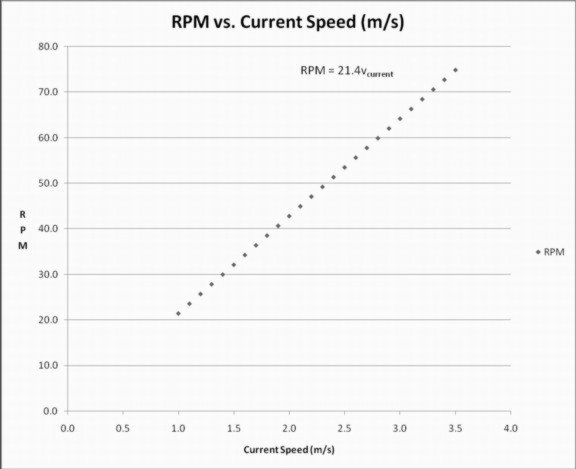
This graph shoes much the same relationship as the first graph, albeit with a different constant. This is simply because the blade speed has a direct relationship with the revolutions per minute. This value is dependent on the diameter of the turbine, and thus the length of the blades.

poweerinwatvscurrspeed

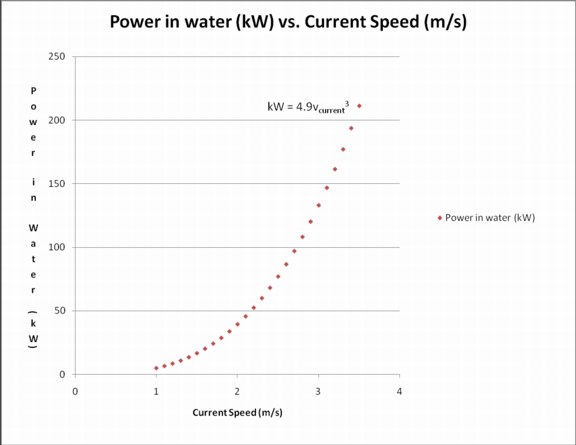
This graph shows the relationship between the theoretical value of the power in the water, and the current speed.

This value is derived from the formula: P = Cp x 0.5 x ρ x A x V3

Where:

Cp is the turbine coefficient of performance

P = the power generated (in watts)

ρ = the density of the water (seawater is 1024 kg/m3)

A = the sweep area of the turbine (in m2)

V3 = the velocity of the flow cubed (i.e. V x V x V)efficvscurrentspeed

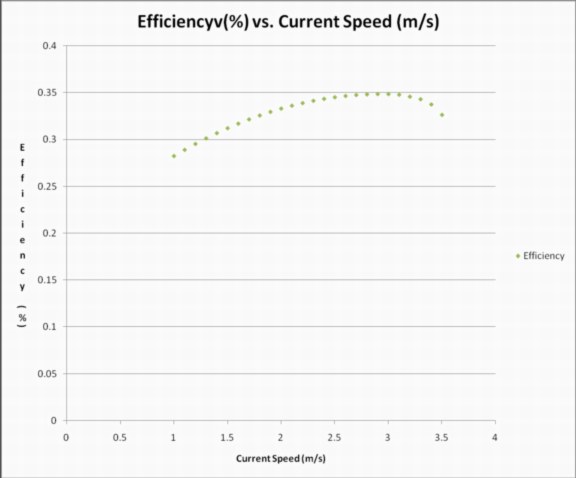
This graph shows the relationship between the overall efficiency of the turbine, and the rate of current flow. This is derived from dividing the actual power produced by the theoretical power produced. It can be seen that as current flow reaches its upper limits, the device begins to rapidly lose efficiency. This has implications on the applicability of this product. The peak efficiency is 2.76 m/s, found as follows:

The estimated equation for the slope of the graph is -0.0215x2 + 0.1187x + 0.1829 using a graphing program.

The derivation of this line is: -0.043x + 0.1187

When this equals zero, the slope is zero, which is the point of greatest efficiency (maximum point)

This is 2.76 m/s, the power received at this point is 35.5 kW

powscurrspeed
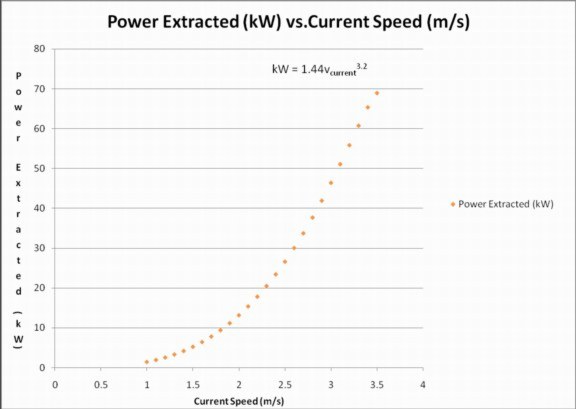
This graph displays the actual values for energy produced, when compared to current flow. It can be viewed as a combination of the efficiency and ideal power graphs. This knowledge is integral to understanding the ideal speed. It can be clearly seen that the relation is quite exponential, with higher speeds yielding much greater results. However it is also known that the efficiency curve takes a greater role at roughly the end of the data, an extension of this graph would show an eventual plateau. Using this knowledge we can conclude that the ideal current speed for this turbine is somewhere in the region of 3.5 m/s.

Analysis/Conclusion:

From the data we have developed a very clear and meaningful relationship between the rate of current flow, and various aspects of the turbine generator on Race Rocks. We have noted that there is a perfectly linear relationship between current speed and the speeds of the blade tips, as well as the RPM of the turbine itself. We have shown that there is an exponential increase in theoretical power contained in the water and current flow, as well as the exponential decrease in efficiency as these values increase. Finally we have shown the actual relationship between current speed and energy output, which can be viewed as a compilation of the efficiency and theoretical power graphs.

This data is incredibly useful in the analysis of this device, and its applicability. The point where the most energy is obtained most efficiently has great impacts on how the technology is used. From our data it is clear that this point is towards the upper range of the current flow, about 3.5 m/s. For after this point the efficiency of the system decreases dramatically. Before this point, the exponential increase in energy produced makes the efficiency loss acceptable.

Further Connections:

I have learned that the average energy output for this turbine for one day is 300kWh, which equates to an average energy production of approximately 12.5 kW. This information may be applied to any power consumption grid, in order to determine the feasibility of using these turbines on a larger scale.

One house at Pearson College uses approximately 600 kWh of energy per day. Using this data, it is possible to conclude that two of these generators could provide enough power for one house. That is power for forty-two individuals, provided entirely by the sea; perfectly green, completely sustainable, and 100% predictable energy.

It should also be considered that this device is still a prototype, and is constantly being refined to the point where it may be commercialized and applied on a larger scale.