Student Research From: .. The Race Rocks Marine Protected Area

Shade Preference in Sub-tidal populations of Dorid Nudibranchs: an Analytical Rebuttal

Ryan M. J. Murphy
November, 2000

A Submission for partial fulfillment of the requirements of the International Baccalaureate

PURPOSE

The purpose of this investigation was to evaluate the claims of H.L. Geiger and A.R. Holyoak (1996) that adult dorid nudibranchs displayed a distinct shade preference during laboratory test  runs, and then to analyse their conclusions.

INTRODUCTION:

Dorid nudibranchs, oval or ellipsoid in general shape, are dorsoventrally flattened.  Protruding from their backs are two sets of structures. Anteriorly is a pair of rhinophores, chemosensory antennae that often have numerous folds and lamellae (or ridges) that serve to increase the sensitive surface area. This is their primary sense organ. More posteriorly are situated the flowerlike, branchial plumes (or gills).  Dorids differ from the other main division of nudibranchs, the Aeolids, in that they have no ceratan extensions[1], but rather small papillae or no skin protuberances at all.

(from Morrow, 2000)

Nudibranchs are useful to marine ecologists as they are indicator species, that is, they can be used as early indicators of environmental change, such as degradation, to a community or ecosystem (Pidwirny, 2000).  Nudibranchs and other opisthobranchs are useful to neurologists as well. Anisodoris nobilis in particular has been utilised for neurophysiological experiments because of its neurons that are many times larger than human neurons (Smallwood and Rogers, 1908).  Also, since nudibranchs have relatively few neurons, neurologists can use nudibranchs to analyse the process by which neuromodulation controls bodily functions to a greater extent than is possible in any vertebrate circuit (Katz, 2000).

Nudibranchs are opisthobranchs, meaning they belong to a group of marine gastropod molluscs of the order Opisthobranchia, characterized by gills, a shell that is reduced or absent, and two pairs of tentacles.  Opisthobranchs are simultaneous hermaphrodites, meaning that a single individual has both the male and female gonads (testis and ovary) to make sperm and eggs, as well as the external appendages for the transmission of these sex products by copulation.  The final products in copulation of nudibranchs are resilient egg ribbons (Hurst, 1967) with large surface area-to-volume ratios, which are deposited during all seasons of the year.  Egg ribbons of the Archidoris montereyensis nudibranch were studied by Biermann et al. (1992), who analysed the effects of solar radiation and other environmental factors on egg deposition site and embryo survival.  Biermann et al. (1992) found that A. montereyensis preferentially laid their eggs underneath macroalgal shelter.  In its natural habitat and in controlled laboratory conditions, they went on to determine that solar radiation arrested embryo development in tests that exposed the egg ribbons to direct sunlight in a shallow, water-cooled trough.  Solar radiation was found to directly or indirectly limit the distribution of nudibranchs and their development in shallow water (Biermann et al., 1992). Biermann et al. proposed that adult dorids may actively select shaded areas to deposit their egg ribbons, an idea forming the basis for a more recent study of dorid nudibranch behaviour (Geiger and Holyoak, 1996).

eiger and Holyoak hypothesised that A. montereyensis adults’ preference to lay egg ribbons in shaded conditions was a direct result of natural selection against offspring of individuals that deposit egg ribbons in unshaded areas (1996).  In addition, it was hypothesised that the differential survival of embryos as demonstrated by Biermann et al. (1992) might have an evolutionary effect on reproductive ecology (Geiger and Holyoak, 1996).  Time trials conducted in an artificially shaded tank during the late spring involving 3 to 16 specimens of the same species showed that between 83.3 and 100% of the nudibranchs studied preferred shaded conditions to light (Geiger and Holyoak, 1996).  Geiger and Holyoak used A. montereyensis specimens from piers at Friday Harbour on San Juan Island (see Friday Harbour, Figure 2), similar to the population studied by Biermann et al. (1992) at Argyle Creek on San Juan Island. 

Figure 2: San Juan Island

Figure 3: Pedder Bay-Race Rocks Region

Figure 3: Pedder Bay-Race Rocks Region
The initial purpose of this investigation was to determine if the shade preference as elucidated by Geiger and Holyoak in A. montereyensisD. sandiegensis, and T. catalinae was present in other dorid nudibranch species.  Five species of nudibranch were chosen for this experiment (see Appendix A): Archidoris montereyensis (MacFarland, 1966), Anisodoris nobilis (MacFarland, 1905), Diaulula sandiegensis (Bergh, 1879), Acanthodoris hudsoni (MacFarland, 1905)and Cadlina luteomarginata (MacFarland, 1905).  A. montereyensis and D. sandiegensis were used as a comparison to the Geiger and Holyoak experiment.  Cadlina luteomarginataAcanthodoris hudsoni,and Diaulula sandiegensis were chosen for their local abundance, as well as to determine whether there are behavioural differences between dorids generally more common in the low inter-tidal ranges (i.e. A. hudsoniA. montereyensis, and D. sandiegensis) and those more common in the subtidal range (i.e. C. luteomarginata and A. nobilis) (Morris et al., 1983).  Upon initial tests with A. montereyensis, it became clear that shade preference of other dorids could not be the focus of the investigation, for as Geiger and Holyoak found a negative relationship between dorid movement and light intensity, my preliminary work showed the contrary.  The obvious question then arose: Why the population of A. montereyensis and D. sandiegensis specimens being tested did not express shade preference as the Friday Harbour populations did.  Subsequent analyses were designed to verify these results, and to help explain this difference.

All five nudibranch species used in this study were collected at Great Race Rocks, 48o17’45” N, 123 o31’50” W (see Figure 3) at depths between 6 and 12 m, subtidal range.  Initial time trials were conducted in mid-May, 2000, and all secondary trials were conducted in late October and early November 2000.

Race Rocks Permit Application

For research, collection activities or commercial use of the ecological reserve.


Introduction:

The ecological reserve of Race Rocks is a transition zone between the inner coastal waters of Pedder Bay and the open Pacific Ocean. Due to this unique geographical location, it is home to an exceptional variety of marine life. This provides many unique opportunities for research or filming to be carried out on the reserve. However, it also means that the environmental impact of such activities on the ecosystem of Race Rocks must be carefully considered to ensure the sustainability of the biodiversity that is present here.

Therefore, the questions in this application form have been designed to find out the precise objectives and procedures of the proposed project and the anticipated environmental impact on Race Rocks. In addition to this, the opportunity to live on Race Rocks whilst carrying out research means that details are required by Lester B. Pearson College in order to arrange this for you.

Preservation of ecological values is the ultimate management priority and in the event of conflict, these values take precedence over the provision of research facilities. This permit must be returned to the Race Rocks Operating Committee for preliminary approval. A copy will forwarded to the Ecological Reserve Branch for final approval. 

See the Regulations for Using the Race Rocks Marine Research Centre

and the Operational Guidelines

If you require the use of the Light Tower, arrangements must be made directly with the Canadian Coast Guard Office in Victoria.


BASIC INFORMATION: (Type directly in the spaces provided)

(1) Individual(s) surname(s) First names

(2) Company/Society name

(3) Major shareholders or principals. Attach names and addresses.

(4) Company inc.no/Society no.

(5) Company/Society mailing address

(6) Business phone 

Home phone 

Fax 

E-mail

URL of your Web Site if available

(7) BC parks requires minimum public liability insurance coverage of $ 1,000,000. Will you be able to obtain this?

Yes No

(8) If paid employees are employed on site as part of your project please
provide proof of BC Worker’s Compensation coverage or suitable
substitute insurance.
Worker’s Comp # 


DESCRIPTION OF ACTIVITY

(9) Area of research

Please fax a map detailing the area(s) where you will be carrying out the research.

(10) Detailed plan of research:

A) Study Overview and Rationale. ( briefly describe the project and what you are trying to achieve).

B) Objectives ( briefly state the objectives of the project)

C) Methodology:

D) End Products: What are the end products of the research? Please be aware that final copies of reports must be made available in electronic form to the Race Rocks Operating Committee. Copies of slides, pictures, raw footage, videos produced etc.. must be made available to the Race Rocks Archive in the Lester Pearson College Library.

(11) Please detail your experience and involvement in the Race Rocks area.

(12) Please indicate the dates that you wish to carry out the research.

(13) Do you plan to stay at Race Rocks for this time? (See description of accommodation, and book the facility with the operating committee well in advance of the intended visit.)

(14) We require a component of Lester Pearson College student involvement for projects done on the reserve. Please indicate below how you aim to do this?
Will staff or students require specialized training or certification for this research? If so, describe.

(15) Will the proposed project require construction of any temporary or permanent structures on Race Rocks? Describe including proposed location.

(16) Do you propose to use any existing facilities at Race Rocks?
(e.g. docks, tanks etc..)

(17) What assistance for transportation ( include times and dates) will be needed.

(18) Will the proposed research project affect or restrict other visitors coming to Race Rocks? Describe.


ENVIRONMENTAL IMPACT:

(19) What do you anticipate to be the environmental impact of the research under the following categories? Indicate how you intend to mitigate this impact.

A. Physical/Chemical

land, water, noise,

B. Ecological

habitat, species and populations

(20) Additional Comments


PLEASE SAVE THIS FORM TO YOUR COMPUTER

YOU MAY IT FAX TO : 250-391-2412

or e-mail as an attachment to: The Race Rocks Operating Committee

A copy will be forwarded by us to the Ecological Reserves Office. Receipt of the application will be acknowledged by e-mail.

The Original version of this permit was created by members of the Pearson College Environmental Systems class, March, 1997 Leah Gray, Kata Meszaros, Iro Tikkanen

Turbulence and Mixing Estimates Using a Towed Horizontal microstructure Profiler

Paul Macoun: Turbulence and Mixing Estimates Using a Towed Horizontal microstructure Profiler

Turbulence and mixing estimates using a towed horizontal microstructure profiler.
Paul Macoun

The Ocean Turbulence Laboratory

University of Victoria

The Purpose

Mixing is the key element in the redistribution of salt, heat and energy in the ocean. Understanding the mechanisms and magnitude of turbulence and other mixing processes is crucial to the improvement of models that predict oceanic and atmospheric change. Our elusive goal is the parameterization of the vertical fluxes of salt and heat based upon the physics of oceanic mixing processes.

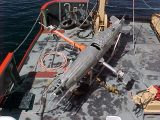
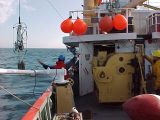
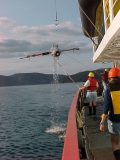
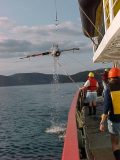
The horizontal profiler TOMI (Towed Ocean Microstructure Instrument) is used to make simultaneous measurements of temperature, conductivity, vertical velocity, and their fluctuations. The measurement of vertical velocity provides a means of estimating the rate of dissipation of turbulent kinetic energy. The respective products of instantaneous velocity and temperature, and that of velocity and conductivity, provide a direct measure of the vertical fluxes of heat and salt.

Simultaneous vertical profiles of current and its shear from a ship mounted ADCP (Acoustic Doppler Current Profiler) provide a means to relate the measured fluxes to the Froude Number and the Buoyancy Reynolds Number over a wide range of these parameters. The efficiency of mixing, the ratio of buoyancy-to-kinetic energy production, reaches 0.5 in near coastal regions and is generally much larger than the value of 0.2 assumed to apply to the open ocean.

This analysis is to be the first task to undertake with respect to the data set collected at Race Rocks on August 17th, 2000. At present, the processing is at a preliminary stage.

The Instrument

TOMI is a towed oceanographic vehicle designed to measure turbulence in both shallow and deep water. TOMI can support a multitude of instruments, from sonar to underwater cameras. Its primary oceanographic and electronic sensors are as follows:

1) Four airfoil shear probes and two fast-response thermistors on the nose.

2) A seabird temperature and conductivity sensor adjacent to the nose probes.

3) A seabird temperature and conductivity sensor, and a flowmeter, on the upper mast.

4) A seabird temperature and conductivity sensor, and a flowmeter, on the lower mast.

5) A pressure sensor mounted mid-body, internally.

6) An inertial motion sensor package, internal.

The sample rates for these instruments vary from 64 samples per second up to 512 samples per second. The airfoil shear probe is a unique instrument that measures the cross-stream component of velocity. The force generated by cross-stream flow bends a tiny ceramic bi-morph beam, which generates a voltage that is amplified and recorded. The motion sensor contains accelerometers and gyros. Its presence is required because of low frequency body motion contamination that finds its way into the shear probe signals. By having a record of the vehicle’s behaviour, the probe signals can be decontaminated through processing.

(Photos to be added)

Return to P. Macoun- Oceanographic Research

The Ecological Niche of Anthopleura elegantissima at Race Rocks”

“The Ecological Niche of
Anthopleura elegantissima at Race Rocks”
by: Santiago Salinas
Candidate number:
0034 – 119
Subject:
Biology   Best Language Spanish

Student , Lester B. Pearson College of the Pacific
Submitted as partial fulfillment for the International Baccalaureate diploma program, January 2000


Abstract
 

As with any other species at Race Rocks, Anthopleura elegantissima is an important member of the ecosystem to which it belongs. By knowing its ecological niche, trends can be analyzed, niche overlapping or other predictions may be made, particularly, for example, if new species are introduced.

The field work consisted of taking three variables (elevation, rock temperature and time underwater) and testing them against number of organisms. Three different populations were selected and a transect containing subsequent quadrats for each was used (a Mann-Whitney test was performed to determine whether or not there is a general trend between the three populations). The variables were selected because they are known to be influential in the determination of the distribution of species. Since the field work took place during only one day due to the limiting factor of low tide level, a good and thorough design was created. The priorities were the elevation of the terrain and the number of organisms per quadrat in view of the fact that the tidal level was constantly altering, making the measurements inaccurate otherwise. The rock temperature was taken once these two sets of values had been gathered from the three locations.

?Since the statistical device suggested that the three populations are organized in the same way, a general description of the ecological niche was given. The species prefer a temperature range of 11-13ƒ C, the ideal elevation span goes from 1.5 to 2.8 meters, thus, it is an inter tidal species, and finally, the preferable time underwater was found to be 5 to 15 hours.

____________________________________________________________

Table of Contents
Introduction

?The Problem ………..?………….9 ?

?Purpose and Background of the Study………9

?Hypothesis …………………………….…..9

?Assumptions …………………………..…..1

?Limitations …………………………….….10

?Definition of Terms ………………………11

Review of Literature and Related Research

?Introduction, Information about the Organism …..13

?The Theory ………………………………….15

?Research Results in Related Areas ……16

Research Design and Procedures

?The Setting and Population of the Stud…18

?Field Work …………………19?

Instruments…………………………21

?Statistical Techniques Used ………22

Analysis of Data

?

Introduction …………………………………….23

?Findings ………………………………………23

Conclusions and Recommendations for Further Study

?

Interpretation and Implications of the Findings……………40

?Recommendations …………………………….42

Appendix

Bibliography

Table of Figures and Tables
Figures

Figure 1. Topographic representation of Race Rocks…….12

Figure 2. Representation of Anthopleura elegantissima and Anthopleura xanthogrammica …………………..14

Figure 3. Location of Populations at Race Rocks…18

Figure 4. Tidal Height graph ………………………. …23

Figure 5. Terrain Gradient graph (Population 1) ……25

Figure 6. Abundance graph (Population 1) …………..26

Figure 7. Elevation against # of Organisms graph (Population 1.27

Figure 8. % of Organisms at different Temperatures graph (Population 1) ……..28

Figure 9. Terrain Gradient graph (Population 2) …30

Figure 10. Abundance graph (Population 2)………31

Figure 11. Elevation against # of Organisms graph (Population 2) 32

Figure 12. % of Organisms at different Temperatures graph (Population 2) ……33

Figure 13. Terrain Gradient graph (Population 3) …….35

Figure 14. Abundance graph (Population 3) ……………36

Figure 15. Elevation against # of Organisms graph (Population 3)…37

Figure 16. % of Organisms at different Temperatures graph (Population 3) ……………………38

Figure 17. Elevation, Temperature and # of Organisms graph (Population 1) …………………40

?Figure 18. Elevation, Temperature and # of Organisms graph (Population 2) …………………41

Figure 19. Elevation, Temperature and # of Organisms graph (Population 3) ………………….42

Tables

Table 1. Data Collection for Population 1 ………24

Table 2. Data Collection for Population 2 ………29

Table 3. Data Collection for Population 3…………34

Acknowledgments
?I would like to express my sincere gratitude to Guillermo Montero and Garry Fletcher for immersing me in the fascinating world of ecology, and also for the support and direction that they provided me. I am also grateful to Sylvia Roach for her invaluable contribution not only to this work but for her constant encouragement.

?Finally, I would like to thank all the organisms at Race Rocks, especially Anthopleura elegantissima, for their patience and understanding of my investigations and for not complaining from my sometimes careless techniques.

Introduction

The Problem: Anthopleura elegantissima (common name: aggregating anemone) plays, along with all other biotic and abiotic components, an important role in the ecosystem to which it belongs. It is a highly valuable member of many food webs and participates in symbiotic relationships with other species. Taking this information into account, it would be useful to know facts about A. elegantissima in order to be able to predict and analyze trends in the ecosystem so as to gain an insightful knowledge about the species and its relation to the ecosystem found at Race Rocks.

Purpose and Background of the Study: To achieve the goals presented, a wide range of proposals were identified, leading to the decision to investigate the ecological niche as a focused and clear plan. The final design involved testing three populations at different locations of the island with the purpose of determining the preferred range of abiotic conditions for A. elegantissima. Four very significant variables were examined, all of them intimately related with intertidal zonation. These four variables were: the slope of the gradient, the tidal height, the time covered by sea water and the rock temperature. Carrying out the field work in three different sites allowed room for generalized conclusions about the species to be made.

Hypothesis: A null hypothesis for the Mann-Whitney test was formulated: “the three different locations are not inter-related and the similarities that may occur are merely coincidental.” If rejected, some conjectures about the species had to be formed. Given that Anthopleura elegantissima is a low inter tidal species, its range of positioning would not be between 1 to 3 meters. A hypothesis was made based on the fact that sea water is generally at about 10ƒ C, thus the rock temperature was not expected to be similar to this.

Assumptions: One of the major assumptions made was that the tide tables for Victoria, British Columbia, Canada are the same as these for Race Rocks. In theory this may not be true since Race Rocks is located approximately 10 km. away from Victoria. Therefore, there might exist a slight difference in tidal heights between the two zones.

Limitations: The entire experiment and data collection was done on the 27th of October, 1999, due to the limiting factor of relative low tides occurring in day-light hours. Hence the experiment could not be repeated on another day. Therefore, the research reveals the ecological niche of Anthopleura elegantissima at a fixed point in time and not the variations or changes in its distribution over a period of time. Furthermore, based on these results, the general ecological niche of the species cannot be concluded since all the data was gathered in a specific place, Race Rocks, which is a distinct site due to its location.

Another major limitation is that the “ecological niche” is an abstract term and therefore, the ecological niche of a species can never be fully represented. What was done in this case was to narrow the aspects to be considered and try to work with them by relating each factor to the others to acquire an approximation of the ecological niche. In this essay, four abiotic components were measured in order to obtain an insight to the ecological niche of Anthopleura elegantissima.

Definition of Terms: A number of terms should be defined at this point in order to ensure a clear understanding of this essay. One of these terms is population, which is defined as: all members of a species living in a particular area and making up one breeding group (Kucera, 1978). This is of particular importance since a similar species, Anthopleura xanthogrammica, may be found on the island, a phenomenon which would cause some distortions in the results if they are counted as Anthopleura elegantissima. Tides – the gravitational effects of the sun and moon on the oceans of the earth – are also a fundamental pivot in intertidal life. Tides along the Pacific coast of North America are of the mixed semidiurnal type; that is, there is a pronounced difference between the levels to which two successive low tides fall, and a lesser, but still apparent, difference between the levels reached by two successive high tides (Carefoot, 1977). Lastly, the most important term to be defined is ecological niche. The niche of a population or species is its functional role in an ecosystem. Using a human analogy, the niche is the species’ profession or way of life whereas the habitat is where this way of life is carried on — its address. The way a population responds to the various characteristics of its habitat is part of this population’s way of life and, therefore, of its niche. Hutchinson was the first to formally quantify the niche concept in terms of geometric space. The level of activity describes the ability of the individual to exploit the resources in a given level of each environmental factor (Odum, 1963). Then the niche space occupied by the species is the 3-dimensional space actually occupied by all individuals (Rickleffs, 1996). An empirical model (Box and Draper, 1989) can be obtained by the empirical determination of niche occupancy (number of individuals, in this case) in terms of n environmental variables (slope, tidal height, time covered and rock temperature).

Review of Literature and Related Research

Introduction, Information about the Organism: The field work was conducted at Race Rocks, Southern Vancouver Island, British Columbia, Canada. This area was chosen for ecological reserve status because of its unique richness and diversity of marine life. Race Rocks is ideally located to receive a constant supply of plankton swept past by almost continuous strong currents (up to 7 knots) . This provides nourishment for a complex group of underwater organisms.

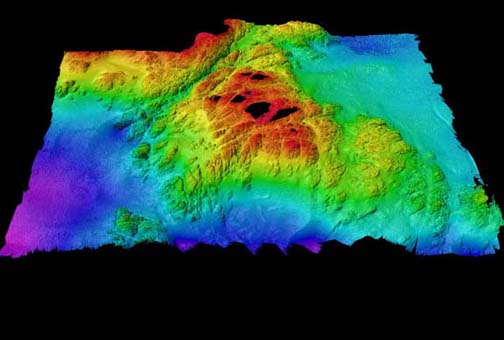
Figure 1. This image is a view from the South of Race Rocks looking Northward. Colors toward the blue scale are representing depths of almost 100 meters. (3d capture of entire area from south – 1x magnification – 3 x vertical exaggeration).

One of the many organisms found at Race Rocks are sea anemones. Sea anemones belong to the phylum known as the Cnidaria, from the cnida or stinging cells that are present in this major group of animals that also include corals, jellyfish, hydroids, medusae, and sea fans. Sea anemones, corals and their allies form the class know as the Anthozoa. Anthopleura elegantissima (Phylum Cnidaria, Class Anthozoa, Subclass Zoantharia, Order Actiniatia, Family Actiniidae) is abundant on rock faces or boulders, in tide pools or crevices, on wharf pilings, singly or in dense aggregations (Smith and Carlton, 1975). It is a species characteristic of middle intertidal zone of semi protected rocky shores of both bays and outer coast from Alaska to Baja California. Aggregating individuals do not exceed 6 centimeters in column diameter and 8 centimeters across the tentacular crown. The column is light green to white, and twice as long as wide when extended, with longitudinal rows of adhesive tubercles (verrucae) often bearing attached debris (Carefoot, 1977). The species presents numerous short tentacles, in five or more cycles, which are variously colored. Anthopleura elegantissima reproduces both sexually and asexually. In sexual reproduction, ova are present as early as February and grow steadily until their release in July; the ovarian is then resorbed and new eggs do not appear until the following February. Sperm are released through the summer. The asexual reproduction occurs by longitudinal fission. This process results in aggregations or clones of anemones pressed together in concentrations of several hundred per square meter. Anthopleura elegantissima feeds on copepods, isopods, amphipods, and other small animals that contact the tentacles. On the other hand, it is preyed upon by the nudibranch Aeolidia papillosa, which usually attacks the column, by the snail Epitonium tinctum, which attacks the tips of the tentacles, and by sea stars such as Dermasterias imbricata that can engulf an entire small anemone. Moreover, in some anemones, small pink amphipods, Allogaussia recondita, make a home in the gastro vascular cavity (Carefoot, 1977).

Figure 2. Schematic representation of Anthopleura elegantissima and Anthopleura xanthogrammica, the two major sea anemones found at Race Rocks.

The theory: In 1957, G. E. Hutchinson defined the niche concept formally. One could describe the activity range along every dimension of the environment. Physical and chemical factors such as temperature, humidity, salinity, and oxygen concentration, as well as biological factors such as prey species and resting background against which an individual may escape of predators, could be determined. Each of these dimensions could be thought of as one of the n-dimensions in space. Visualizing a space with more than three dimensions is difficult, thus the concept of the n-dimensional niche is an abstraction. We may, however, deal with multi-dimensional concepts mathematically and statistically, depicting their essence by physical or graphical representations in three or fewer dimensions. Moreover, Ricklefs notes that “… for example, a graph relating biological activity to a single environmental gradient represents the distribution of a species’ activity along one niche dimension. The level of activity, whether oxygen metabolism as a function of temperature or consumption rate as function of prey size, conveys the ability of an individual to exploit resources in a particular part of the niche space and, conversely, the degree to which the environment can support the population of that species. In two dimensions the individuals niche may be depicted as a hill with contours representing the various levels of biological activity. In three dimensions, we must think of a cloud in space whose density conveys niche utilization. Beyond three the mind boggles.”

(Ed note: See exercise on Ecological niche)

To be more precise, it should be recognized that there are three different definitions for the term niche. The first one (also known as “niche as community function”) comes from Elton (1927) defining it as the animal’s place in the biotic environment, its relation to food and enemies. The second definition is called “niche in the species” and reveals that a specific set of capabilities for extracting resources, for surviving hazard, and for competing, coupled with a corresponding set of needs (Colinvaux, 1982). The most used and known is the one defined by Hutchinson, which was explained previously. 

Research Results in Related Areas: Even though only one research paper was found containing information about Anthopleura elegantissima at Race Rocks, many investigations have been carried out with Anthopleura elegantissima and its physiology. The paper obtained on Anthopleura elegantissima at Race Rocks (Zahid, 1987) tries to detail the distribution of the species in one crack by two statistical methods (Plotless and Poisson techniques). It is concluded that A. elegantissima is an intertidal organism showing a clumped distribution. The clonal form, being lower mid-intertidal is exposed to sunlight and air much more than the solitary form in the sub-tidal zone. Hence, the clumped distribution is very useful and is also an important factor in reducing desiccation and water loss, as clumping reduces the surface area exposed to light.

Research Design and Procedures

The Setting and Population of the Study: The field work was designed to take place in three different locations of Race Rocks (see Figure 4), in order to gain a more detailed examination of the ecological niche of Anthopleura elegantissima in this island. Another reason for doing so was well explained by Odum: “It is also true that the same species may function differently —that is, occupy different niches- in different habitats or geographical regions.” The three places exhibit different environmental conditions and, therefore, the species may experience changes in its distribution. These changes could be current flow (which is in and of itself a major contributor to tidal life), light exposure, and even different rock composition.

A hazardous inconvenience that had to be overcome before doing the field work was to be able to distinguish among the two major types of sea anemones at Race Rocks, Anthopleura elegantissima and Anthopleura xanthogrammica. In order to achieve this, a key book was consulted. In the book, the distinctive characteristics between the two are described (see Appendix.)

 
Figure 3. Hand-made representation of Race Rocks showing the location of the three populations, the lighthouse and the docks.

Field Work: The complete field work took place on the 27th of October, 1999 due to the limiting factor of low tide level. The priorities were the elevation of the terrain and the number of organisms per quadrat in view of the fact that the tidal level was constantly altering, making the measurements inaccurate otherwise. The rock temperature was taken once these two sets of values had been gathered from the three locations. For the sake of help, a line transect was set in each crack to make the data collection uncomplicated and feasible.

Elevation: With the aim of measuring the elevation of the terrain for each population, a rudimentary, home-made apparatus was created. Due to the fact that the topography of the shore is extremely irregular at Race Rocks, it is not possible to assume that the elevation is a straight line. Thus, to have a detailed insight of Anthopleura elegantissima —or any other intertidal organism- at Race Rocks, an imperative factor to be considered is elevation. To approach this, the first action taken was to delimit the transect (generally a straight line along which observations are made in a systematic fashion) and the quadrats (starting from where the tidal level equals 0 meter). Since there was not a zero meter tide predicted, it was decided to start at 0945 approximately —tidal height equal to 2- and calculate the zero tide level. To accomplish the task, a two meter stick was used perpendicular to the sea water since tidal height is a vertical measure of water. Following this, a 4 meter stick was put where the tidal level equals 0 meter -quadrat number 15- (perpendicular to the sea water) and, with the help of a rope, a triangle was formed between the stick, the rope and the last quadrat —number 1. Once the triangle was finished, the elevation existing between quadrat number 1 and number 15 is known by the distance in the stick from the land to the conjuncture of it and the rope (for example, 3.9 in the first population). The subsequent measurements were much easier to carry since only a meter stick and a measuring tape were needed. Starting from quadrat number 1, a meter was measured with the measuring tape along the land. Then, the meter stick was put in such a manner that it formed a 90ƒ angle with the top of the quadrat, giving a number (0.3 in the first population). Therefore, 3.1 minus 0.3 equals 2.6, the elevation for quadrat number 2). So on and so forth the procedure was repeated until quadrat number 15 was reached.

Number of organisms: A very important feature involving the number of organisms per quadrat is the quadrat’s size. It was proven by Grey-Smith (1952) that the size of a quadrat could actually determine some erroneous conclusions in a population by using a series of progressively larger quadrats to measure the distribution in an artificial situation in which individuals were represented by colored disks. A reasonably good size for the quadrats was estimated to be 0.5 by 0.5 meters, given personal observation. Once the quadrats were sorted out, the counting took place. Only if more than 75 % of the organism was inside the quadrat was it counted. A difficult aspect of the counting was to differentiate individuals from the same group clone or aggregation. This difficulty was expected since the clones are held together very tightly and because at this time of the year young anemones are developing their bodies (as fertilization occurs during summer).

Rock temperature: This process was relatively simple compared to the previous two. It consisted of using the thermometer in small crevices in rocks —for each quadrat- in order to get the rock temperature.

?Time underwater: Aided by the tide table for the day (starting at 0500 and finishing at 2300), it is possible to calculate how much time a certain elevation is exposed to sea water. Assume that it is desirable to know the underwater time of a quadrat at 2.5. Then, we trace a line at 2.5 and the area under the curve will indicate the time that quadrat was covered by water.

Instruments Used: A simple technological apparatus was used for the field work. A measuring tape, a meter stick, a four meter stick, the tide tables for Victoria, BC, a thermometer, and a rope were all the required instruments.

Statistical Techniques Used: The technique used to verify that the distribution of the species was not random or by chance was the Mann-Whitney test. This non-parametric tool (meaning there are no specific distributional assumptions required) is sometimes called Wilcoxon test or rank sum test. This test relies on a special kind of transformation that replaces each observation by its rank in the combined sample. The purpose of this is to transform the data to a scale that eliminates the importance of the population distribution altogether (Ramsey and Schafer, 1997). In order to make it easier and more accurate, a web-page (VassarStats) was utilized to perform the calculations and the statistics values.


Analysis of Data

Introduction: The data will be presented by population and not by factor. This is aimed to help the understanding of the ecological niche of Anthopleura elegantissima at Race Rocks in a detailed and comprehensible fashion. Three separate populations were examined on different parts of the island The populations are numbered (1, 2 and 3) referring to a certain strip (see Figure 4.)

Findings: The Mann-Whitney test was used to determine whether or not there is a general trend between the three populations. Two populations were tested at a time, therefore, three runs of the test were conducted using the number of organisms as the variable to be ranked. Using VassarStats, an U value was calculated: 140.5 for populations 1 and 2, 96.5 for populations 1 and 3, and 44 for populations 2 and 3. These U values were then checked in the significance levels table:

n
5 per cent
1 per cent
15
185
170


By this, it is possible to conclude that, although it is impossible to be absolutely certain that the different is not due to chance, the probability is sufficiently small for it to be considered negligible. Thus, the null hypothesis can be rejected and assume that there are similarities among the three populations. Bearing that in mind, the variables should now be tested to determine the ecological niche of Anthopleura elegantissima at Race Rocks.

?Tidal Height:

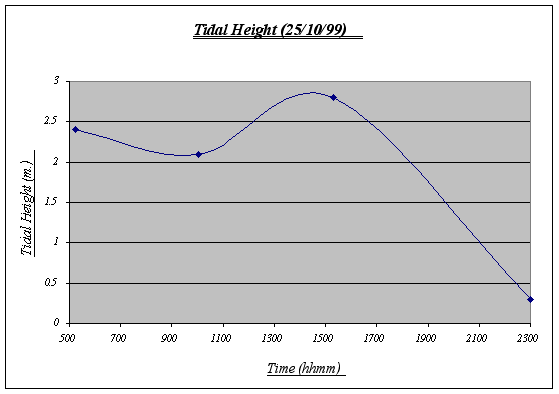
Figure 4.

The variations of the tidal height of the day are normal and reflect the constant water movement that take place in the ocean affecting inter tidal life. Based on this chart, the underwater time will be calculated. Note that the chart begins at 0500 and ends at 2300 (therefore, total time underwater = 18:00).

Population # 1:

Quadrat #
Elevation (m.)
Rock Temperature (ƒ C)
# of Organisms
Time Underwater
1
3.9
12
0
00:00
2
3.6
12
0
00:00
3
3.7
12
0
00:00
4
3.4
13
5
00:00
5
3.2
12
10
00:00
6
3.0
12
21
00:00
7
2.9
11
32
00:00
8
2.5
12
56
04:30
9
2.4
12
68
05:15
10
2.1
13
55
07:55
11
1.7
13
76
14:10
12
1.2
12
45
15:30
13
0.9
12
25
16:15
14
0.6
12
18
17:05
15
0.0
12
21
18:00
Mean Temp. 12.133

Table 1.
 
Figure 5.

The terrain gradient for population number 1 is the typical slope and is also the most regular among the three. It has a steep drop at the end (quadrat # 15) where it meets the sea water at 0 m. (tidal level). This gradient features some small tide pools and is sometimes covered by kelp beds. By personal observations, I could say that it is the strip with the highest level of species diversity on it.

Figure 6.

Even though this is not the most abundant population (432 individuals), it features the largest number of individuals per quadrat (76) and has an extremely large number of Anthopleura elegantissima at a certain level of the gradient. It should also be noted that no individuals were found in the first three quadrats and there were not many before quadrat 6. The number of organisms was measured in quadrats of 0.25 square meters.

Figure 7.
 

This graph clearly shows the relationship between elevation and number of organisms. It is easy to recognize that the preferred place for Anthopleura elegantissima is around 1.2 to 2.5 meters, a fact that will be very useful when making conjectures about its niche. The drop of abundance at 2.1 is only a local anomaly. At high heights (3.9, 3.6, etc.) there were no organisms present while at low heights there were some (however not very many).

Figure 8. (Note that 1 symbolizes 11ƒ C, 2 symbolizes 12ƒ C, and 3, 13ƒ C)
 

Despite the fact that a correlation could not be found between rock temperature and elevation or tidal height, an important feature was discovered, this being the relationship involving surface rock temperature and abundance. It was discovered that Anthopleura elegantissima prefers a rock temperature of 11, 12 or 13 because of the fact that these were the only temperatures found on the rocks (higher elevations were found to be warmer and A. elegantissima apparently does not favor such conditions).

Population # 2:

Quadrat #
Elevation (m.)
Rock Temperature
(ƒ C)
# of Organisms
Time Underwater
1
3.8
12
0
00:00
2
3.7
13
2
00:00
3
3.4
12
24
00:00
4
3.3
12
33
00:00
5
3.1
12
50
00:00
6
2.8
11
47
00:00
7
2.5
11
58
04:30
8
2.4
11
61
05:15
9
2.1
12
62
07:55
10
1.6
12
46
14:20
11
1.2
12
40
15:30
12
1.3
13
34
15:15
13
0.8
11
26
16:30
14
0.3
12
29
18:00
15
0.0
12
23
18:00
Mean Temp. 11.866

Table 2.
Figure 9.

This gradient features a large tide pool at 1.25 meters level. In it, a whole new ecosystem is found due to different climatic conditions, therefore, it may create some distortions with the number of Anthopleura elegantissima expected. A steep fall at the end should also be noted as a probable cause for the distribution of the species.

Figure 10.

In this population some irregularities are shown. Quadrats 6 and 13, for example, are not quite as expected. The virtual absence of organisms in quadrat 1 and 2 has to be considered as well. Overall, an inverted u-shaped curve could be distinguished.

Figure 11.

Again, the same trend as in population 1 is presented. A major distribution is seen at 2.1 to 2.8 meters and none or very few organisms were found at high elevations. On the other hand, a large number of the species was encountered at very low elevations


Figure 12.

These results reinforce the idea that Anthopleura elegantissima prefer a range of temperatures of 11-13ƒ C. No further analysis could be made since it is unlikely that a distinction could be drawn using greater detail such as degree by degree. On the other hand, at temperatures significantly different from the range above, the species will not be found.

?

Population # 3:

Quadrat #
Elevation (m.)
Rock Temperature (ƒ C)
# of Organisms
Time Underwater
1
3.6
13
4
00:00
2
3.3
13
11
00:00
3
3.2
13
20
00:00
4
2.9
12
31
00:00
5
2.7
12
33
00:00
6
2.2
12
25
09:45
7
2.2
11
28
09:45
8
1.9
12
22
13:30
9
1.8
12
16
13:50
10
1.4
11
19
15:00
11
1.0
12
23
16:00
12
0.9
12
15
16:15
13
0.6
12
12
17:05
14
0.4
12
10
17:30
15
0.0
12
10
18:00
Mean Temp. 12.066

Table 3.
Figure 13.
 

This gradient was the most irregular of the three, featuring ups and downs from the first to the last quadrat. A fact that seems rather curious is that on top of this strip sea lions lie down to rest quite frequently whereas this does not happen in the other two strips, probably because this gradient starts from a very plain, big rock. Kelp beds are observed floating on water and algae is seen at higher elevations.

Figure 14.

Although this graph does not show a perfect inverted u form, a general trend is seen. This population is the less abundant of the three and shows some irregularities in the middle quadrats.

Figure 15.

Apparently, more organisms prefer a range of 2.9 to 2.2 meters in this gradient. Some animals were found at 0.0 meters but not many were seen at higher heights. Two major drops, at 2.2 and 1.8 meters, can be explained due to overpopulation of other species in those two tide pools.

Figure 16.

Once again, no other temperature ranges were found, leading to the conclusion that Anthopleura elegantissima does prefer temperatures of 11deg C to 13deg  C.

Conclusions and Recommendations for Further Study

Interpretation and Implications of the Findings: After looking at the graphs, general descriptions of the ecological niche of A. elegantissima could be made:

ideal temperature for the species is a range of 11-13ƒ C because at higher or lower temperatures, the number of organisms decrease significantly. The null hypothesis is then rejected.

 Idyllic elevation goes from 1.5 to 2.8 meters. Once again, the null hypothesis is rejected.

Since time underwater is a function of elevation, it was not considered on graphs. However, the preferable time underwater for Anthopleura elegantissima was found to be 5 to 15 hours approximately (out of 18 hs.)

A clear description of the ecological niche dimensions is observed in the graphs below. The larger bubbles represent the portion of the space that the species prefers:


Figure 17

Figure 18
Figure 19.
 

Recommendations: If a thorough understanding of the ecological niche of Anthopleura elegantissima is desired, these and more variables should be tested to obtain a more profound and detailed approximation. Also, by determining ecological niches of other species such as Anthopleura xanthogrammica and comparing them, it is possible to predict niche overlapping, which is very likely to lead to a constant competition and aggressive behavior of the species. Moreover, it could be used to predict changes in the ecosystem if introduced species are brought. The documentation of data like this provides an invaluable record for establishing baseline distributions of organisms. Scientists are often required to monitor anthropogenic changes in sensitive marine environments. Similar niche patterns could be done on the other key invertebrates of the inter tidal and sub-tidal zone at Race Rocks, for example black leather chitons, limpets, abalone and various species of algae.

Appendix
This appendix presents the dichotomous key for Anthopleura elegantissima and Anthopleura xanthogrammica.

“Column green to white; tubercles usually in distinct longitudinal rows; tentacles with pink tips; height up to about 5 cm; often in aggregating masses, and frequently buried by sand covering rocks to which they are attached Anthopleura elegantissima. ~~ Column green or olive green; tubercles usually not in distinct longitudinal rows; tentacles uniform in color and not pink-tipped; height regularly exceeding 5 cm; solitary and not often buried in sand Anthopleura xanthogrammica.”

Boughey, A.S. 1968. “Ecology of populations.” The Macmillan Company, New York.
Buschsbaum, R., Buschsbaum, M., Pearse, J, and Pearse, V. 1987. “Animals without backbones.” University of Chicago Press, Chicago, Illinois.

Carefoot, T. 1977. “Pacific seashores.” J.J. Douglas, Vancouver, BC, Canada.?

Colinvaux, P. 1986. “Ecology.” John Wiley & Sons, United States of America.

Francis, L. 1973. “Clone specific segregation in the sea anemone Anthopleura elegantissima.” Biological bulletin. 144, 64-72.

Francis, L. 1973. “Intraspecific and its effects on the distribution of Anthopleura elegantissima and some related sea anemones.” Biological bulletin. 144, 73-92.

Kozloff, E.N. 1974. “Keys to marine invertebrates of Puget Sound, the San Juan Archipelago, and adjacent regions.” University of Washington Press, Washington State.

Kozloff, E.N. 1993. “Seashore life of the Northern Pacific Coast.” University of Washington Press, Seattle, Washington State.

?Kucera, C. L. 1978. “The challenge of ecology.” The C. V. Mosby Company, Saint Louis.

Lewis, J.P. 1995. “La biosfera y sus ecosistemas: una introducción a la ecología.” Ecosur, Rosario, Argentina.

Odum, E. P. 1963. “Ecology.” Holt, Rinehart and Winston, United State of America.

Odum, E.P. 1989. “Ecology and our endangered life-support systems.” Sinauer, Sunderland, Massachusetts.

Pianka, E. R. 1986. “Ecology and natural history of desert lizards.” Princeton University Press, Princeton, NJ.

Smith, R.I., and Carlton, J.T. 1975. “Intertidal invertebrates of the Central California Coast.” University of California Press, Los Angeles, California.

Zahid, M. 1987. “Distribution of Anthopleura elegantissima.” Extended Essay for the International Baccalaureate.

GO to the Ecological Monitoring Site 

The Race Rocks Ecological Overview Project Identification Information

LOCATION: L.B. Pearson College Library

CALLNUMBER : 577.7 Fle RREO CDROMlor

The Race Rocks Ecological Overview
ABSTRACT:

On September 1, 1998, the Minister of Fisheries and Oceans Canada, the Honourable David Anderson proclaimed the creation of the two first Pilot Study Marine Protected Areas in Canada. Race Rocks ecological reserve was designated as one of those area. As part of the pilot process following this announcement, the Department of Fisheries and Oceans has requested that a complete ecological overview would be done of each of the pilot areas. This metadatabase, the Race Rocks Ecological Overview was designed to assemble in one place a searchable database on the ecological research, education and other activities that have occurred at RaceRocks. Included also are references to the immediate surrounding marine area of the existing ecological reserve, the eastern entrance of the Strait of Juan de Fuca, and the adjacent shoreline of Vancouver Island, in particular the peninsula of Rocky Point. The time frame for these ecological references is from it’s use as an area by First Nations people through its establishment as a light station by the British Navy in 1860, to it’s designation as an Ecological Reserve by the province of British Columbia in 1980, up to the present time, 1999, as a pilot Marine Protected Area. Along with the database, a set of references has been assembled for the primary collection in the Norman McKee-Lang library at Lester B. Pearson College of the Pacific in Victoria. An additional set of reference materials has been made available to Fisheries and Oceans Canada, and CDs of this version are being distributed to workshop attendees. April 19,1999 Race Rocks, Metchosin , British Columbia, Canada

Keywords: Race Rocks, Juan de Fuca , MPA, Lester B. Pearson College,marine park,ecological reserve Author: Garry L. Fletcher
Ackknowledgements:
Many individuals have contributed to the construction of this metadatabase, and no doubt some will be omitted from this listing, but I deeply appreciate all their contributions. Norm Healey of Royal Roads University has played a major role in the design in MSAccess, and in programming the searching capabilities. He has dealt with problems inherent in my original database design and has patiently taught me along the way. For the provision of linked databases, I wish to thank Norm and the Metchosin Environmental Advisory Commission for the MEAC database, the Staff at the Canadian Conservation Data Centre, for the addition of the Database from CDC, and Ron Perkins of IOS for the Race Rocks Salinity and Temperature Database. B.C. Parks, Jacques Marc and Trev and Flo Anderson have kindly made their slide sets available to be catalogued in this database. The RBC museum, and Duane Prentice have also provided their copyrighted slides for the database with a permanent set being made available through our library. Also the switchboard page photo was derived from an image taken by Brent Cooke of the RBC museum. John Ford and Robin Baird provided a large portion of the marine mammal materials, Scott Wallace helped with a workshop presentation and research materials. Dee Walmsley provided contacts for references. Sylvia Roach of Lester Pearson College has provided many hours for the scanning, optical character recognition and html of the major references and the herbarium database. She has also done the OCR and Brailling for the selected references. Bette Kirchner, Pearson College librarian has catalogued the reference data and Jolanta Lisiewicz, has assembled the library references and typed abstracts for the database. Becky Macoun, a former student now in Vancouver has done library research for the database. Chris Blondeau, diving instructor at Pearson College has helped me to free up time by assisting with the diving and with the Race Rocks Schools program administrative duties that have been ongoing. Angus Matthews, college administrator has helped with contacts with First Nations and in making his correspondence and records available. Tom Sampson has assisted in educating us about the role of marine resources of the area in First Nations culture. The administrative staff of Pearson College has provided support throughout the project. Lester Pearson College students of the environmental systems and biology classes have provided me with support throughout the last two months on this project and will have a major role to play in it’s ongoing development and updating. In particular, students Martin Kryl and Victor Rakou helped with scanning and some of the data entry. Cynthia Wright of IOS has helped with editing.. Most importantly, my family has been patient and understanding with my preoccupation in getting the first version of this database completed, and Sarah and Alex have contributed greatly to the data entry in the slide collection.

-Garry Fletcher, April, 1999 —-Lester B. Pearson College

STATUS: Version, 1.5 , Completed Aug 4, 1999-
Updating: ongoing –Bio Dept. Lester B. Pearson College-

PUBLICATION INFORMATION: This publication, The Race Rocks Ecological Overview, Version 1.5 has been produced under Contract F1011-9-06 from the Department of Fisheries and Oceans, Institute of Ocean Sciences, Sidney, B.C.

Copyright 1999 Her Majesty The Queen in Right of Canada as represented by the Minister of Fisheries and Oceans.
Images Copyright 1999 by Lester B. Pearson College except as specifically noted.
ORIGINATOR: Garry L. Fletcher, faculty member in biology and environmental systems at Lester B. Pearson College. (retired 2004)
ADDRESS:
650 Pearson College Drive
Victoria, B.C.
British Columbia , Canada
V9C 4H7

DATE:08/08/99

Return to the Workshop agenda

Scott Wallace: Research on Abalone in BC Reserves.

Scott Wallace did research in 1997 and 1998 at Race Rocks with Pearson College divers. He studied the population dynamics of the Northern Abalone,Haliotis kamtchatkana. His research was done as part of a PhD thesis in Resource Management from the University of British Columbia in Vancouver.

Wallace, S. S. 1999. Fisheries Impacts on Marine Ecosystems and Biological Diversity:
The role for marine protected areas in British Columbia. Ph.D. Dissertation. The University of British Columbia. Pp. 198.

Wallace, Scott, S. 1999, Evaluating the Effects of Three Forms of Marine Reserve on Northern Abalone Populations in British Columbia, Canada.

graphsizedistribConservation Biology, Vol 13 No 4, August, 1999, pages 882-887.

ABSTRACT: :Marine reserves have been suggested as tools for assisting the management of fisheries by protecting vulnerable marine species from overexploitation. Although there is a theoretical basis for believing that marine reserves may serve as management tools, there are few marine reserves in the world in which to test their effectiveness. My research evaluated three forms of marine reserve on the south coast of Vancouver Island, British Columbia, Canada. I used northern abalone (Haliotis kamtschatkana), a severely depleted shellfish in this region, as an indicator of the effectiveness of the reserves. Abalone populations in eight sites receiving different degrees of spatial protection were counted and measured in situ during the spring of 1996 and 1997. In all sites with enforced harvest closures, populations of abalone were greater, and one site with nearly 40 years of protection had on average much larger (older) abalone. Reproductive output, as a function of abundance and size, was also greater in the enforced reserve areas. Larval dispersal from reserves, and hence the benefit to exploited areas, was not formally surveyed. Nevertheless, the results of my study, combined with knowledge of present abalone populations, life history, and regional hydrodynamics, suggest that establishment of reserves is justified in the absence of perfect knowledge of larval dispersal. (Link to fulll article)

See the Abalone taxonomy file for videos of Scott’s work.

https://www.racerocks.ca/haliotis-kamtschatkana-northern-abalone-the-race-rocks-taxonomy/

Gaps in Research for the Race Rocks Pilot Marine Protected Area.

The workshop addressed the issue of gaps in research in the afternoon session. The following discussion summarizes points raised in that session and suggests some further actions to be taken. This list is by no means definitive, but it attempts to emphasize the many facets of the ecosystem that is present. Certainly it is not hard to find areas within the reserve that could bear further study since so little has actually been published on the area.
1. Minimal Impact Research: From the survey of literature required for this project and from my experience over the past several years, the most apparent need in the Race Rocks area is for activities that can be carried out with very minimal impact. The total area of the present reserve is rather limited leading to a restriction of the area to non-consumptive research. We have worked since 1986 with Dr. Anita Brinckmann-Voss under permit, on the ecology and taxonomy of the hydroids in the reserve. Her sampling has been very restricted to small sized samples. Low impact, non-consumptive research like this should be encouraged. Robin Baird has also been responsible over the past few years for doing extensive marine mammal research in the area. Many of his papers are referred to in the database.

2. Military Blasting: The effects of military blasting on the seabirds and mammal population as well as on the subsurface community should be investigated further. Part of such a study was contracted by the military last year, but no results have been received to date. In addition, feedback from one participant after the workshop indicated that there is a need for research on the receiving ecosystem of all the compounds and breakdown products from blasting and demolition in the rocky point area.
3. Bioassays for pollution: Communication with Norm Healey after the workshop brought forward the idea of doing tissue sampling of invertebrates in the reserve. The large population of californianus mussels could provide samples for the testing of the presence of a wide range of human-generated chemicals.

4. Ecological baseline Studies: Pearson College science classes have been able to do some preliminary studies, and have many records in raw data form from baseline transect work done intertidally and subtidally. More extensive work with outside expertise on a long-term basis should be planned.

5. Taxonomic studies of many invertebrate groups such as colonial ascdians should be promoted. There are still extensive areas that could be sampled for Bryozoan and Hydrozoan forms. Research by Dr. Anita Brinckmann Voss that turned up new species and new records for North America would tend to indicate that there may be new occurances of other invertebrate or even vertebrate groups .

7. Plankton studies, especially with underwater monitoring of daily fluctuations and primary productivity investigations could be done at Race Rocks. Since we operate a saltwater pump, for part of the year, an instrument that monitors daily chlorophyll changes could be installed. This could be useful in conjunction with ground-truthing for satellite productivity studies in the Strait of Juan de Fuca. The upper tidepools have always been excellent sources of Pyramimonas sp flagellates. The distribution of this species is probably rather restricted along the coast of British Columbia. In this location, the organisms are available in the guano-nourished upper tidepools for much of the year.
8. Macroalgae: A wide range of macroalgae is abundant in the intertidal areas of Race Rocks. Also, they are easily accessible for research. A small herbarium has been established with samples from Race Rocks over the past years. A more concentrated effort to complete the collection with adequate representation from all species could be possible.
9. Climatalogical studies: The location and relative security of the light station could lead too more detailed data being gathered using underwater arrays for sensors.

10. Alternative Energy: This has a practical aspect as well, since the sustainability of the reserve depends on a source of an inexpensive and renewable source of energy. Research into the effectiveness of different prototypes would be an appropriate avenue to pursue.

11. Ecotourism Impact : There is an obvious need for this due to the ever-increasing use of the area as “Plan B” on the whale- watching itinerary. Furthermore, those benefiting from this activity should be contributing to research to determine the appropriate levels for sustainability for this industry.

12. Hydrography and Geology. Over the past month we have certainly seen an extraordinary amount of activity in this area. This could stimulate the interest in more research in the waters of greater depth surrounding the main islands. Missing from the research done in the spring of 1999 was a thorough biological survey of the areas in water over 20 meters in depth at Race Rocks. It would not be inappropriate to seek to have some filming done in areas over 20 meters in depth. This is important since we should be aware of the type of life distributed there if boaters and fishermen are going to be allowed to anchor in the deeper waters. This concern is real since there is an increasing concentration of halibut fishers in the area working the 30 to 100 meter depth.

13. Marine Mammal Research. Chris Malcolm and others from the Whale Research Lab indicated an interest in making contact with Pearson College in the fall term to help out with the fall university field trip.

Projects for the Islands

  • Ecological restoration: Last fall (1998) we were able to take Cornelia Oberlander, a prominent landscape architect from Vancouver, to Race Rocks to help us envision what would be the best way to manage the landscape. She has designed the grounds for the Museum of Man in Ottawa and other major projects where she specializes in blending human structures into the natural landscape. Reduction of some invasive species and replanting of some of the native fescue grasses that have been eliminated by mowing and introduced grasses was certainly a priority. This would be a good opportunity for a project for students in environmental design. The area of the diesel tank storage, which is to be removed by Coastguard, was a prime area mentioned for restoration to a rocky outcrop ecosystem. When Pearson College became involved in managing the island in 1996, a decision was made to stop the grass cutting, which previously had been the policy of the coastguard. With the cessation of using the grass whips around the rocky outcroppings on the island, there is gradually starting to be a return to some of the species that are only seen on a limited basis on the south coast of Vancouver Island. In April of 1999 for instance, a new clump of Romanzoffia, a blue- listed species has been noted South of the guest residence. Armeria sp. (thrift) has also increased in number on the rock outcrops since the cessation of the grass cutting.
  • Marine history: Several projects initiated in the past two years by Pearson College students and Faculty have been directed at preserving some of the unique marine heritage of the islands. The weather station room has been converted into a museum where historic photos of the island are on display and two areas outside have had improvements done to preserve past artifacts. Bricks from the original engine room now form a patio around the old flywheel, and a small alcove near the foghorn is the repository for various scattered pieces of equipment form the engine room that were scattered about the island. With some research, a request could be made to the Coast Guard and the Maritime Museum to return some artifacts to the station museum .
  • Technology for Low Impact : For the discussion on potential areas for research, see the paper in the database and the appendix of this report entitled : Technology for Sustainability. It emphasizes the need for technology to be used to reduce the impact of people in the reserve. It outlines ideas about developing a virtual research site at Race Rocks.
  • First Nations resources and education. With the appropriate use of technology , the reserve could become an important focus for the traditions of first nations people.Some Actions that need to be taken:
  • The permit system through ecological reserves has existed and has often worked well over the past years. A copy of the permit is available on the Race Rocks website and is included in the appendix. Unfortunately some still ignore applying for permits for filming or other commercial uses. The design of the permit does not need to be excessively overburdened with bureaucracy, but it should be consistently applied. There needs to be a clear way for a responsible person who has a broad overview of all aspects of the reserve to sort out legitimate permit requests, and the process needs to be obvious to all, especially in the scientific community. I wish to caution against the need of a large committee to sort out requests as this could unduly impede the progress benefits to the reserve.
  • It was emphasized that it is the responsibility of Fisheries to implement a way to have commercial users of the reserve contribute to it’s upkeep. In particular, an immediate plan to implement a nominal user fee for commercial operations involving marine mammal watching. The funds from this revenue could help to offset the cost of keeping people employed to be manager-guardians of the island. The example of the one dollar per seat charge at Tofino was given. Money collected by the charter boats helps in the ongoing research in the area.
  • The ecosystem is resilient for certain activities at various times of the year, but seasonality of events especially as they pertain to Great Race Rocks has to take top priority in determining human entry to the island and use of it’s facilities. Seabird nesting in the summer, concentrated Sea lion haulout in the fall, harbour seal birthing in the late spring limit the level of human entry to the main island. It should also become immediate policy that access to the outlying islands should be exclusively by permit.
  • The continued presence of guardian managers on the island is valued highly. Several participants were concerned that the reserve’s unique biological diversity could be preserved by an MPA but only if there were immediate plans forthcoming to provide for a continued presence of guardians on the island.
  • The establishment of a buffer zone around the area has to be carefully considered. The visuals presented by Jim Galloway, and the other members of the hydrography team, suggested to many that a logical boundary for the reserve exists at the limit of the rock margin of the island. This would represent a significant increase in size, but could be limited in the kinds of activity, anchoring, fishing or shellfish harvesting.
  • The Race Rocks Ecological Reserve Management Plan prepared in 1998 was included in the materials handed out at the workshop. This plan is also included in the electronic database, and is attached as an appendix in this report. There wasn’t sufficient time in the workshop to review the Management Plan, but it is to be hoped that wider distribution of the draft copy will encourage a re-working of the document to be done very soon. Participants were urged to use that plan as a basis for developing a new MPA Management Plan.

Garry Fletcher, April, 1999

Marine Mammal Research Publications Relating to Race Rocks

Michael A. Bigg 1985 Status of theSteller Sea Lion (Eumetopias jubatus) andCalifornia Sea Lion (Zalophus californianus) in British Columbia
Peter F Olesiuk and Michael A. Bigg  1990 MARINE MAMMALS IN BRITISH COLUMBIA
Baird,R.W., and P.J. Stacey. 1989. Observations on the reactions of sea lions, Zalophus californianus and Eumetopias jubatus, to killer whales, Orcinus orca, evidence of “prey” having a “search image” for predators. Canadian Field- Naturalist 103:426-428.
Baird,Robin W. 1990 Elephant Seals Around Southern Vancouver Island
Baird,R.W., and L.M. Dill 1995. Occurrence and behaviour of transient killer whales: seasonal and pod-specific variability, foraging behaviour and prey handling. Canadian Journal of Zoology 73:1300-1311. This publication specifically mentions Race Rocks and includes it on a map.
Baird,R.W., and L.M. Dill. 1996 . Ecological and social determinants of group size in transient killer whales. Behavioral Ecology 7: 408-416.
Baird, Robin W. and M. Bradley Hanson 1997 Status of the Northern Fur Seal, Callorhinus ursinus, in Canada,Canadian Field-Naturalist 111:263-269.
Baird,R.W., and H. Whitehead. 2000. Social organization of mammal-eating killer whales: group stability and dispersal patterns. Canadian Journal of Zoology 78:2096-2105.

Color Polymorphism in the Intertidal Snail Littorina sitkana at Race Rocks

Patterns of Color Polymorphism in the Intertidal Snail Littorina sitkana in the Race Rocks Marine Protected Area.

Extended Essay done by: Giovanni Rosso, Lester Pearson College, 1998 .
The complete version of the research is available in the Library at the college.

Abstract:
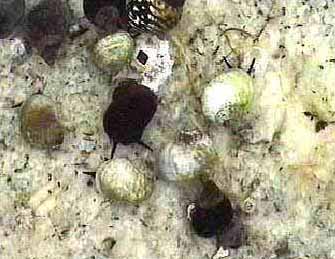
As with most intertidal gastropods, Littorina sitkana shows remarkable variations in shell color. This occurs both in microhabitats which are exposed or sheltered from wave action. There seemed to be a close link between the shell coloration of the periwinkle and the color of the background substrate. Field work was carried out on the Race Rocks Marine Protected Area in order to investigate patterns of color polymorphism. Evidence from previous studies was used to support interpretations and understand certain behaviors.
The results showed that in the study site there was a very strong relation between the shades of the shells and the colors of the rocks. Light colored shells stayed on light shaded rocks and vice versa. An interesting pattern was noticed with the white morphs. These were rare along the coast
(only 2%), but were present in relatively high numbers in tidepools of white quartz. From previous experience (Ron J.Etter,1988), these morphs seem to have developed as evolutionary response a higher resistance to physiological stress from drastic temperature changes between tides. Some results showed that the white morph is present in an unexpectedly high percentage at the juvenile stage, but then their number decreases dramatically. As in Etter’s study more research needs to be made on the role visual predators have in this phenomenon.

ROSSO, Giovanni Edoardo 0034 -083

Patterns of Color Polymorphism in the Intertidal Snail Littorina littorea at

the Race Rocks Marine Protected Area.


AN EXTENDED ESSAY PREPARED FOR THE INTERNATIONAL BACCALAUREATE


Candidate number: 0034 – 083 February 1999

Name: Rosso, Giovanni Edoardo
Best language: Italian
School: Lester B. Pearson College of the Pacific
Subject: Environmental Systems
Supervisor: Mr. Garry Fletcher

Table of contents:

Abstract ————————————————————— 3

Introduction ———————————————————- 4

Materials and methods ———————————————- 5

Data analysis ———————————————————- 7

Conclusion ———————————————————– 12

Observations ——————————————————— 13

Evaluation ———————————————————— 16

Suggestions for further studies ———————————— 16

Acknowledgments ——- ——————————————- 18

Literature cited —————————————————— 18

Appendix ————————————————————- 19

2

Abstract:

As most intertidal gastropods, the Littorina littorea shows remarkable variation in shell color. This occurs in both microhabitats that are exposed or sheltered from wave action. There appeared to be a close link between the shell coloration of the periwinkle and the color of the background surface. Fieldwork was carried out at the Race Rocks Marine Protected Area in order to investigate patterns of color polymorphism. Evidence from previous studies was also taken into account to better support interpretations and understand certain behaviors.

The results showed that in the study site there was a very strong relation between the color of the shells and the color of the rocks. Light colored shells lived on light shaded rocks and vice versa. An interesting pattern was noticed on the white morphs. These were rare along the coast (Only 2%), but were present in relatively high numbers in tidepools set in white quartz. From previous experience (Ron J Etter, 1988 ), these morphs seem to have developed, as an evolutionary response, a higher resistance to physiological stress from drastic temperature changes between tides. Some results showed that the white morph is present in an unexpectedly high percentage at the juvenile stage, but then their number decreases dramatically with age. As in Etter’s study, more research needs to be done on the role of visual predators in this phenomenon.

3

Introduction:

There is strong evidence to prove that intertidal gastropods are highly polymorphic for shell coloration (Ron J Etter, 1987). Even within a single species it is not uncommon to find considerable shell color variation in a single trait (Laurie Burham, 1988 ). In the genus Littorina the color of the shell often appears to be parallel to the one of the background (Heller, 1975; Smith, 1976; Reimehen, 1979; Hughes and Mather, 1986 ). Nevertheless the causes and patterns of color polymorphism. in intertidal gastropods are still a fairly unexplored field. Many paths have been undertaken to make some light upon these obscure areas. The most common interpretation was always the presence of visual predators (Ron J Etter, 1987) like birds and fish. Others investigated on the effects of the shells diets. But more recent studies ( Rowland, 1976; Ossborne, 1977; Berry, 1983 ; Etter, unpubl. ) have shown that diet virtually does not affect the shell coloration, although the intensity of pigmentation might be slightly altered. Finally, physiological stress has been introduced as a possible cause color polymorphism. A very interesting study, made by Ron J. Etter on the intertidal snail Nucella Lapillus, shows how the white coloration suffers much less from temperature variations in dry micro habitats as opposed to the brown morphs. With his work he gave some revolutionary insights on the distribution of the shells according to their color.

In my fieldwork I chose to disprove the null hypothesis that there is no link between the color of the periwinkle and the color of the substrate it is living on. In order to do this I sampled a great quantity of empty shells and scaled their color from I to 27. 1 then chose five rocky coastal areas, each of a different shade. I analyzed the color of the live shells on each of the chosen rocks, scaled them according to their color and then graphed the results. I also observed the young shells in the inside of barnacles and took notice of their color frequencies in relation to their quantity. I ended my study looking in some tide pools and recording new surprising results. I concluded that:

There is a link between the color of the shell and the background color.4

I roughly calculated that between one station and the other there was a change in tide level of 13 cm. I therefore kept this in account and lowered the quadrat accordingly into the water.

Data analysis-

Rock – 1 (Black)

The rock contained a creek were I noticed a very high density of periwinkles in a very limited area. In the inside of the creek they were almost piled and glued on top of each other. With the help of a pen I extracted them and laid them on a white sheet of paper. Once I accomplished the process of identification I put them back. I noticed that the bigger shells (10 to 14 mm wide) were located on top of the smaller ones (3 to 6 mm wide). This made me think that the bigger ones wanted to protect the smaller ones from swells and predators. It actually does work as a protection system, but it surely is not because of the kind nature of periwinkles. It is obviously a matter of physical size.

Rock #1 -Shade #1


From the graph we see that the black rock hosted the darkest shades, from 1 to 5. The average number of individuals per shade is 7.6. The average shell color is 3.

7


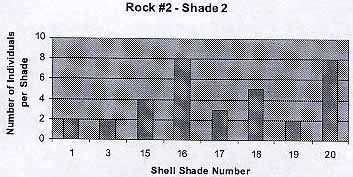
Rock # 2- Dark grey

As opposed to the previous case the surface of rock # 2 was rather flat. Population was regularly distributed. All shells seemed to be above 5 mm in width. Here I had the opportunity to understand the great resistance that periwinkles have to salinity changes. In fact some of the shells were located under the flow of a fresh water pipe. It might have been a coincidence but these shells were slightly bigger (7 to 12mm wide).

Rock #2 – Shade 2

.


The graph shows that there are some exceptions (Color 1, 3) to the trend that has been shown in the previous graph. I guessed that these are the cases of lucky shells that have not jet been seen by birds or fish. The average number of individuals per shade is 4.25 . The average shell color is 13.6 .

Rock – 3 (Brownish red)

The reddish color of the rock came from many small algae that covered its surface. I did not notice any irregular patterns in distribution. The shells seemed to be above 5 mm in width.

8


The background color was parallel to the shade of the periwinkles. Color 1 and 20 appear to be exceptions: only three individuals in total. The average number of individuals per shade is 4.4 . The average shell color is 9.4.

Rock – 4 (Light brown)

Rock #3 -Shade 3


The surface of the rock was very irregular.. Some areas were covered with dead barnacles ( Balanus sp. ). I noticed that here the shells were smaller in size and they tended to be gathered around the barnacles. Nevertheless I repeated the process.

Rock #4 -Shade 4


9

The population reflects the previous trends. The average number of individuals per shade is 3.8. The average shell color is 11.3.


Rock – 5 (White rock with dark patches)

This rock was one of the most interesting ones. In fact, the two different shades of the rock gave place to a particular phenomenon that clearly disproved the null hypothesis. I tried to be as precise as I could in distinguishing the shells on the white and dark spots. I noticed the net distinction between the color polymorphism on the two areas.

Rock #5 -Shade 5


In the light patches the average number of individuals was 4.3. The average shell color was 23. In the dark areas the average number of individuals was 4.8. The average shell color was 3.

If the color of the shell would be directly proportional to the one of the rock, the average shell colors would be:

Ideal Model

10


Rock 1

3
Rock 2 13
Rock 3 8
Rock 4 18.5
Rock 5 24.5 / 3

Actual Model

In the actual experiment the averages were:

Rock 1

7.6
Rock 2 13.6
Rock 3 9.4
Rock 4 11.3
Rock 5 23 / 4.8

I assume that the dark grey rock is actually lighter than the brownish red

one. If we observe the results we understand that that:

Rock Number
Actual Shade
Ideal One Error
1 7.6 3 4.6
2 13.6 13 0.6
3 9.4 8 1.4
4 11.3 18.5 7.2
5 23 / 4.8 24.5 / 3 1 / 1.8


Considering that a minority of the shell color numbers was far away from the average: the average error is of 2.8. This means that on average the actual color was 2.8 units away from the ideal one, therefore disproving the null hypothesis. (Chi square test was used to verify the results.)

11

Conclusions:

The data analysis clearly shows that in the Race Rocks area there is a very strong relation between the color of the shell and the color of the background they are standing on. The shells with light shades are found on light colored rocks. The same relation is true also for the opposite extreme case were we find black shells on black rocks.

I feel that the model we can create from this experience is relevant above all because the consequences of human presence are reduced to very low levels. In fact, I have been operating in a Marine Protected Area were not many people go. The area is relatively free both from water and air pollution. The only predators are the natural ones. Besides this, the ecosystem is intact and the populations of all the organisms are at almost climax level. The amount of visual predators includes crabs, sea gulls, black oystercatchers, pigeon guillmonts, otters and fish.

From the observations made (p. 13, second part) on the entirely white morphs, we may deduce that there is a strong link between what Ron J. Etter found out on the Nucella lapillus and the Littorina littorea. Putting the pieces of the puzzle together we notice that the distribution of periwinkles is obviously affected by numerous reasons. There seems to be a wide color gap between the shades 1 to 26 and 27. The first twenty-six, when wet, are not very different from each other. The white morph instead is clearly identifiable both when it is wet or dry. If we keep in account that the vast majority of the coastal area on Race Rocks is dark, obviously it will be easier to for shells 1 to 26 hide. The white shells instead have such a great disadvantage that only 2% survive. Keeping in account Etter’s results we may conclude that, excluding a minority of extraordinary circumstances, all these deaths are caused by predators. In fact, when the juvenile periwinkles leave the barnacles, their shell is still soft. Now, if the white periwinkles are born near an area of white surface, then their chances of being seen decrease and actual groupings of white shells may be noticed. The color of their shell also allows them to bare physiological stress much better than the darker shades. The stress comes from the drastic changes in temperature between tide variations. In the case of the Nucella lapillus, in Etter’s experiment, the white shells inhabited most of the sheltered areas and, as previously mentioned, dry areas. This could also apply to the Littorina littorea, but on the Race Rocks Island the sheltered areas are very few and the number of predators is high. The white quartz is the only substrate that can host them (once they leave the Balanus sp.). I feel that if the ocean conditions were not as rough and there would be fewer

12

predators, the white morphs would also be seen on the darker rocks. In the tide pool both the white morph and the dark one live together The mortality of the last though is obviously higher, both for predation and stress (Ron J Etter).

In the dark areas the presence of the white morph is almost nonexistent (2%). But the shells belonging to shades 1 to 26 are distributed according to a remarkable pattern. On light colored rocks we will find shells that belong to the high numbers. In the opposite case the same trend applies. – In the area I took in exam this close relation is probably emphasized by the high intensity of predation. The contrasts are easily spotted and eliminated. Therefore, in the absence of predators, I think that the darker shells would be able to live on any color surface. Of course the dark population would suffer more in the dry areas as opposed to the lower levels.

Observations:

As I was watching the newborn shells (about 1 mm wide) in the dead barnacles I found out that the presence of white shells is unexpectedly high at this stage. I tried counting them and recording the results. On average a dead 20-mm wide Balanus sp. holds between four and eight shells of Littorina littorea. I analyzed ten samples in two different areas and recorded the number of white juvenile shells:

Area

Total number of shells Number of white shells
1 5 2
6 2
8 4
4 3
4 1
5 3
6 4
7 3
6 2
8 5
2 4 2
7 4
8 5
3 0
5 3
7 4
8 4
6 3
4 3
9 5


In the first area the average Balanus sp. held 5.9 periwinkles and 2.9

were white or very light colored. The percentage of white shell was of 49.

In the second area the average Balanus sp. held 6.1 periwinkles and

3.3 were white. The percentage of white shells was of 54.

The results show that on average 51.5% of the shells are white. If we

make an exception for the tidepools, the percentage of white shells present

on the protected coastal areas is 2 (This is an approximate calculation made

when collecting the dead samples and when counting the live ones). This

means that 49.5% are eaten or die before reaching a sufficient size to move

in an area where they would be protected by the background they are

standing on. According to the study made by Ron J. Etter on the intertidal

snail, Nucella lapillus, when the brown morphs and the white ones were put

on the same exposed coastal area, there were virtually no differences in the

mortality rates of the two. If we dare to make a parallel between the two

species, it would be therefore wrong to assume that the white morphs die

because of natural causes such as diseases or disadaptation. It is my opinion

that literally 49.5% of the white morphs is victims of visual predators

because they can easily be seen before reaching an area where they would

camouflage. In this case, I am not including tide pools with white bottom

and where the water is shallow. I am referring to the morph with shade 27,

which is not common along the coast probably because of the lack of

almost entirely white rocks.

On the other hand I mentioned tied pools because of a specific reason. In

fact, on the Southwestern part of the island there are six tide pools, each

with different depths and different consequent bottom coloration. During

the days of the experiment this area was inaccessible for the presence of

about 75 California sea lions and about 23 Stellar. Nevertheless, in previous

visits to the island for other reasons (the reserve is in fact managed by

Pearson College and is used for several academic programs, projects and

environmentally oriented diving) I had the opportunity to observe the

presence in tide pool – 4 of about 20 entirely white shells of Littorina littorea

standing on white quartz. This had originated a question that had long

14

remained without an answer. Why can the white periwinkles be found only in this tide pool (if we exclude the two- percent I was talking about before)? The most common explanation was based on the presence of certain minerals, difficult predation and a genetic mutation that occurred only there. To be honest, after coming across Ron J. Etters study on the Nucella Lapillus, it was hard for me not to relate the two cases.. In his study he states that the white morph heats up at a lower rate as opposed to the brown morph in shallow and protected areas. Observing a higher rate of mortality (not due to predation) in the brown morph, he deduced that the white morph had developed a better defense mechanism against physiological stress. It therefore has higher chances of survival in very shallow water or in those areas that remain exposed between tides for a long time. Although brown snails can avoid exposure to the sun by moving to more shaded and moist microenvironments, Etter thinks their greater susceptibility to stress nonetheless puts them at a disadvantage by limiting their foraging area and increasing the amount of time that they must spend in hiding- This in turn could lead to slower growth rates and reduced levels of fecundity (Laurie Burnham, Scientific American, September 1988 ). On the other hand this does not exclude the presence of natural predators, especially in young age.

If we compare these results to the observations made on Race Rocks we may find many points in common. Especially after I had a new confirmation. In fact, in a tide pool with difficult access in another part of the island I found a similar behavior. On a small area of white quartz I found five entirely white periwinkles. There is a big difference in size between the ones I found there and the population of tide pool – 4. The first ones were about 2-3 mm wide; the second ones were 6-12mm. This might be due to the fact that they were living in a creek of difficult access to most predators. Nevertheless the pattern fits: the white periwinkles are almost all found in areas of shallow water or that remain exposed for a long time between the action of tides. On the other hand these are the only areas were white quartz is found on the island. The observations made on the fieldwork make me almost certain that the reasons for the white morphs to be in the tide pools are an adaptation to physiological stress and a perfect camouflage. In Etters experiment most of the protected areas were inhabited by white morphs. On Race Rocks only two tide pools contained such organisms and in very low quantities. I think this can be explained by the combination of several factors. In the first place the ocean conditions around the island are

15

very rough and they make it hard for the shells to survive in all areas.. In the second place there is very limited quantities of white rock were the shells can camouflage. Finally the very high quantity of visual predators, both from the air and form the sea, make it very difficult for these shells to move around because they will immediately be seen.

Evaluation:

Due to the lack of hi-tech material I had to verify my observations with simple tools- This forced me to use other people’s previous studies (Ron J. Etter) to better understand what I saw. If I had disposed of an instrument to measure the internal temperature of the shells I could have repeated Etters experiment on the Littorina littorea.

My experiments allow the creation of a model that is true, as far as we know, only on the Race Rocks Marine Protected Area. Other generalizations should be verified. In order to obtain a more reliable model the experiment should be repeated over a longer period of time on a regular basis. The month of October is a period when there is a significant increase in predation also due to the fact that the colony of seagulls on the island is incremented by the newborn.

I chose a vast scale of shade variations in order to achieve more precise results. By doing this, it was hard for me to identify exactly to which number each shell belonged. Even though I tried my best I might have made some mistakes.

Knowing that there are significant differences in distribution between the exposed and the sheltered areas, each of the sites was not exposed to the same environmental conditions. Some were more exposed to currents than others.

Suggestions for further studies:

As I mentioned in the introduction the causes and patterns of color polymorphism in intertidal gastropods are a fairly unexplored field. There are therefore still many grey areas that need to be cleared.

The fieldwork I had the opportunity to make on Race Rocks allowed me to learned many things on these fascinating creatures, but posed also many questions to which I have no answer.

I was surprised when I found so many white periwinkles in the barnacles. It would be interesting to find out exactly what happens to them once they leave these shells:

Who exactly are their predators?

16

At which stage in growth does their shell become too hard to be digested?

How do they choose the areas where they stop?

Are there certain types of minerals that create better conditions for living? Is there a link at all?

What is the exact probability for a shell to be white at birth?

Is the gene universal or is it majority- present in certain areas?

How does the alimentation affect growth and reproduction rate?

The white shells are more tolerant to physiological stress, but does this affect the immunitary system? Which diseases are the most common?

The fieldwork I have done seems to apply for Race Rocks, but is it true also in other nearby areas? To what extent does the exposure to rough environmental conditions affect distribution? Since the tide pool was covered and surrounded by sea lions, it was obviously affected by their waste products. The population of periwinkles seems to be fairly stable? How tolerant are these shells to changes in pH? Is there a difference between the degree of tolerance of the dark and the white morphs?


17

Acknowledgments

I sincerely thank my supervisor, Mr. Garry Fletcher, for his encouragement, support, precious advise and constructive criticism. I am also very grateful to Mr. Mike and Miss. Carol Slater for hosting me on the island during the field work. I will never forget the delicious supper we had together on Thanksgiving Day. In the end, I would like to thank Mr. Chris Blondeau for his sincere interest and for bringing me at Race Rocks by boat.


Literature cited:

Laurie Burnaham, September 1988, The hard shell, pp.26-27, Scientific American.

Ron J. Etter, April 1987, Physiological stress and color polymorphism in the

intertidal snail Nucella Lapillus, Museum of comparative zoology, Harvard

University, Cambrige, MA 02138.

Jane M. Hughes and Peter B. Mather, December 1984, Evidence for predation as a

factor in determining shell colorfrequencies in a Mangrove snail Littorina Sp.,

School ofAustralian Environmental Studies, Griffith University, Nathan,

Queensland,Australia.


18


APPENDIX 1. Photographs of Littorina littorea

In Fig. 1 the snails were purposely placed on the white quartz substrate to show the contrast

between a shell of color 27 (white) and some of colors

1 – 10 ( Black to grey).

The same process was repeated in Fig. 2 below only on black, basaltic substrate adjacent in the

same tidepool. (Note three black snails (color 1-10) in lower left hand corner.)


Figure 1 Figure 2

19

Apendix 2. Photographs of the shell shades of Littorina littorea

There was a very significant difference in color between the dry and the wet shells. In the two pictures some of the shells had to be moved around in order to maintain the darker periwinkles before the lighter ones. For example, wet shell number 11 had to be moved to 9 on the dry scale

20

Appendix 3. Picture from Ron J. Etters fieldwork

Ron J. Etter noticed that in the Nucella Lapillus the white morph was more common in the sheltered areas. The brown one dominated in the areas of wave exposure. He concluded that the color of sea shells on the seashore may be an evolutionary response to physiological stress.

The color of seashells on the seashore may be an evolutionary response to physiological stress


Photographs of Littorina sitkanaFigure 1
In Fig. 1 the snails were purposely placed on the white quartz substrate to show the contrast between a shell of color 27 ( white ) and some of colors 1 – 10 ( Black to grey ).
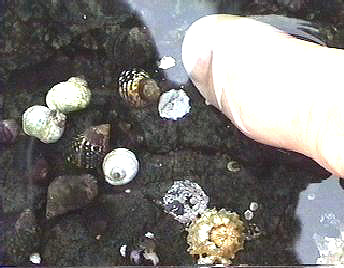


The same process was repeated in Fig. 2 below only on black, basaltic substrate adjacent in the same tidepool. (Note three black snails (color 1-10) in lower left hand corner.)
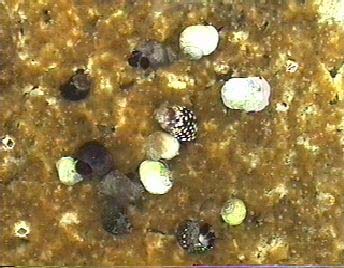
Figure 2


In Figure 3. Several colors of snail can be seen grazing on the golden diatoms in Pool 4 in the spring of 1998.

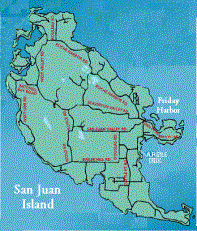
 

Why do Transects ? overview and techniques

THE OVERVIEW:

Images of transects applied to biological systems provide educators and students an opportunity to explore a wide diversity of systems and habitats. Traditionally, transects have been used in ecological studies to understand populations and community associations within selected habitats. The same concepts may be used to investigate any number of other biological systems ranging from individual organisms, or parts of organisms, to global ecosystems.
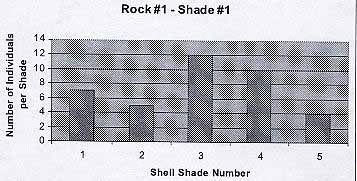
The transect provides a tool to focus attention on specific, selected systems and the effects of abiotic and biotic parameters affecting those biological units in the system. Qualitative and quantitative analyses by students at many levels, utilizing the resources of the world wide web, will provide the ability to study not only the specific transect site, but to link those studies with related research and information. It is our expectation that this exercise will not only provide an opportunity for an actual educational experience but will form the initial stimulus for contributions on new sites by other individuals and groups on a world wide basis. This would transfer the collaborative classroom exercise to a research activity reflecting the collaborative nature of international science.Educators and students are encouraged to use, among others, the BioQUEST philosophy of collaborative learning to develop additional exercises that support the use of transects as a tool for biological investigations and learning.

Collaborative Curriculum Lead-In:

Using the internet with biological transects can enhance knowledge and appreciation of important relationships in established biological systems. It is an ideal technique to foster and promote collaboration among students of a class, or between students from different geographic areas, the states or provinces, and countries. Teachers at all levels (K- 16) can take advantage of this medium to introduce students to the WWW as an information-providing tool, and as a research tool (example: NIH Image). Furthermore, they are encouraged to get their students to provide other examples of transects so that a transect data base on the web can be expanded. It could eventually include a wide variety of biological systems whether from a microscopic view point or a satellite perspective.

TECHNIQUES:

The basic premise of the initial transect presentations on this web site is of transects established linearly across a biological site (often through an environmental gradient). The measuring device used depends on the size of the site and the logistical constraints in putting it into place. It is envisioned that eventually transects ranging in size from a microscopic level to a satellite image level will appear here.

Note: to be useful for this project, all images contributed must have a reference measurement scale visible or the scale must be known so that it could be inserted into the pictures. Photos also need to be of good quality. It is also possible that accurate drawings could provide the image for a transect.

BIOLOGICAL SYSTEMS

Transects may be used in any biological system that is appropriate to the educational and scientific mission. What is presented here are suggestions for choosing habitats; the list is not all-inclusive, but hopefully a stimulus for further selection and development of sites. Most of our natural ecosystems in the world are being affected by the onset of Climate Change. If we are to know what the components of a natural ecosystem are , we need to document them before irreversible change occurs,  

EXTERNAL SITES:

1. AQUATIC HABITATS:

a. Marine

  • Water column (vertical and horizontal transects; use of satellite imagery)
  • Rocky Intertidal
  • Mud Flats
  • Sandy Beaches
  • Subtidal
  • Cobble and Shingle Beaches
  • Tide Pools
  • Coral Reefs
  • Thermal vent communities
  • Ice Flow Communities

b. Estuarine

  • Water column
  • Mangrove communities
  • Mud and sand flats
  • Salt marshes
  • Lagoons
  • Docks and pilings

c. Fouling (Settlement) communities

d. Freshwater

  • Lakes and ponds
  • Ephemeral pools
  • Rivers, streams and creeks
  • Marshes

2. TERRESTRIAL HABITATS:

  • Forest and woodland
  • Grassland
  • Savannah
  • Chapparal
  • Deserts
  • Urban lot
  • Agricultural fields
  • Tundra

INTERNAL [LABORATORY BASED] SITES:

1. Microscopic communities: use of bacteria, protists, invertebrates, algae

  • Petri dish populations
  • Tissue culture populations
  • Glass slide populations

2. Macroscopic habitats

  • Aquaria – marine, estuarine and freshwater
  • Terraria – desert to moist 

We hope that this page will soon expand to include a wide range of images of very different transects. Some of the transects we would like to see contributed are :

    • A transect through a bog ecosystem.
    • A transect through an alpine ecosystem from the foot of a melting glacier.
    • A transect through the shoreline of a drying salt pan as one sees in Saskatchewan or other locations on the North American Plains.
    • Aerial transects from the tundra showing distribution of Caribou herds and vegetation .
    • Aerial transects through the savannahs of Africa showing animal distribution patterns .
    • Coral Reef and Mangrove Forest transects.
    • Vertical Transects in Forest Ecosystems.
    • Microscopic Transects.

    HOW DOES ONE PREPARE IMAGES TO BE ANALYZED?
    ECOLOGICAL NICHE MODELING: This file gives detailed instructions on the method used to download pictures for processing, measuring, and further work. It also contains details for an exercise on the 3D modelling of ecological niches of organisms.

ORIGINAL AUTHORS:

This program was developed at the 1995 BioQUEST Summer Workshop on Collaborative Learning, Peer Review, and Persuasion in Biology Education at Beloit College, WI. USA
The authors of the program were :

  • Lynette Padmore, Florida A & M University, Tallahassee, Florida
  • John Moon, Harding College, Searcy, Arkansas
  • Ned Lyke, California State University, Hayward, Hayward, California
  • Gabriele Wienhausen, University of California, San Diego, La Jolla, California
  • Garry Fletcher, Lester B. Pearson College, Victoria, B.C. Canada

Peg 5 sample transects
See Transect A0050101

See Transect A0050102
See Transect A0050103
_____________________________________________________________

Return to the Contents page for Environmental modelling with Transects..