In the late summer of 2009, Lester Pearson College installed a new set of Solar PVC Panels at Race Rocks to supplement the existing solar bank for electrical production.
See the file: https://racerocks.ca/racerock/energy/solarupgrade/newsolar.htm

In the late summer of 2009, Lester Pearson College installed a new set of Solar PVC Panels at Race Rocks to supplement the existing solar bank for electrical production.
See the file: https://racerocks.ca/racerock/energy/solarupgrade/newsolar.htm
Orcas were spotted along the boundary of the reserve at several points throughout the day today.Our little friend the injured elephant seal has not been seen for several days now. However, the other young seal, possibly a male, was hauled up on the jetty last night.The number of sea lions continues to grow, as does the reach of their haul outs. A particularly stubborn and rather aggressive fellow was inhabiting the jetty this afternoon.Seagull chicks are beginning to lift off. Unfortunately, many are being found to have met their demise at the hands of the river otter which seems to frequent the island regularly these days.Two contractors from Home Energy Solutions in Victoria were here today to install new solar panels. Adam, 22:41:06.
GROUP 4 PROJECT- 2009Connor Scheu and Wouter Zwart April 2, 2009
Race Rocks Tidal Turbine Generator
Background:
Connor communicated with Russ Stothers of Clean Current for his project;
“Here is a simple synopsis of the project I will be doing this week. It is called a group four project (which pertains to the experimental science department here at the college), and the theme for everyones project is resource allocation/sustainability. Every student has to decide upon a project in which they will research something in this area. This usually involves the identification of a question, and then variables, presented in a lab format and accompanied by a presentation, but not overly formal.
For my project I really wanted to do something close to home, so I naturally thought of the tidal generator. I thought it would be so great if I could use this project to become more familiar with the project, and learn more about the field in general. It was for this reason that I wanted to contact you.
So basically what I would require for my project is some simple data, on the energy output of the generator, hopefully in relation to the tidal currents. From this I hope to create a simple relationship, proportional or not, which will help me identify the output and efficiency as current varies. This would satisfy the lab component of my project. The next component I would pursue would be the application of this knowledge. Simply from the results of the data and correlation I hope to receive, I would apply some simple reasoning to determine how effective or feasible such technology would be in other circumstances. That is, different magnitudes, in size and tidal extremes. An example of this would be; if the generator receives pique efficiency at the lowest speeds, then the technology would be more widely applicable to more general locations in the world, as opposed to selective areas of high tidal motion. Or if the energy benefits of higher speeds outweigh the selectivity of the projects.
This may be a rather ambitious goal, however this is a less formal project than others at the college (the extended essay is a full research paper) and as such it is OK to have lofty goals and then only achieve some of them in the allotted time. However I am sure that with your help I will be fully capable of receiving satisfactory results.
So I guess what I am asking of you would be the data I have previously outlined, in addition to the answering of some basic questions on the running of the turbine (included below this message).
This help would be most appreciated, I think it would be highly beneficial for the students of the college to have a little more information on the nature of this project. As it is so unique in design, important to global issues, and close to home. This is what my project will allow, as I will be presenting my findings to the student body towards the end of the week. I am very grateful for your generosity and aid
thank you again
Connor Scheu
Here are some of the questions which I have identified as what I think I need to know. But please feel free to include any relevant knowledge that you think would help. I am still quite unfamiliar with the project, and as such my questions may be a little vague. Also feel free to not answer any questions if they breach any kind of protocol or patent information.
1. Is this in fact just a simple turbine generator (similar to those in other hydro operations) placed in the presence of a fast moving current, or does it have certain defining characteristics.
No, it is significantly different from other hydro turbines. The requirement to extract power from a bi-directional flow means that the design of the turbine blade is very different. All standard hydro applications have blades that are designed to accept flow in one direction. Another major difference is that our machine is direct drive so that the speed of the generator is very slow compared to traditional applications which use a gearbox and a high speed generator.
2. What is the magnitude of energy created, when compared with other forms of green energy, is it relatively efficient etc.
The magnitude of the energy with respect to efficiency is very similar to wind in that the same basic laws of physics apply. The big difference/benefit is that the energy produced by tides is completely predictable whereas wind energy is statistically predictable over long periods of time but impossible to predict from one minute to the next.
I wouldn’t try to compare tidal energy to solar, biomass or other renewables. Each form of renewable energy is site specific.
3. Is this technology quite expensive to install, does it require very specific natural circumstances to operate effectively.
At the present time, yes. One of the biggest challenges facing the industry is to develop a system to cost effectively deploy, maintain and retrieve these devices. As you can understand from your experience at Race Rocks, the weather combined with the high tidal currents makes any deployment activity very difficult. The technology is best suited to sites that have peak tidal velocities between 2.5 m/s and 5.0 m/s. At current speeds less than 2 m/s there is very little energy in the flow and at speed greater than 5 m/s cavitation becomes a significant issue.
4. Is it true that this is one of only four projects like this in the world, and if so, what are the natures of the others. That is how do they differ, or are similar. Also, what immediate repercussions could this technology have on the world if proven to be effective.
Clean Current’s principal competitors are based in Europe. There are many competitors but the ones Clean Current considers threats are:
Marine Current Turbines is the most advanced with the deployment of a 1.2MW unit at Strangford Lough in 2008. Clean Current believes the challenges of this system compared to the Clean Current technology are as follows:
This unit has a high capital cost due to the complexity and large number of moving parts (gearbox, variable pitch blades, mechanism to raise and lower rotor).
The structure is surface piercing and therefore a navigational hazard to recreational and commercial traffic.
The exposed rotating blades pose a threat to fish, marine life and divers.
The above water structure must be designed to survive extreme weather such as hurricanes and tsunamis.
The turbine is sensitive to flow directional changes as it does not have an upstream augmenter to redirect the flow.
The system is complex and not applicable in deep water applications which comprise the majority of the world’s resources.
Open Hydro is a well financed company based in Ireland. They have deployed a 6m prototype of their technology at the EMEC testing centre. They are also planning to deploy a second unit in the Bay of Fundy in the summer of 2009. Clean Current believes the challenges of this system compared to the Clean Current technology are as follows:
The fixed pitch blades are similar to flat plates and therefore have a poor efficiency. Clean Current’s blades are also fixed pitch but use a highly efficient hydrodynamic shape.
The overall efficiency of this unit is much lower than Clean Current’s turbine due to the lack of a power augmenting outer duct.
The lack of a central support makes the turbine more susceptible to vibration caused by the turbulent tidal flow The turbine cannot compensate effectively for flow directional changes as it does not have an upstream augmenter to redirect the flow.
The design information currently available does not indicate the use of a maintenance module potentially resulting in significant downtime.
5. Is this technology a great improvement on the other forms of tidal generation, which typically involve the use of dikes and grand structures.
The traditional barrage types of technology have large environmental impacts. The type of tidal generation that we are promoting does not have the same effect on the ecosystem; however, it is important to note that barrage types of technology can extract greater amounts of energy as all of the flow is forced through the turbine.
6. What are some of the typical pitfalls in this kind of project, some main difficulties either with engineering, or other aspects.
Some of the main challenges from the engineering side are as follows:
Deployment in fast moving waters (as discussed above)
Operation of bearings in a submerged environment
Operation of an electrical machine in a submerged environment.
Transmission of the power to shore
Achieving maintenance free operation for 5+ years.
Prevent bio-fouling
Some of the non-technical issues include:
Regulatory approvals from organizations such as DFO on the perceived impact on marine life
Negotiations with existing users of area (fisherman, tug operators, commercial vessels) to accommodate the installation of a tidal farm
I think these are sufficient to give me a basic comprehension of what this project is about. I will also make an effort to research what I can on my own, I just thought I would make use of you as a resource if possible.
thanks again
Connor Scheu
Questions:
1. I am still unsure as to the nature of the “upstream augmenter.” I know that it allows for the turbine to compensate for flow direction changes, I am just not sure how it does this, or what it is really.
The curved shape of the augmentor redirects the flow so that the water is directly aligned with the turbine rotor. Without an augmentor, the flow would intersect the rotor at an acute angle which would result in reduced power output. You can also think of the augmentor as functioning similar to a sail on a sailboat. When the sail is trimmed properly, the wind follows the shape of the sail. We have designed the augmentor so that for flow deviations, the water follows the surface of the augmentor.
2. The transmission of power to shore, is done by means of an underwater cable? Is this the only means by which this can be done, and is this a very difficult procedure?
The only way to bring significant power ashore is through the use of a subsea cable. The challenges of this technology are ensuring the cable is adequately protected on the seabed. Due to the high current environment, the cable is very susceptible to damage through abrasion on the rocky seabed. Another challenge is electrical connectors. The majority of the connectors available in industry are not designed for both high power and long life. A specific design for tidal generators is required.
3. You mentioned the biological impact, I understand how this turbine is significantly better than the barrage designs, and even than the open bladed design of the other company. I presume that it is fairly safe (simply by looking at the design) because large animals will avoid the turbine, and smaller fish may pass through without harm. Is this somewhere in the right ballpark. Are there any other concerns for the local wildlife?
You thoughts are inline with ours. I think your best source for an opinion here is probably Chris.
4. It seems to me as if you guys are the best outfit going, would you consider yourselves the world leaders in this technology, or at least one of the most promising companies.
Thanks for the comments! Yes, we believe that we are one of the leading technologies. Having said this; however, there is still significant work to be performed to make this product commercial.
5. You mentioned that the majority of the world’s resources are located in deep water, what kind of limitations does your technology have on depth? Are there a multitude of possible locations for this technology around the world, what would be some of the ideal circumstances?
When we refer to deep water, we are referring to 40-65m of water. Our technology is well suited to these depths. As you go deeper, the greatest challenge will be installation. The paragraph below is an excerpt from our assessment of the market.
Global demand for electric power is expected to increase from 14.8 trillion kilowatt hours in 2003 to 30.1 trillion kilowatt hours by 2030, according to the Energy Information Administration. To meet this demand, the International Energy Agency estimates that investments in new generating capacity will exceed $4 trillion in the period from 2003 to 2030, of which $1.6 trillion will be for renewable energy generation equipment.
A variety of factors are contributing to the development of renewable energy systems that capture energy from replenishable natural resources, such as ocean currents and waves, flowing water, wind and sunlight and convert it into electricity. These factors include the rising cost of fossil fuels, dependence on energy from foreign sources, environmental concerns, government incentives and infrastructure constraints.
Tidal energy is positioned favourably to capitalize on the growing demand for renewable energy. It is expected that tidal energy generation costs for large sites will be competitive with other renewable energy sources. In addition to having the potential to be a very large source of competitive renewable energy, tidal energy is a very predictable source of energy, is not affected by climate change and has a minimal environmental footprint.
Clean Current expects early adoption of tidal power generation will be driven by those countries and regions that are looking to satisfy government or regulatory renewable energy mandates and that have potential tidal energy resources situated near populations with high electricity demand and relatively high power prices. A number of communities and utilities in the United Kingdom, North America and Asia are currently pursuing tidal energy feasibility studies, and are expected to be some of the first regions to pursue tidal farms when a proven commercial technology becomes available.
Recent government sponsored initiatives have included tidal resource assessments from leading engineering consulting firms, Black & Veatch Corporation (“Black & Veatch”) (United Kingdom) and Triton Consultants Ltd. (“Triton Consultants”)(Canada), respectively. Black & Veatch estimated the world’s “Technically Extractable Resource” to be 155 TWh per annum, including 18 TWh At an average capacity factor of 26%, this?per annum in the United Kingdom. translates to installed capacity of approximately 67,400 MW for the world and 7,800 MW for the United Kingdom.
In Canada, Triton Consultants assessed the tidal energy potential at approximately 42,000 MW. Approximately 7,000 MW of this potential resource is located in accessible regions on the east and west coasts of Canada.? Clean Current estimates that approximately 15% to 20% of the power in the accessible regions is currently extractable, resulting in 9.2 to 12.3 TWh per annum of electrical energy. At an average capacity factor of 26%, this translates to installed capacity of approximately 4,000 to 5,500 MW for Canada.
1. Source: Phase II, UK tidal Stream Energy Resource Assessment; Black & Veatch
2. Source: Canada Ocean Energy Atlas (Phase 1) Potential Tidal Current Energy Resources Analysis Background; Triton Consultants
Again, I am very grateful for all of your help, I read on the company site that one of the mandates of this project was to aid in the education of the students of Pearson College. I think this is very thoughtful, and says something about the quality of your company, and of course, its employees.
Purpose: To determine the correlation between the rates of current flow through the channel and the power produced by the generator, and then apply said correlation to real world applications.
Procedure: Experimentation performed by Clean Current and its employees
Data:
| Diameter of Turbine | m | 3.5 |
| Frontal Area | m2 | 9.62 |
| Density of Seawater | Kg/m3 | 1024 |
| Current Speed | Blade Tip Speed | RPM | Power in water | Efficiency | Power Extracted |
| (m/s) | (m/s) | (kW) | (%) | (kW) | |
| 1.0 | 3.9 | 21.4 | 4.9 | 28.2% | 1.4 |
| 1.1 | 4.3 | 23.5 | 6.6 | 28.9% | 1.9 |
| 1.2 | 4.7 | 25.7 | 8.5 | 29.5% | 2.5 |
| 1.3 | 5.1 | 27.8 | 10.8 | 30.1% | 3.3 |
| 1.4 | 5.5 | 30.0 | 13.5 | 30.7% | 4.1 |
| 1.5 | 5.9 | 32.1 | 16.6 | 31.2% | 5.2 |
| 1.6 | 6.3 | 34.2 | 20.2 | 31.7% | 6.4 |
| 1.7 | 6.7 | 36.4 | 24.2 | 32.2% | 7.8 |
| 1.8 | 7.1 | 38.5 | 28.7 | 32.6% | 9.4 |
| 1.9 | 7.5 | 40.7 | 33.8 | 33.0% | 11.1 |
| 2.0 | 7.8 | 42.8 | 39.4 | 33.3% | 13.1 |
| 2.1 | 8.2 | 44.9 | 45.6 | 33.6% | 15.3 |
| 2.2 | 8.6 | 47.1 | 52.5 | 33.9% | 17.8 |
| 2.3 | 9.0 | 49.2 | 59.9 | 34.2% | 20.5 |
| 2.4 | 9.4 | 51.4 | 68.1 | 34.4% | 23.4 |
| 2.5 | 9.8 | 53.5 | 77.0 | 34.5% | 26.6 |
| 2.6 | 10.2 | 55.6 | 86.6 | 34.7% | 30.0 |
| 2.7 | 10.6 | 57.8 | 97.0 | 34.8% | 33.7 |
| 2.8 | 11.0 | 59.9 | 108.1 | 34.8% | 37.7 |
| 2.9 | 11.4 | 62.1 | 120.1 | 34.9% | 41.9 |
| 3.0 | 11.8 | 64.2 | 133.0 | 34.9% | 46.4 |
| 3.1 | 12.2 | 66.3 | 146.8 | 34.8% | 51.1 |
| 3.2 | 12.5 | 68.5 | 161.4 | 34.6% | 55.8 |
| 3.3 | 12.9 | 70.6 | 177.0 | 34.3% | 60.8 |
| 3.4 | 13.3 | 72.8 | 193.6 | 33.8% | 65.4 |
| 3.5 | 13.7 | 74.9 | 211.2 | 32.6% | 68.9 |
Connor Scheu and Wouter Zwart April 2, 2009 . Race Rocks Tidal Turbine Generator![]()
Background:
Ed note: Connor communicated with Russ Stothers of Clean Current for his project;
“Here is a simple synopsis of the project I will be doing this week. It is called a group four project (which pertains to the experimental science department here at the college), and the theme for everyones project is resource allocation/sustainability. Every student has to decide upon a project in which they will research something in this area. This usually involves the identification of a question, and then variables, presented in a lab format and accompanied by a presentation, but not overly formal. Continue reading
“The biennial Puget Sound Georgia Basin Ecosystem Conference is the largest, most comprehensive scientific research and policy conference in the Salish Sea region. The 2009 conference, hosted by the Puget Sound Partnership and Environment Canada, built upon the experience of previous conferences by connecting scientific research and management techniques to priorities for meaningful action. The 2009 conference theme was The Future of the Salish Sea: A Call to Action. Since 2003, the conference has moved from chronicling science research to exploring the science/policy interface. The 2009 conference theme captured this progression from sound science to informed action. Conference participants had the opportunity to apply shared knowledge by developing priorities and a commitment to post-conference engagement.
Conference sub-themes included:
Air Quality & Climate Change
Ecosystem Management Strategies and Techniques
Habitat, Land Use, and Species
Marine & Freshwater Resources “
Adam Harding presented The Pearson College-EnCana-Clean Current Tidal Power Demonstration Project at Race Rocks
Photos: http://www.flickr.com/photos/designer_psp/collections/72157613549032493/
Videos:
http://www.psp.wa.gov/videos/mediaplayer/video_library_psgb.php
Publications:
http://gristmill.grist.org/story/2009/2/10/145023/460http://gristmill.grist.org/story/2009/2/6/16054/64735

A video from the Puget Sound Partnership Conference with Adam Harding presenting the Call to Action in the Day 3 Closing Session. Click to start.
For the complete set of video of the plenary sessions see this link:
http://www.psp.wa.gov/videos/mediaplayer/video_library_psgb.php

The complete text of the video above “A Call To Action for the Salish Sea.”. Developed by the Call to Action Team at the 2009 Puget Sound Georgia Basin Ecosystem Conference. Read aloud in closing plenary by Adam Harding, Pearson College, on Wednesday, February 11th, 2009 (PDF)
ADAM HARDING, LESTER B PEARSON COLLEGE OF THE PACIFIC/RACE ROCKS ECOLOGICAL RESERVE TIDAL ENERGY SESSION: PROCEEDINGS
The Pearson College-EnCana-Clean Current Tidal Power Demonstration Project at Race Rocks
Introduction
“Lester B. Pearson United World College of the Pacific is a unique two year pre-university school for two hundred students selected from around the world based solely on their personal merit, potential and demonstrated commitment to engage actively in creating a better world. All students attend on a full scholarship and live together while studying the International Baccalaureate program and pursuing explicitly the mission of the United World Colleges to make education a ‘force to unite people, nations and cultures for peace and a sustainable future’” (Pearson College 2009).
While at the College, students have the unique opportunity to help manage Race Rocks Ecological Reserve, located 15 minutes south of the college by boat, or 22 kilometres (10 nautical miles) southwest of Victoria. Race Rocks contains an amazing diversity of life – terrestrial, avian and marine, benthic and pelagic. The set of islands also have great historical, cultural and anthropological significance. The lighthouse was constructed in 1860 to help mariners navigate the treacherous waters of the Juan de Fuca Strait, and for centuries, First Nations people have used the islands as a rich marine resource. 2000 year old burial cairns on Great Race Rock stand as a testament to this.
Currently, Race Rocks is managed on a 30 year lease from BC Parks by Pearson College. Students and faculty at Pearson College play crucial role, from conservation efforts to research and development, to storing decades long records and raising funding for the Reserve. The College also employs a full time Eco-Guardian who maintains a human presence on the Reserve.
The traditional energy system
Electricity at Race Rocks is, and always has been, and important resource needed for the complex computer system with integrated weather data and remote controlled cameras allowing for all to view the island with no ecological footprint. It is also needed to support the full time Eco-Guardian who maintains a human presence on the Reserve.
Electricity at Race Rocks has traditionally been generated by two fixed, 15kW diesel generators. However, when Pearson College took over management in 1997, operating costs were passed onto the College. These costs were originally CAD $11 000 a year; however, this soon rose to CAD $20 000/year.
Environmental impacts were also great: at about 50 000L/year marine grade diesel combustion, the system contributed 133.5 tonnes/year of CO2 to the atmosphere. This figure does not include the emissions associated with extraction, refinement and transportation. Also, the possibility of an equipment failure during transport, pumping of fuel oil across the island or combustion in the generators could have a significant ecological impact if fuel ever escaped from the system.
Page1of4
ADAM HARDING, LESTER B PEARSON COLLEGE OF THE PACIFIC/RACE ROCKS ECOLOGICAL RESERVE TIDAL ENERGY SESSION: PROCEEDINGS
Generator noise was also a concern—the impacts of noise on communicative behaviour on animals and birds are not fully known, although it can be speculated that there may be an impact on predator response capability and mating/nesting behaviour. Furthermore, the diesel tanks, although adhering to environmental standards, are vulnerable in an earthquake, and severe weather and tidal currents common to the area would make containment of a spill impossible.
The Pearson College – EnCana-Clean Current Tidal Power Demonstration
Project at Race Rocks
In 2001, A feasibility study conducted by master’s program candidate Taco Niet through the Institute of Integrated Energy Systems at the University of Victoria identified that “sufficient renewable resources (tidal, wind and solar) were available to develop an integrated energy system that was capable of providing a reliable power supply to Race Rocks” and that, “tidal energy would have the least environmental impact due to the size of the system required and would provide the most reliable power source with the least amount of required storage” (Niet and McLean 2001).
In 2005, EnCana Corporation sponsored Clean Current Power Systems Incorporation of Vancouver to build, install, operate and monitor a 65kW free-stream tidal generator in 13 metres of water at Race Rocks. Thus, the Pearson College-EnCana-Clean Current Tidal Power Demonstration Project at Race Rocks was born. From January to September 2006, drilling, piling installation and cable laying for the turbine took place in the water surrounding the Reserve. Then, on September 27, 2006 the turbine was delivered and finally installed at Race Rocks. For the first time, the islands fell silent as the generators ceased operation.
In January 2007, 38 solar panels delivering 6.5kW of electricity in total were installed on the roof of the Integrated Energy Center. They were funded by a grant from the BC Ministry of Mines and Energy.
In April 2007, the turbine removed from the water for upgrades. The generators began operation again. Then, on October 17, 2008, the turbine was reinstalled at Race Rocks. Upgrades included stainless steel bearings, a new lubricating system with environmentally friendly lubricants, a new electrical wire protection system, better blade configuration, reinforced augmenter duct and ring, and reinforced central struts.
This new deployment will enable a further test of the seaworthiness of the turbine. Perfecting the structure and its operation in difficult ocean conditions is the goal of the experimental phase of the project. However, although the turbine is mounted in the water, it is not currently generating electricity. Upgrades are being completed in the land-based system of the project (the starter motor is being replaced). It is hoped that operations should begin soon. The idea will be to start slowly by running the turbine for a few hours each day, then slowly increasing the amount of time it is run for until it is fully operational.
Page2of4
ADAM HARDING, LESTER B PEARSON COLLEGE OF THE PACIFIC/RACE ROCKS ECOLOGICAL RESERVE TIDAL ENERGY SESSION: PROCEEDINGS
Environmental impacts of the tidal energy program
A report by Archipelago Marine Research Ltd. (AMR) in 2006 identified environmental impacts of the tidal turbine project before construction, during construction and after construction. During construction, AMR notes that “Overall results from these observations suggested that there was very little impact on the wildlife within the Reserve” (Archipelago Marine Research 2006).
After construction (data collected 45 days after drilling), AMR notes that there were some ongoing impacts from dredging that extend 20 metres along the cable route and west along the direction of tidal flow. Also present are some exposed areas of bedrock and clay. Organisms had begun to inhabit the submarine cable exterior. Some evidence is present that the cable anchor block had dislodged giant acorn barnacles, although the impact was very limited and localised. There was no impact to vegetation or other sensitive invertebrate species (Archipelago Marine Research 2006).
It is not fully known at this time what impact the turbine itself has on the organisms, especially cetaceans and pinnipeds. However, Glen Darou, president and CEO of Clean Current Power Systems Inc., and other experts note that the effect is negligible, as “The only things that can swim in fast moving currents are things that can”; that is, they will be able to manoeuvre around it (Dove 2008). At a spin of roughly 60 rpm with no suction, there is little threat to organisms. It is hoped to install a camera on the turbine someday to monitor how animals react to it and the low hum it produces.
The future
Glen Darou, president and CEO of Clean Current Power Systems Inc., notes that “We believe it is highly exportable technology, with strong potential to succeed in international settings” (Skilling 2005). And more recently, “A 200-tonne turbine is being developed for the Bay of Fundy in Nova Scotia…Some European countries are starting to take interest” (Dove 2008). Clean Current is also working on turbines for shallow tidal areas or rivers that would be able to fit on a flatbed truck and could be plugged in on land.
However, Race Rocks won’t be Clean Current’s laboratory forever. Eventually Pearson College and BC Parks will be responsible for the turbine.
In the meantime, the Race Rocks Tidal Energy Generator has been an immense success. At Race Rocks, we are now able to generate electricity from a renewable source, negating the huge traditional energy system concerns. And for the students of Pearson College, the turbine is a huge learning experience; with students from 100 countries around the world, the turbine serves as a unique demonstration of the potential for alternative energy. Highly committed citizens of the world, Pearson students will take their experiences with the tidal turbine to their home countries when they leave Canada. Hopefully, some will put these ideas into action, developing alternative energy sources in their own countries.
Page3of4
ADAM HARDING, LESTER B PEARSON COLLEGE OF THE PACIFIC/RACE ROCKS ECOLOGICAL RESERVE TIDAL ENERGY SESSION: PROCEEDINGS
Bibliography
Dove, Amy. “Harnessing power from the ocean.” Goldstream News Gazette, October 22, 2008.
“Lester B. Pearson United World College of the Pacific.” Lester B. Pearson United World College of the
Pacific. http://www.pearsoncollege.ca (accessed 5 March 2009).
Niet, T, McLean, G. “Race Rocks Sustainable Energy Development.” Paper presented at 11th Canadian Hydrographic Conference, Victoria, British Columbia, June 2001.
Skilling, David. EnCana partners to enable Pearson College-EnCana-Clean Current Tidal Power Demonstration Project at Race Rocks, BC. Press release by Lester B. Pearson College, Victoria, British Columbia, February 25, 2005.
“Summary Report on Environmental Monitoring Related to the Pearson College-EnCana-Clean Current Tidal Power Demonstration Project at Race Rocks Ecological Reserve.” Final report by Archipelago Marine Research, Victoria, British Columbia, December 2006.
Page4of4
You may also access this in the PDF: 1E_Adam Harding
Also available :taken from the website: http://depts.washington.edu/uwconf/psgb/proceedings/papers/p5_hardi.pdf
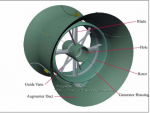 from:http://www.spok.dk/seminar/CA-OE-2007-Race%20Rocks_22.pdf
or for the internal pdf version on this website: See the powerpoint presentation at: CA-OE-2007-Race Rocks_22
A week before raising the turbine in April 2007, the outer Nereocystis growth was removed by the Pearson College Divers. Since the top of the turbine is in a water depth averaging 10 metres it is shallow enough for the brown Macroalgae to take foothold and within a few weeks it would have reached the surface. This algae can atttach to a solid substrate within the top 12 metres of water at Race Rocks.
Thanks to Russell Stothers of Clean Current and the Pearson College Divers for these images.
A week before raising the turbine in April 2007, the outer Nereocystis, or Bull kelp growth was removed by the Pearson College Divers. Since the top of the turbine is in a water depth averaging 10 metres it is shallow enough for the brown Macroalgae to take foothold and within a few weeks it would have reached the surface. This algae can atttach to a solid substrate within the top 12 metres of water at Race Rocks.
asasa
 |
 |
 |
| Link to the Effects of Solar energy on organisms at Race Rocks: | Correlations File: Data has been selected to show seasonal patterns and to allow some study of the relationships between solar radiation, uv and temperature | Second exercise on Solar and UV. This one also links through to the raw data references for the factors. |
 |
 |
 |
|
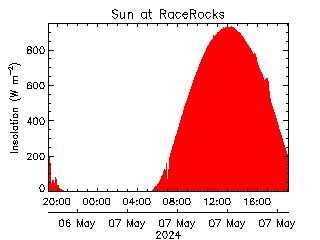
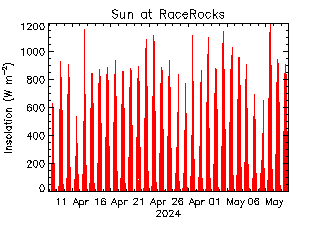
Graph of today’s Solar Insolation:
The intensity of the incoming radiation is measured in Watts per square metre (Wm-2) |
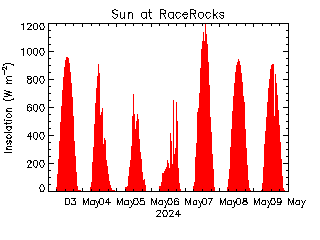
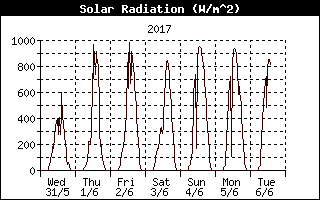
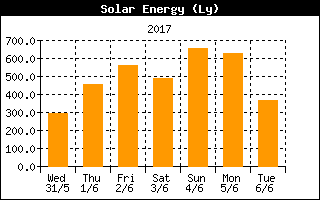
Cick on the above graphs for a larger version of the past week’s solar level at Race Rocks. | The “three graphs above represent historical records of Solar insolation at different time scales These graphical interpretations are made possible by the website victoriaweather.ca |
 |
 |
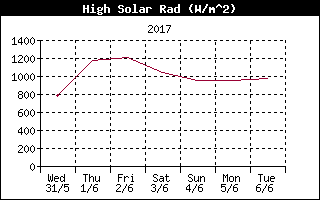 |
| Solar Radiation levels for the past week.. This is the peak solar raddiation measured during the archive interval..(30 min) | Solar Energy history for the past week: The amount of accumulated solar radiation energy over a period of time measured in Langleys; 1 Langley= 11.622 Watt-hours per square meter =41.84 kilojoules per sqare metre=3.687 BTUs per square foot | Highest levels of Solar Radiation for the past week as recorded on the davis Weather Instrument. |
 |
 |
|
| The SOLAR ENERGY part of the Integrated Energy Project at Race Rocks |
Alternate Energy: Solar, A curriculum resource |
| AN EXPLANATION OF WHAT THE SOLAR MEASUREMENT REPRESENTS |
| As the Earth orbits the Sun, it receives approximately 1,400 W / m? of energy, as measured upon a surface kept normal (at a right angle) to the Sun (this number is referred to as the solar constant). Of the energy received, roughly 19% is absorbed by the atmosphere, while clouds on average reflect a further 35% of the total energy. The generally accepted standard is 1020 watts per square meter at sea level. |
|
website on the Basics of Solar Energyhttp://zebu.uoregon.edu/disted/ph162/l4.html
|
| Incident Solar Energy on the ground:• Average over the entire earth = 164 Watts per square meter over a 24 hour day So the entire planet receives 84 Terrawatts of Power our current worldwide consumption is about 12 Terrawatts so is this a solution? |
| Broadband Solar Irradiance – theoretically the solar radiation arriving at the earth from all frequencies or wavelengths, in practice limited to the spectral range of radiometers, typically from 300 nm to 3000 nm wavelength. Meteorologists refer to this band as short-wave radiation. |
| Electromagnetic Radiation – the energy produced by an oscillating electrical (and magnetic) field, transmitted by photons. See Electromagnetic Spectrum – the entire energy range of electromagnetic radiation specified by frequency, wavelength, or photon energy. The low end of the spectrum is infrared radiation (heat), and passes through the colors of visual light from red through violet, through ultraviolet radiation, x-rays, and gamma rays. Radio and television are transmitted on specific electromagnetic frequencies. |
| Shortwave Radiation – the principal portion of the solar spectrum that spans from approximately 300 nanometers (nm) to 4000 nm in the electromagnetic spectrum. Longwave radiation is infrared radiation (>4000 nm). |
| Watt – a unit of power defined as a Joule per second.. A Joule is – a metric energy unit (Newton-meter) equal to approximately 0.2389 calories. |
| Btu – British Thermal Unit, the amount of energy required to raise one pound of water one degree Farenheit at 60°F, equivalent to 1055 joules or 252.1 calories. |
| LuxThe lux (symbolized lx) is the unit of illuminance in the International System of Units (SI). It is defined in terms of lumens per meter squared (lm/m2). Reduced to SI base units, one lux is equal to 0.00146 kilogram per second cubed (1.46 x 10⁻³ kg / s3). One lux is the equivalent of 1.46 milliwatt (1.46 x 10⁻³ W) of radiant electromagnetic (EM) power at a frequency of 540 terahertz (540 THz or 5.40 x 10¹⁴ Hz), impinging at a right angle on a surface whose area is one square meter. A frequency of 540 THz corresponds to a wavelength of about 555 nanometers (nm), which is in the middle of the visible-light spectrum. The lux is a small unit. An alternative unit is the watt per meter squared (W / m2). To obtain lux when the illuminance in watts per meter squared is known, multiply by 683. To obtain watts per meter squared when the illuminance in lux is known, divide by 683 or multiply by 0.00146. Illuminance varies inversely with the square of the distance from the source on a free-space line of sight. If the distance is doubled, the illuminance is cut to 1/4; if the distance increases by a factor of 10, the illuminance becomes 1/100 (0.01 times) as great. |
| lumenThe lumen (symbolized lm) is the International Unit of luminous flux. It is defined in terms of candela steradians (cd multiplied by sr). One lumen is the amount of light emitted in a solid angle of 1 sr, from a source that radiates to an equal extent in all directions, and whose intensity is 1 cd. One lumen is the equivalent of 1.46 milliwatt (1.46 x 10⁻³ W) of radiant electromagnetic (EM) power at a frequency of 540 terahertz (540 THz or 5.40 x 10¹⁴ Hz). Reduced to SI base units, one lumen is equal to 0.00146 kilogram meter squared per second cubed (1.46 x 10⁻³ kg multiplied by m2 / s3). The lumen is a small unit. An electromagnetic field power level of 1.46 milliwatt is small; the radio-frequency (RF) output of a children’s toy two-way radio is several times that much. A frequency of 540 THz corresponds to a wavelength of about 556 nanometers (nm), which is in the middle of the visible-light spectrum. A steradian is the standard unit solid angle in three dimensions; a sphere encloses 4 pi (approximately 12.57) steradians.The Davis Weather Instrument provides a measure of solar radiation in Langleys: This is Solar Radiation Integrated over time. One Langley equals 11.622 Watt hours per square meter= 697.32 Watt minutes per square meter.This file is a link on Solar Cycle Progression from NOAA. It includes data on sunspot activity.Return to the Physical/Abiotic factors Files: |