markercylinlarges.jpg
foreloc1cyls.jpg
loc1cylinders.jpg
Locations of three of the concrete cylinders that we think we were used in the construction phase of the tower Correct location as indicated by concrete adhesions on the rock surface Cylinder #1 had become detached from the rock, as it was in a storm exposed area on the East side.
loc2unknowncloseups.jpg
cylinderunknownlocations.jpg
cylindercorrectloc3s.jpg
Cylinder 2 lies down on the vegetated area. We have not determined its original location yet. Cylinder #3 is in its original location, the only marker undisturbed over the years. Surface markings on cylinder #3.
cylindercorrectloc3bs.jpg
cylinderunknloc4s.jpg
A significant reference in this article helps explain the occurrence of three similar markers at Race Rocks. This was in reference to Discovery Island, but the same type of markers occur at Race Rocks. ” Three cast concrete cylinders referenced the original lighthouse. These were positioned in a straight line with distances measured between each and the lighthouse.”
Cylinder #3. Cylinder #4 was just recently found down in the surge channel west of the engine room. We are still trying to figure out its original location so we can reattach it.

Materials for this file have been assembled in 2006 by Garry Fletcher, Educational director, racerocks.com, former faculty member at Lester B. Pearson College.

Salinity as an Abiotic Factor

Jeremias tests the salinity using a hydrometer. This manual method has been used at Race Rocks from 1935 until more recent years when a digital salinometer has been used.


For monthly records of Salinity refer to :

https://www.racerocks.ca/?s=Salinity&submit=Search


“During our project week at Race Rocks, Mike Slater, the Race Rocks Marine Protected Area Guardian asked us if we could make a video explaining the daily duties necessary to maintain the facility. Students who are relieving on the island during Mike’s absence will be able to use this data as a guide for performing their duties, as well as providing a useful information resource for students visiting the island.

These duties include two daily engine checks, a salinity check one hour before high tide, and keeping a record of the days weather, as well as explaining the functions and instructions for testing machinery located on the island.”

ABIOTIC EFFECTS OF SALINITY ON ORGANISMS

Organisms which live in Tidepools have to withstand changing salinities which may range from 0 parts per thousand to over 100 parts per thousand. Here is an example of an algae that in the summer lives in concentrated brine of the evaporated tidepool number 7.


Rob measures salinity with the salinometer in tidepool Number 4..This file shows the results that one class in environmental systems got when measuring the salinities of tidepools. Note there can be quite a variation in both temperature and salinity, depending on the elevation of the pool and therefore the frequency of flooding from the ocean.

Mean Monthly Sea Surface Salinity at Race Rocks-1936 to present .

Two decades of mean monthly Salinity records are compared in the following investigation.

Salinity Comparisons for 2 Decades
There are a number of interesting features of the two decades almost 50 years apart.

Some open-ended questions that you may wish to pursue:

  1. How do the individual months compare?
  2. Is there any evidence of a trend that distinguishes the earlier decade from the most recent one?
  3. Is there any evidence of a trend that distinguishes one period of the year from another?
  4. What could be the cause of any observable trends?
  5. Does geographic location of Race Rocks provide an answer to any findings?
  6. See the work done on comparing sea temperature from two decades for some other ideas.
  7. What would the graphs look like if you took the means of each month from the two decades and plotted them ?

You may also see the the raw data used to make the graphs in the two tables below. It may be useful in this format to clip and paste into an EXCEL workbook for further analysis. If you come up with any other interesting analysis of the data from this exercise or from looking at the complete data archive. We would be interested in carrying it attached to this page.

Raw Data 1942 1943 1944 1945 1946 1947 1948 1949 1950 1951
Jan. 31.1 31.4 31.5 31.3 31.1 31.6 31 31.3 31.1 30.2
Feb. 30.9 31.3 31.5 31.2 31.2 31.2 31.4 31.5 31.1 30.2
Mar. 31.4 31.6 31.7 31.5 31.1 31.5 31.4 31.3 30.7 30.6
Apr. 31.5 31.2 31.9 31.5 31.4 31.7 31.5 31.5 31 31.3
May 31.5 31.5 31.7 31.7 31.3 31.6 31.3 31.3 31.3 31.5
June 31.6 31.5 32.1 31.6 31 31.2 30.8 31.2 31.3 31.1
July 31.2 31.3 31.8 31.5 30.7 31.4 30.4 31.8 30.9 31.3
Aug. 31.1 31.1 31.8 31.5 30.9 31 31.1 31.5 31 31.2
Sept. 31.3 31.1 31.7 31.6 31.4 31.4 31.1 31.4 31.1 31.5
Oct. 31.7 31.4 31.6 31.8 31.5 31.6 31.1 31.5 31 31.6
Nov 31.7 31.5 31.7 31.8 31.8 31.2 31.4 31.5 30.9 31.5
Dec 31.4 31.6 31.4 31.5 31.2 31.3 31 31 30.3 31.1
1998 1999 2000 2001 2002 2003 2004 2005 2006 2007
Jan. 30.6 30.5 30.8 31.3 30.8 31 30.9 30.9 30.79 30.6
Feb. 30.3 30.3 30.8 31.1 30.8 30 30.7 30.5 30.23 30.7
Mar. 30.4 30.5 30.9 31.6 31.1 30.9 30.9 31 31.19 30.8
Apr. 30.5 30.6 31.1 31.8 31.3 30.7 31.1 31.1 31.2 30.8
May 31 30.7 31 31.7 31.4 31.1 31.2 31.1 31.07 30.8
June 30.6 30.7 30.9 31.8 31.3 30.7 31.3 31.1 31.07 30.8
July 30.8 30.2 30.5 31.4 30.8 31.1 31.1 30.8 30.81 30.6
Aug. 30.9 30.2 30.7 31.3 30.7 31.2 31.3 30.8 31 30.4
Sept. 31 30 30.7 31.3 31.2 31.4 31.4 31.1 31.46 30.7
Oct. 31.3 30.7 30.9 31.6 31.3 31.6 31.1 31.4 31.54 31.2
Nov. 31.2 31.2 31.2 31.4 31.7 31 31.1 31.18 31.15 31
Dec. 30.7 30.7 31.3 31 31.4 31 31.1 31.22 30.9 31

TIDAL CURRENT :RENEWABLE ENERGY FOR RACE ROCKS

Complete Video Coverage of the Announcement at Pearson College

 TV and Print Media Coverage of the event.

Press Release : CANA PARTNERS TO ENABLE PEARSON COLLEGE – ENCANA – CLEAN CURRENT TIDAL POWER DEMONSTRATION PROJECT AT RACE ROCKS, BC Victoria
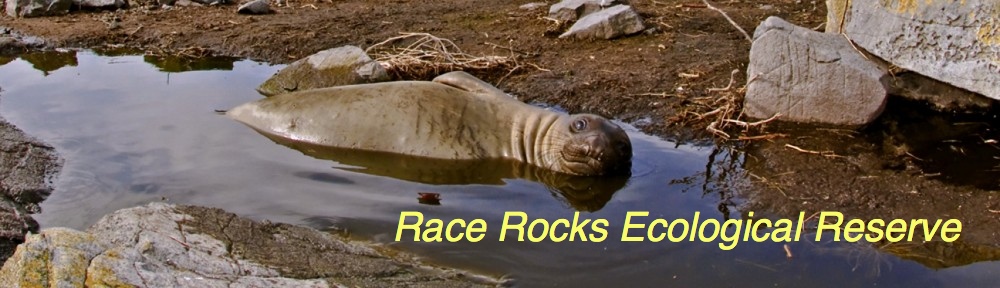
Thanks to an innovative partnership between Lester B. Pearson College of the Pacific, EnCana Corporation and Clean Current Power Systems Incorporated, Canada’s first free-stream tidal power project will be built at the Race Rocks Ecological Reserve, offshore of Vancouver Island in British Columbia. The project will enable the world famous marine park to tap into surrounding ocean currents and convert tidal energy to electric power for its needs beginning in early 2006. Making the announcement were:
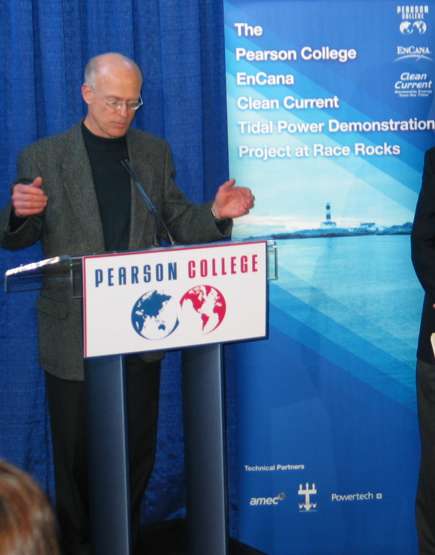
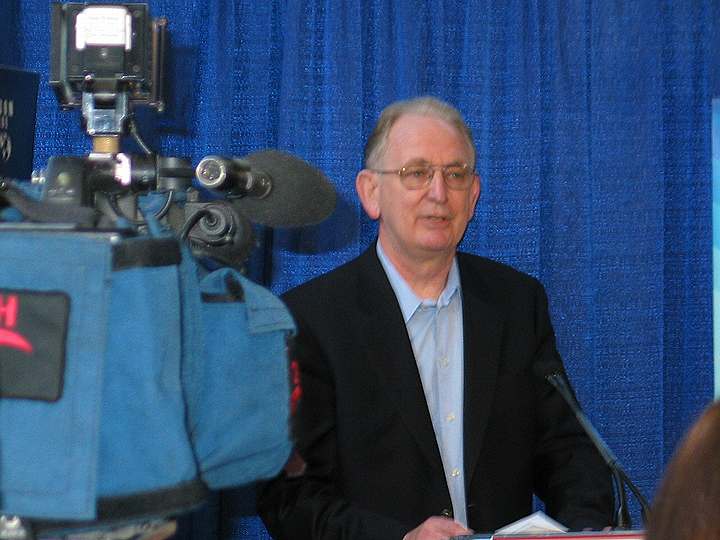
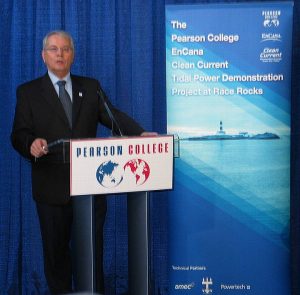
Gwyn Morgan, President and CEO of EnCana,
Glen Darou, President and CEO of Clean Current,
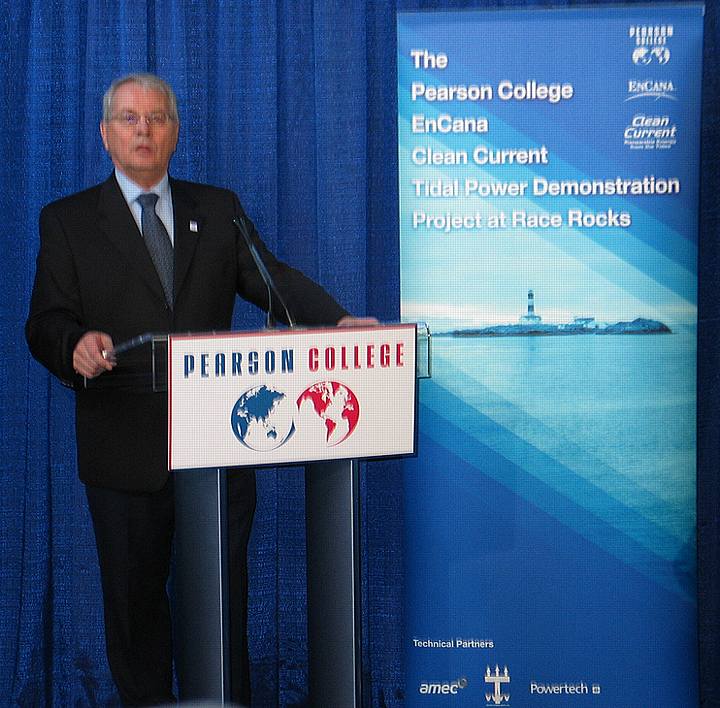
Richard Neufeld, British Columbia Minister of Energy and Mines,
and Stuart Walker, Director of Pearson College.


Gwyn Morgan

Gwyn Morgan

Officially known as the “Pearson College – EnCana – Clean Current Tidal Power Demonstration Project at Race Rocks,” the project is enabled by a $3-million investment from the EnCana Environmental Innovation Fund. “EnCana is pleased to be a partner in this first-class, alternative energy project,” said Morgan. “Our investment in this B.C.-based unconventional environmental and power technology reflectsour desire to tangibly encourage innovative energy solutions.” EnCana’s Environmental Innovation Fund was established to advance new technologies and solutions that improve environmental performance associated with consuming and producing energy. Commercial proceeds from financed projects will be re-invested into the fund to ensure their sustainability.


Richard Neufeld

“The commitment by Premier Campbell in promoting alternative energy sources has helped British Columbia become a world leader in sustainable environmental management,” said Neufeld. “The province commends projects like this one, as they show our commitment to developing clean energy solutions that will benefit all British Columbians.” The multi-year demonstration project will involve the installation, operation and monitoring of a 65kW free-stream tidal turbine generator in the water near Race Rocks, a provincial ecological reserve located 10 nautical miles southwest of Victoria.
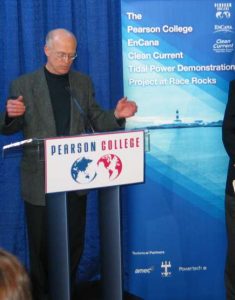
Glen Darou

Clean Current is a private British Columbia-based company that designs and licenses technology that efficiently converts the energy of tidal currents into electricity. Clean Current’s proprietary technology consists of a horizontal-axis ducted turbine with a direct-drive variable speed permanent magnet generator. The turbine generator is equally efficient in both directions as the tidal currents reverse twice each day. “This Canadian technology is simple, efficient and environmentally friendly,” said Darou. “We believe it is highly exportable technology, with strong potential to succeed in international settings. Our company is delighted to have the support of EnCana, Pearson College, and technical partners AMEC, Powertech Labs Inc. and Triton Consultants Ltd.”

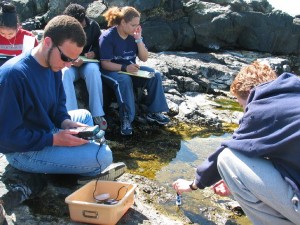
Pearson College, one of ten United World Colleges worldwide, is the custodian of the Race Rocks Ecological Reserve, located three nautical miles from campus. Diesel-powered generators currently provide electricity requirements at the reserve. Students and staff will work elements of the tidal power demonstration project into their studies. “This is a terrific project for Pearson College, in that it supports our goal of making the ecological reserve a showcase for alternative, low-impact technologies such as tidal power,” said Walker. “We would like to thank Clean Current for their commitment to developing the technology and EnCana for the financial support that is making this demonstration project possible.”

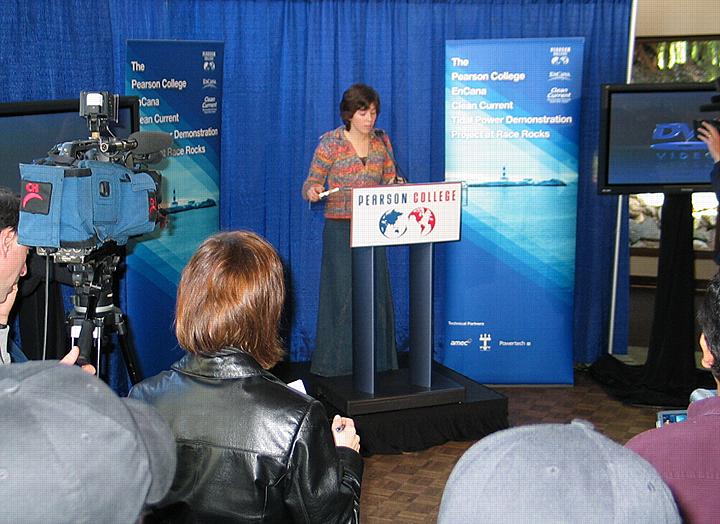
Second Year Pearson College student Alyssa Holland (year 30) concluded the presentation , by thanking the speakers. As a student involved in Environmental Systems and the diving program, she shared the enthusiasm she has for the resources of the area and emphasized the great importance she and other students attach to the effort of those involved in this project in the ongoing goal of producing energy sustainably.

Dave Skilling

Communications Coordinator
Lester B. Pearson College
250-391-2479
www.pearsoncollege.ca
www.racerocks.ca


Aechmophorus occidentalis: western Grebe__ The Race ROcks Taxonomy

Western grebes overwinter here on Southern Vancouver Island in the protected coastal bays. Three pairs were seen in Pedder bay throughout January and February of 2006. They feed on fish at night following trails of bioluminescence as the fish swim through the water. ( see reference below)

It may surprize some to know that this is one of the few prairie pond birds which do not migrate South during the winter, but instead migrate West over the Rocks mountains to the Coastal Bays of Vancouver Island.

The Western Grebe is classified by the Alberta Government as a Species at Risk. This Field Summary gives further information on it.

Research on Foraging indicating a night-feeding pattern is presented in the research of James Clowater, See the link to his thesis at the bottom.


Aechmophorus occidentalis: Western grebe- The Race Rocks Taxonomy

Western grebes overwinter here on Southern Vancouver Island in the protected coastal bays. Three pairs were seen in Pedder bay throughout January and February of 2006. They feed on fish at night following trails of bioluminescence as the fish swim through the water. ( see reference below)

It may surprize some to know that this is one of the few prairie pond birds which do not migrate South during the winter, but instead migrate West over the Rocks mountains to the Coastal Bays of Vancouver Island.

The Western Grebe is classified by the Alberta Government as a Species at Risk.

Research on Foraging indicating a night-feeding pattern is presented in the research of James Clowater, See this link to his thesis.
CLASSIFICATION:
Domain Eukarya
Kingdom Animalia
Phylum Chordata
Sub-Phylum Vertebrata
Class Aves
Order Podicipediformes
Family Podicipedidae
Genus Aechmophorus
Species occidentalis
Common Name: Western Grebe


taxonomyiconReturn to the Race Rocks Taxonomy
and Image File
pearsonlogo2_f2The Race Rocks taxonomy is a collaborative venture originally started with the Biology and Environmental Systems students of Lester Pearson College UWC. It now also has contributions added by Faculty, Staff, Volunteers and Observers on the remote control webcams.  G. FLetcher

Telmessus cheiragonus:Helmet Crab-The Race Rocks Taxonomy

helmet crab

Telmessus cheiragonus


helmetventral

Telmessus cheiragonus, the helmet crab, ventral inage

Domain: Eukarya
Kingdom: Animalia
Phylum: Arthropoda
Class: Crustacea
Order: Decapoda
Family: Cheiragonidae
Genus Telmessus
Species cheiragonus
Common Name: Helmet crab

helmet3

Telmessus cheiragonus, Helmet crab photos by G. Fletcher

This crab shows up frequently when we are diving at Race Rocks

Other Members of the Phylum Arthropoda at Race Rocks.

taxonomyiconReturn to the Race Rocks Taxonomy
and Image File
pearsonlogo2_f2The Race Rocks taxonomy is a collaborative venture originally started with the Biology and Environmental Systems students of Lester Pearson College UWC. It now also has contributions added by Faculty, Staff, Volunteers and Observers on the remote control webcams.  G. Fletcher


Daily Air Temperature Data -1998-2005: Race Rocks Ecological Reserve


I am working at restoring the following links which were removed when Telus dropped a server unexpectedly which we had been using at racerocks.com .. If you wish to access this data before i get the links updated ,you may contact me at email :garryf  then use the at sign gmail dot com

October 1984 to February 1997 daily weather records submitted to Environment Canada Meteorological Service by the light keepers at Race Rocks.

Be sure to do a Customized Search for
“Race Rocks Lightstation” to find this archive.

I think previous records exist so I am trying to get them from the Canadian Meteorlogical Service.

AIR DATA, JANUARY 1998
(missing first three months)

AIR DATA, FEBRUARY 1998

AIR DATA, MARCH 1998


>AIR DATA, APRIL 1998AIR DATA, MAY 1998

AIR DATA, JUNE 1998

AIR DATA, JULY, 1998

AIR DATA, AUGUST, 1998

AIR DATA SEPTEMBER, 1998

AIR DATA OCTOBER, 1998

AIR DATA NOVEMBER, 1998

AIR DATA DECEMBER, 1998


AIR DATA, JANUARY 1999

AIR DATA, FEBRUARY 1999

AIR DATA, MARCH 1999

AIR DATA, APRIL 1999

AIR DATA, MAY 1999

AIR DATA, JUNE 1999

AIR DATA, JULY, 1999

AIR DATA, AUGUST, 1999

AIR DATA SEPTEMBER, 1999

AIR DATA OCTOBER, 1999

AIR DATA NOVEMBER, 1999

AIR DATA DECEMBER, 1999


AIR DATA, JANUARY 2000

AIR DATA, FEBRUARY 2000

AIR DATA, MARCH 2000

AIR DATA, APRIL 2000

AIR DATA, MAY 2000

AIR DATA, JUNE 2000

AIR DATA, JULY, 2000

AIR DATA, AUGUST, 2000

AIR DATA SEPTEMBER, 2000

AIR DATA OCTOBER, 2000

AIR DATA NOVEMBER, 2000

AIR DATA DECEMBER, 2000


AIR DATA, JANUARY 2001

AIR DATA, FEBRUARY 2001

AIR DATA, MARCH 2001

AIR DATA, APRIL 2001

AIR DATA, MAY 2001

AIR DATA, JUNE 2001

AIR DATA, JULY, 2001

AIR DATA, AUGUST, 2001

AIR DATA SEPTEMBER, 2001

AIR DATA OCTOBER, 2001

AIR DATA NOVEMBER, 2001

AIR DATA DECEMBER, 2001


AIR DATA JANUARY, 2002

AIR DATA FEBRUARY, 2002

AIR DATA MARCH, 2002

AIR DATA APRIL, 2002

AIR DATA MAY, 2002

AIR DATA JUNE, 2002

AIR DATA JULY, 2002

AIR DATA AUGUST , 2002

AIR DATA SEPTEMBER , 2002

AIR DATA OCTOBER, 2002

AIR DATA NOVEMBER, 2002

AIR DATA DECEMBER, 2002


AIR DATA JANUARY, 2003

AIR DATA FEBRUARY, 2003

AIR DATA MARCH, 2003

AIR DATA APRIL, 2003

AIR DATA MAY, 2003

AIR DATA JUNE, 2003

AIR DATA JULY, 2003

AIR DATA AUGUST, 2003

AIR DATA SEPTEMBER, 2003

AIR DATA OCTOBER, 2003

AIR DATA NOVEMBER, 2003

AIR DATA DECEMBER, 2003


AIR DATA JANUARY, 2004

AIR DATA FEBRUARY, 2004

AIR DATA MARCH, 2004

AIR DATA APRIL, 2004

AIR DATA MAY, 2004

AIR DATA JUNE, 2004

AIR DATA JULY, 2004

AIR DATA AUGUST , 2004

AIR DATA SEPTEMBER , 2004

AIR DATA OCTOBER, 2004

AIR DATA NOVEMBER, 2004

AIR DATA DECEMBER, 2004


AIR DATA JANUARY, 2005

AIR DATA FEBRUARY, 2005

AIR DATA MARCH, 2005

AIR DATA APRIL, 2005

AIR DATA MAY, 2005

AIR DATA JUNE, 2005

AIR DATA JULY, 2005

AIR DATA AUGUST , 2005

AIR DATA SEPTEMBER, 2005

AIR DATA OCTOBER, 2005

AIR DATA NOVEMBER, 2005

AIR DATA DECEMBER, 2005


From January 2006 on, refer to the air temperature files from the Davis Weather Instrument.

Archived Data for this page has been produced in the EXCEL Files by Mike Slater. It was then converted and saved as html by Garry Fletcher and students of the racerocks.com activity


Crossaster papposus: Rose star–The Race Rocks Taxonomy

We dont find the rose star very often when diving at Race Rocks . These sunstars are scavengers and are omnivores, ir predators of anything edible. Sunflower stars and Northern sunstars are its predators. 

Domain Eukarya
Kingdom Animalia
Phylum Echinodermata
Class Asteroidea
Order Velatida
Family Solasteridae
Genus Crossaster
Species papposus,

(C. papposus Linnaeus, 1776)

Common Name: Rose Star

Other Members of the Phylum Echinodermata at Race Rocks 
taxonomyiconReturn to the Race Rocks Taxonomy
and Image File
pearsonlogo2_f2The Race Rocks taxonomy is a collaborative venture originally started with the Biology and Environmental Systems students of Lester Pearson College UWC. It now also has contributions added by Faculty, Staff, Volunteers and Observers on the remote control webcams.

Garry Fletcher

Directory of OceanQuest Assignment Resources:

Overview: Are you prepared to take on the challenge of OceanQuest? You are expected to be an active participant in helping to build a valuable resource database for a unique sensitive environment.

The basic starting resources you will use come from www.racerocks.ca but our vision for the future is that you may actively develop a set of internet resources for your own unique ecological area.

Link to The OceanQuest GIS With Curriculum Guide
NOTE: The link to the GIS which ran on an outside server arranged by the Open School has been discontinued.. The other curruculum materials are still valid however on this site.
Topic 1 :
BIODIVERSITY

Some of the following files from www. racerocks.ca were used in the building of the OCEANQUEST website.
Lesson: 1. Structure and Function of Ecosystems :
How can we model ecosystems in order to understand how they work ?
Student Activities: Objectives:
Procedure :
1. Introduction
2. Horizontal distribution

  • Objectives:
    Procedure:

    • 1. Use the remote camera.
    • 2. Use the dichotomous key for identification.
    • 3. Determine the sector from aerial view of horizontal distribution.
    • 4. Field techniques to quantify distribution.
    • 5. Describe the Role of organisms in determining horizontal distribution.
    • 6. Design your own horizontal structure analysis.
    • 7. How do Anthropogenic Impacts affect Biodiversity.
      • Objectives:
        Procedure:
3. Vertical Distribution

  • Objectives:
    Procedure:

    • 1. Use the remote camera.
    • 2. Use the Dichotomous key for identification.
    • 3. Vertical Stratification of Tide Pools
    • 4. Subtidal vertical stratification with seaweed canopy.
    • 5. Vertical Stratification in the water column.
    • 6. Vertical Stratification in Soil
    • 7. Design your own vertical structure analysis.
4. Biotic Components
List of birds and mammals most frequently observed from the remote camera 5.
5. Rare and Endangered Species
6. Coastal Classification System

  • Objectives
  • Procedure:
7. Abiotic Components (Topic 2 below)
8. Ecosystem Function

  • Objectives:
  • Procedure:
9. Biogeochemical cycles

  • Objectives:
  • Procedure:
10. Extension..Other ecosystems– structure and function.
Lesson:
2. Why not Adopt an Ecosystem?
Use the internet as a means to get groups to collaborate to provide an educational resource while ensuring the stewardship of their own local ecological resources.
Objectives:
Procedure:
1. Identify the area
2. Establish goals and time lines
3. Establish a baseline inventory
4. Class project to provide a taxonomy
5. Use technology to document the area
6. Monitor for Structure and Function: (See topic 1.)
7. Submit site for inclusion in GIS
8. Obtain tiff-referenced aerial photography
9. Assemble a web-site to carry the information.
10. Create a list of the Ecosystem Services and Natural Capital of the area.

11.Set up a weather monitoring Station.

TOPIC 2: ABIOTIC FACTORS
Lessons: 1. Selected Abiotic Factors (such as Barometric Pressure) :

The effects of physical factors on the life of an ecosystem is often taken for granted. Here we give you the chance to investigate some of the unique ways that organisms have evolved in order to adapt to the physical conditions of their environments.

Objectives:
Procedure:
1.Introduction
2. Wind Speed and Direction
3. Barometric Pressure
4. Lightning
5. Change through time: Salinity and Temperature.

2. Limiting Factors and the Ecological Niche
Objectives:
Procedure:
1. Introduction
2. GIS activity
3. and 4and 5. Contrast limiting factors in two closely related species.
6. Natural Selection
7. The Ecological Niche as determined by limiting factors
8. Adaptation: A classic study of limiting factors: The Bumpus sparrows.
9. Extension: Central Tendency and Variability.
Topic 3 : ANIMAL BEHAVIOUR
Lessons
1. Population Monitoring:
An activity which allows you to contribute to a scientific database for the census of animals
Objectives:
Procedure:
1. Census of the populations, and the use of the dichotomous key.
2. Race Rocks population numbers and sector designations.
3. Weather correlation to population levels.
2. The Ethology Assignment:
An activity that may allow you to look at the behaviours of animals in a new way
Objectives:
Procedure
1. Preliminary Observation.
2. Collecting Data.. The ethogram and the time budget.
3. Using the dichotomous key for identification.
4. Compiling the Ethogram
5. Preparing the Time Budget
6. Doing a report and submitting results to the GIS
7. Extension material