Hirundo rustica: Barn Swallow


UPDATE 2023 Derek Sterling has taken some excellent photos and written about the return of barn Swallows to Race rocks

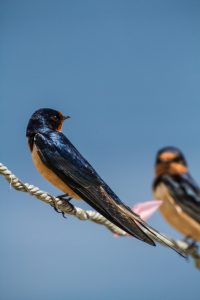
This video shows the barn swallow fledglings in their nest.

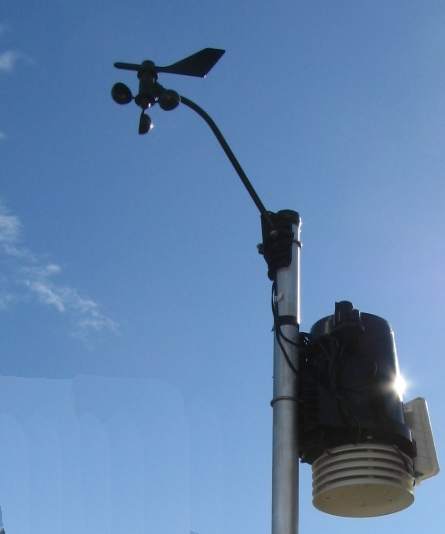
June, 2005: the adult birds were observed going in and out of the vents on the north side of the water desalinator building on Race Rocks.

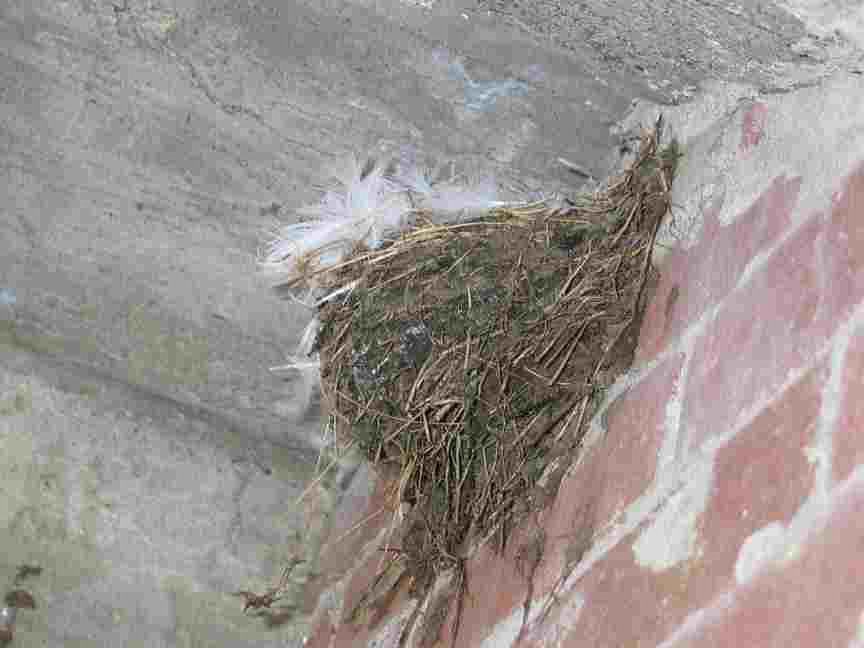
June-July 2006: This nest was built of mud, lined with goose and gull feathers under the concrete stairway of the Marine Science Centre. (Tis structure was replaced with a wooden staircase in 2020) On July 4, they were seen to be flying in and out of the opening frequently. Barn swallows are frequent nesters in rural areas all throughout western Canada. They choose a nesting site always located in an assured dry location.Frequently this is an out-building on a farm with an open door or window. They have excellent aerodynamic  maneuvering control as they fly quickly over open areas catching insects with a wide opening mouth. They are valued for their voracious appetite for mosquitoes and flies. With their food being flying insects, the island certainly provides an abundant supply of the kelp fly Coelopa vanduzeei

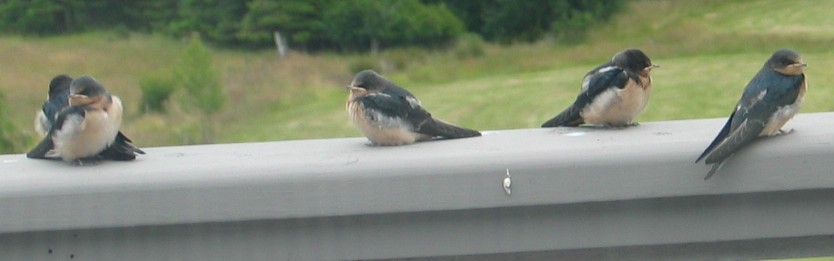
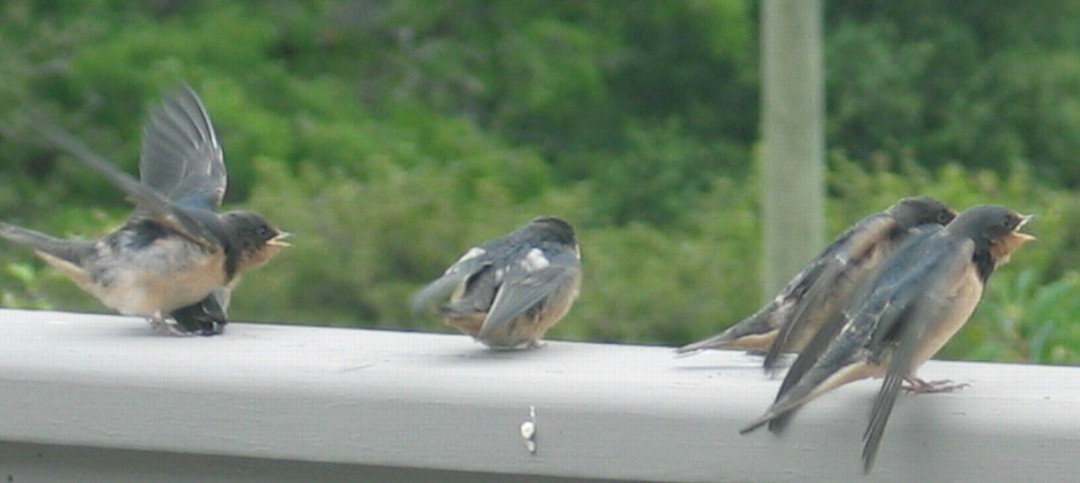
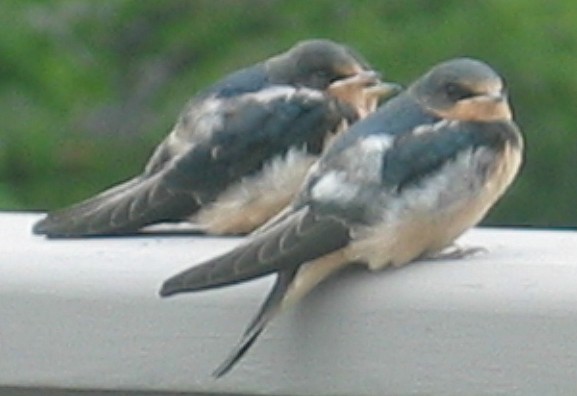
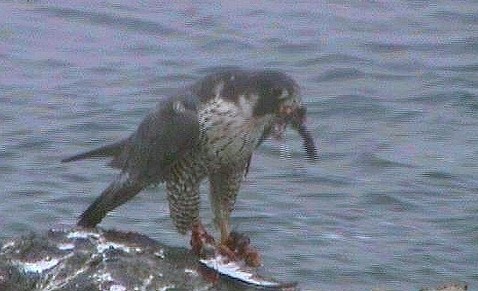
These pictures were taken of a newly-fledged family on a balcony in nearby Metchosin. The juvenile birds were waiting to be fed

An interesting question was posed by someone recently. Since swallows fly from the brightly lit outside rapidly into a dark building, do they have a specially evolved vision system for rapid dark adaptation? We know that bats do this with their echolocation system, but birds don’t have that ability.

Domain: Eukarya
Kingdom: Animalia
Phylum: Chordata
Sub-phylum: Vertebrata
Class: Aves
Order: Passeriformes
Family: Hirundinidae
Genus: Hirundo
Species:
rustica
Common Name:Barn swallow

Physical Description:
The barn swallow is the only one of its family with a deeply forked tail. It can be identified by its rusty under parts and orange rump as well as a dark orange forehead and throat. Like all swallows, it is a strong and elegant flyer. Its legs and bill are short, but it has a wide mouth for capturing insects. These birds are generally around 15 cm in length.


Habitat:
True to its name, the barn swallow is common near farms. It builds a nest of mud on the timbers of barns and other such buildings. It commonly inhabits caves and areas

underneath bridges. Barn swallows are migratory birds, and fly south from North America to South America for the winter.

Reproduction:
The length of incubation for barn swallow eggs is 13 to 17 days. They lay in open-cup nests made of mud pellets and grass. The eggs are speckled and nesting begins in the second half of May. If the pair of swallows is successful, two broods are raised each year.

Feeding Habits:
This swallow feeds exclusively on insects. Hunting typically takes place on or close to ground level. However, on summer afternoons, they can be seen flying high in the air. The barn swallow simply follows the desired insects and catches them in flight.

Global Distribution:
The barn swallow can be found in almost all parts of Canada and the USA. It typically inhabits every continent except Australia. It is a resident of rural areas, and populations are most heavily concentrated in southern Texas and central USA.

Predators:
Predators are most commonly cats and raccoons. When a predator approaches, the entire colony will launch an attack in a display of aerial acrobatics.

Interesting Fact:
The barn swallow’s song is long and twittering. They are commonly known to perch on wires and are often seen in large, mixed flocks.

References:
. Brunn, B. C.S. Robbins, Singer and H.S. Zim. 1966. A Guide to Field Identification, Birds of North America. Golden Press. New York, NY.
. http://www.americanartifacts.com/smma/per/b4.htm
. http://www.museum.gov.ns.ca/mnh/nature/msbirds/bns0261.htm


Other Members of the Class Aves at Race Rocks 
taxonomyiconReturn to the Race Rocks Taxonomy
and Image File
pearsonlogo2_f2The Race Rocks taxonomy is a collaborative venture originally started with the Biology and Environmental Systems students of Lester Pearson College UWC. It now also has contributions added by Faculty, Staff, Volunteers and Observers on the remote control webcams.

December 2005-  Chelsea Howard, Nfld. year( PC year 32)

Phyllospadix scouleri: surf grass– Race Rocks taxonomy


Domain: Eukarya
Kingdom: Plantae
Clade: Tracheophytes
Clade: Angiosperms
Clade: Monocots
Order: Alismatales
Family: Zosteraceae
Genus: Phyllospadix
Species: P. scouleri
Binomial name
Phyllospadix scouleri

Genus/species Phyllospadix scouleri (Hooker)


Description: This flowering plant is most characteristic of the open rocky shores of the coast that are exposed to the full force of the waves, as on the west coast of Vancouver Island.  There it forms bright emerald-green beds on the rocks near extreme low-tide level.  The plants are relatively short, usually not more than a metre in length, and the leaves are 20-32 mm. wide.  Short basal flowering stems are produced, which are 5-8 cm. long.

Habitat:  On rocks in the lower intertidal and upper subtidal zones.

Pacific Coast Distribution:  Alaska to Mexico.

Robert Scagel, 1972

 
taxonomyiconReturn to the Race Rocks Taxonomy
and Image File
pearsonlogo2_f2The Race Rocks taxonomy is a collaborative venture originally started with the Biology and Environmental Systems students of Lester Pearson College UWC. It now also has contributions added by Faculty, Staff, Volunteers and Observers on the remote control webcams. March 8 2009- Ryan Murphy

Diodora aspera: Keyhole limpet– The Race Rocks Taxonomy


Keyhole limpets have a distinctive mantle-covering response when they are approached by a predatory sea star such as Pycnopodia.sp

Physical Description:

it has a small oval opening at the top of its short, conical shell. Although the keyhole limpet superficially resembles “true” limpets, its soft anatomy reveals an important difference. True limpets draw water into their mantle cavity on the left side, pass it over a single gill and discharge it on the right side. Keyhole limpets draw water in both sides, where it flows over paired gills before flowing out through the “keyhole” aperture at the peak of the shell. Size: Length is about 75 mm


Global distribution:
The Rough Keyhole Limpet can be found anywhere in coastal regions from Afognak, Alaska, to Baja California. It is found primarily in low intertidal areas, and has been seen up to 40 feet subtidally in the south (Morris et al. 1980).
Habitat:
The Keyhole Limpet clings tenaciously on and under large rocks in the sub to low intertidal. They can also be found on large kelp stipes. Their strong foot allows them to thrive in some intertidal areas where turbulent wave action is prevalent.

Domain Eukarya
Kingdom Animalia
Phylum Mollusca
Class Gastropoda
SubClass Prosobranchia
Order Archaeogastropoda
Family Fissurellidae
Genus Diodora
Species aspera
Common Name: Key-hole limpet
Feeding: This particular limpet is an omnivorous grazer. It feeds by scraping rocks with its radula. Various bryozoans are its food of choice, but it also consumes algae, as well as some sponge species.
Predators:
Sea stars, the limpet responds by raising its mantle up over the outside of its shell, a behavior that may prevent the sea star from gripping the shell surface.
Reproduction:
Keyhole limpets have separate sexes, and sexually ripe individuals can be found during any season of the year. Eggs and sperm are released into the water in mass quantities and larval settlement ensues.
One interesting Fact: Recent studies suggest that this animal’s unique apical opening is not only associated with sanitation, but also plays an important role in inducing passive flow through the mantle cavity. In studies where the keyhole of Diodora aspera was blocked (either naturally or experimentally) no evidence of damage to the mantle cavity or associated organs was found. In these experimental trials, water entered ventro-posteriorly with respect to the gill tips, and exited over the head region (near the anus). The apical opening proved unnecessary as a means of waste removal. Researchers did find however, that the keyhole played an essential role in allowing water to flow passively through the mantle cavity. Thus, it is thought that this function of the apical opening may have been just as significant as its role in sanitation in terms of limpet evolution

References:
Wylam, B. 2001. “Diodora aspera” (On-line), Animal Diversity Web. http://animaldiversity.ummz.umich.edu/site/accounts/information/
Diodora_aspera.html.

Guide of Marine Invertebrates.- Alaska to Baja California
Daniel W. Gotshall.- Sea Challenges.
Monte Rey – California, USA 1994

Other Members of the Phylum Arthropoda at Race Rocks 
taxonomyiconReturn to the Race Rocks Taxonomy
and Image File
pearsonlogo2_f2The Race Rocks taxonomy is a collaborative venture originally started with the Biology and Environmental Systems students of Lester Pearson College UWC. It now also has contributions added by Faculty, Staff, Volunteers and Observers on the remote control webcams.

 October 2005-  Claudia (PC yr 32)

Heptacarpus tenuissimus: The Race Rocks Taxonomy


A very small shrimp, not often noticed but probably common at Race Rocks.
Domain Eukarya
Kingdom Animalia
Phylum Arthropoda
Class Malacostraca
Order Decapoda
Family
Genus Heptacarpus
Species tenuissimus
Common Name:
slender coastal shrimp

Other Members of the Phylum Arthropoda at Race Rocks 
taxonomyiconReturn to the Race Rocks Taxonomy
and Image File
pearsonlogo2_f2The Race Rocks taxonomy is a collaborative venture originally started with the Biology and Environmental Systems students of Lester Pearson College UWC. It now also has contributions added by Faculty, Staff, Volunteers and Observers on the remote control webcams.

 March October 2003- 

ARCHIVE of Education in the Race Rocks Ecological Reserve

In this file, photos are presented which link to a number of the field labs and other educational applications of Lester B. Pearson College that have taken place at Race Rocks in past years.

Biology Class 1999
Env Systems TIdepool lab 1999
Royal Roads Field Trip
Env Systems 1999
Biology Class 1999
Env Systems 1998 Biology Field Lab 1998 Diving Activity: Schools Project. Group 4 projects 1998
Environmental Systems
Transect Lab on Peg 15 , 1998
Env Systems 1997 Diving Schools activity OUTPOST video Drogue lab : Currents
Environmental Systems Class
Tidepool Study , 1997
Environmental Systems
Current Study 1996
Env Systems 1996
Env Systems 1995
Diving : Schoools project Biology Field Lab 2004
Diving
education- research
Pearson College and Diving at Race Rocks

Lightning as an Abiotic Factor at Race Rocks

Lightning is a very rare occurrence on this part of the Pacific North West Coast, however we show below a method of recording lightning strikes which can be used to compare with other regions of North America. The unusual thing about lightning is that it can occur here in the Strait of Juan de Fuca in what is the winter months in North America. When lightning is never recorded in the interior…at least of Canada.
We are interested in noting Lightning as an abiotic factor because it contributes to the sum total of Atmospheric Nitrogen Fixation and is therefore an important feature for all organisms which are dependent on nutrients from the Nitrogen Cycle. Nitrogen fixation involves Nitrogen, which is a relatively inert gas, which is plentiful in air, being made to combine chemically with other elements to form more reactive nitrogen compounds such as ammonia, nitrates, or nitrites.
This space is reserved for the first person to record a lightning strike from the remote control cameras at Race Rocks!
OBJECTIVES: After doing this assignment, students will be able to:a) Find out where lightning strikes are presently occurring in North America.
b) Evaluate the importance of lightning in the Nitrogen Cycle.
c) Enumerate the other abiotic effects on organisms of lightning strikes.

Procedure:1. The enormous energy of lightning breaks nitrogen molecules and enables their atoms to combine with oxygen in the air forming nitrogen oxides. These dissolve in rain, forming nitrates, that are carried to the earth. Atmospheric nitrogen fixation probably contributes some 5– 8% of the total nitrogen fixed. See the table below for a comparison of sources of Nitrogen Fixation. The major conversion of N2 into ammonia, and thence into proteins, is achieved by microorganisms in the process called nitrogen fixation (or dinitrogen fixation). Give examples of how this process is essential for life. Include the connection between the muscle in your arm and the process of Nitrogen Fixation.

In this picture.. Alex Chan PC yr 32 is trying to get the nitrogen fixing Lathyrus or Beach Pea lined up with Tower at Race Rocks. Check the Beach Pea file to see how well he did.

2.See the file on Biogeochemical Cycles , and construct a Nitrogen cycle from the Race Rocks image clips.

3. The Weather Office of the Government of Canada presents updates of the lightning strikes in North America

Record the Frequency and Location of Lightning strikes on three separate days when you view this link.

4. Click on the prerecorded sample maps below which show the location and intensity of lightning strikes in the area of the Strait of Juan de Fuca over the period of an hour. In the legend to the left, the estimated frequency of Lightning is depicted as flashes per 1000 square km* per minute as follows:

  • Very Frequent (Red) = more than 6 per minute
  • Frequent (Orange) = 3.0-5.9 per minute
  • Occasional (Yellow) = 1.5-2.9 per minute
  • Isolated (Blue) = less than 1.4 per minute

Note*: 1000 square km represents a circle having a radius of 17.8 km

In the image to the right, you can see the contrast in frequency and intensity of strikes on a July evening. “>
January 31, 2006 2300 hrs
July 3, 2006 1100hrs
The Data below is from various sources, and has been compiled by DF Bezdicek & AC Kennedy, in Microorganisms in Action (eds. JM Lynch & JE Hobbie). Blackwell Scientific Publications 1998. It appears in the website: The Microbial World: N2 fixed (1012 g per year, or 106 metric tons per year)
Type of Fixation
Non-Biological
Industrial about 50
Combustion
about 20
Lightning————–Compare with these other sources ——————-> about 10
Total about 80
Biological
Agricultural land
about 90
Forest and non-agricultural land
about 50
Sea
about 35
Total about 175
5. Extension..for further investigation: Find out why lightning is rare in the winter time in North America, but common in many areas in the summer. If you are from one of these areas that experience many lightning strikes, determine why they are abundant in some areas and not in others. Might you advance an hypothesis on how seasonal differences in Lightning Strikes could affect productivity of plants?( You might want to consider what grows in winter before you jump to conclusions here!)

Abiotic Factors Project

Student Guide
Orientation
Have you noticed reports in the media about climate change and loss of species diversity?Have you ever encountered a special location which has a unique set of organisms that one doesn’t see anywhere else?Have you ever wondered why within a very short distance, the types of animal and plant communities can change entirely, whereas in other areas, one can go for hundred of kilometers without a change of species composition?Have you ever tried to make a plant grow where you want it to grow but find out it keeps dieing?We are slowly becoming aware that in order to preserve a species , we have to be sure the ecosystem of which it is a part is preserved intact..This project will enable students to contribute to a project which may help to shed some light on the questions above. We hope it becomes something that anyone can do long after they get the introduction through this exercise.
OBJECTIVES:1. Present hypotheses on the effect of an abiotic factor on the distribution of an organism, and data which supports the hypothesis.

2. Present evidence for why species change is predicted to be the result of climate change.

3. Relate the occurrence of climate change to species extinction.

4. Analyze the historic records for sea water temperature to see if you can find evidence for climate change.

5.Use the remote control camera to record the effects of weather extremes and correlate these with real time weather data.

PROCEDURE:

1. Introduction: On the website racerocks.ca, we have made an effort to show the relationships between species distribution and abiotic factors. Separate files for nine atmospheric factors and 8 ocean related factors are available from this environmental data index page: Take some time to familiarize yourself with the wide range of abiotic factors which we are recording at Race Rocks and at the files which show how those abiotic effects effect the organisms of the environment. Your task in this assignment is to record a graph of a weather event and correlate it with an image of the environmental response captured from the remote control cameras.  See this file on Correlation Investigations

2. Wind Speed and Direction, are very significant factors in this kind of Coastal Ecosystem. Studies on correlations of barometric pressure and wind speed are also suggested in the Correlation File 

3, Barometric Pressure and the Effect on Organisms: There is some question as to whether organisms can sense changing barometric pressure. Click on this file about barometric pressure and evaluate the evidence that scientists use to show that some organisms do have the ability to detect changing barometric pressures. What is the adaptive advantage of this ability? You may, with careful observation of animal behavior, come up with some evidence either supporting or rejecting this ability. On the racerocks.com weather station, track the weather at Race Rocks for a week. Within that time note the behaviour of animals when the barometer graph is peaking and then dropping . Can you establish a correlation between activity and impending storms?
Hint: to quantify, select a number of times from the graph when the wind is at it’s peak, and the barometer is at a low. Is there always a time lag, if so how much?.

4. Lightning as an Abiotic Factor:
Some of the factors are much more important than others. For example: Lightning is of minor importance most of the time at Race Rocks, or for that matter, anywhere in the local Strait of Juan de Fuca area, compared to wind speed and direction.
Use the link on the lightning page to find out where lightning is presently occurring in North America. Calculate the frequency of lightning strikes and the area which is affected for any one viewing session. Find out from the reference about the abiotic effects of Lightning, about one of the important effects of Lightning related to Nutrient Cycles . There are obviously other abiotic effects of lightning. List two that you can come up with here.
If you can take a screen shot in the summer of this map showing lightning in the Strait of Juan de Fuca, enter it as an observation on the OceanQuest GIS sighting record.5. 5. Change Through Time:
The records of Salinity and Temperature have been collected by the lightkeepers at Race Rocks up to 1977 and by the Marine Protected Area Guardians from that time to the present. These records provide a valuable insight into how factors can remain stable or change over time. See the Archive of Seawater Temperature and Salinity 1921-present


Animal Populations and Behaviors

BACKGROUND: In the populations of animals which we encounter at Race Rocks, we see a good representation of the biodiversity of the area. For years we have wanted to get a better idea of the levels of the bird and mammal populations throughout the year and also from one year to another. We have had scientists record the Christmas Bird Count in recent years, but we also need to have an idea of the population levels throughout the year. Scientists can determine the health of an ecosystem by knowing the trends of the populations through time. You have an opportunity here to contribute to the body of knowledge about the changes in populations through time.
Objectives: After doing this assignment, students will be able to:

a) Gather census data on populations of animals at Race Rocks using the remote cameras.

b) Use a simple dichotomous key for the identification of species.

c) Analyze the seasonal trends in populations of birds and mammals from Race Rocks

d) Describe the correlations between population trends on a particular day, and climatic conditions.

(If you are on sight at RR) you can document populations of species closeup such as in the surge channel or tidepool areas. Also physical factors such as ph, Salimnity and temperature, along with stratification can be recorded. These change through the seasonsd. If there is no reference file set up for one of the areas , feel free to start one and contribute it here. )

Procedure:

1. Census of Population: We will be estimating the numbers of a particular species in the areas visible from the remote control camera 1 or camera 5 of racerocks.com. Choose a bird or mammal species while viewing the area through camera .Verify the identification of a species observed by using the Dichotomous key for birds and mammals of Race Rocks.

2. Estimate the numbers of individuals of this species in the various sectors of the island visible from camera 5 and or camera 1. Record these in your data book.The ecosystems of Race Rocks are identified below in Table 1.

( You do not need to cover all sectors, however, if you choose a few and monitor them several times, you will get some figures that can be used to establish correlations with time of year, time of day, weather conditions or whatever you define as a possible physical factor that determines population distribution.)

3.Record the location of the population on the Sector maps of Race Rocks. Click on the appropriate image below for the sector designation. Where possible, capture a photo and include it with your data report..

4. Record the weather conditions from the weather page, and indicate weather you think that they have any effect on the population levels and locations.

Note: In the table below other sectors not visible from the cameras such as the tidepools have been numbered. If you are doing research on the island you can link to thespecific tidepool file with the number referred to in the list below.
Great Race Sectors from Cam 1 Great Race Sectors Race Rocks Reserve Sectors
Great Race Sector Image Map for Camera 1 views
Click on the pink-outlined polygons to identify the extra views from camera 1 not visible from cam 5.
Great Race Sector Image Map for Camera 5 viewsClick on the red-outlined polygons to identify the views from camera 5. Race Rocks and Race Passage Sector Image MapClick on the red-outlined polygons to identify the outer islands views from camera 5
TABLE 1: Race Rocks Sector Designations:
1.0.1.1.8 Race Rocks
1.0.1.1.8.1 Shore and Rock Rise North East of Jetty
1.0.1.1.8.1.1 East Rock rise
1.0.1.1.8.1.1.1 East of House and Bay

1.0.1.1.8.1.2 East shore
1.0.1.1.8.1.3 Water to East
1.0.1.1.8.1.3.1 within 1 km
1.0.1.1.8.1.4 underwater
1.0.1.1.8.28.6 Winch House and grass plain
1.0.1.1.8.28.7 North lawn to dock
1.0.1.1.8.3 Shore North of Jetty
1.0.1.1.8.3.1 Tidepool#14
1.0.1.1.8.3.2 Tidepool#15
1.0.1.1.8.3.3 Tidepool#16
1.0.1.1.8.3.4 Tidepool #17
1.0.1.1.8.3.5 Tidepool#18
1.0.1.1.8.3.6 Tidepool#19
1.0.1.1.8.3.7 Tidepool #20
1.0.1.1.8.3.8 Crevasse
1.0.1.1.8.3.8 underwater
1.0.1.1.8.4 Jetty and Jetty Bays
1.0.1.1.8.4.1 underwater
1.0.1.1.8.5 North Perch by cam 5
1.0.1.1.8.6 West Perch and cliff face
1.0.1.1.8.6.1 underwater

1.0.1.1.8.7 Rain Pools and close foreground -cam5
1.0.1.1.8.8 Heli pad and near camera 5
1.0.1.1.8.9 West shore and tide pool area
1.0.1.1.8.9.0
1.0.1.1.8.9 .1 Tidepool#1
1.0.1.1.8.9 .2 Tidepool#2
1.0.1.1.8.9 .3 Tidepool#3
1.0.1.1.8.9 .4 Tidepool#4
1.0.1.1.8.9 .5 Tidepool#5
1.0.1.1.8.9 .6 Tidepool#6
1.0.1.1.8.9 .7 Tidepool#7
1.0.1.1.8.9 .8 Tidepool#8
1.0.1.1.8.9 .9 Tidepool#9
1.0.1.1.8.9 .10 Tidepool#10
1.0.1.1.8.9 .11 Tidepool#11
1.0.1.1.8.9 .12 Tidepool #12
1.0.1.1.8.9 .13 Tidepool#13 artificial tp
1.0.1.1.8.9 .14 underwater

1.0.1.1.8.10 SW corner by surge channel rock
1.0.1.1.8.10.1 Surge Channel
1.0.1.1.8.10.2 South East Rise
1.0.1.1.8.11 South shore to Engine Room
1.0.1.1.8.11.1 Outfall surge channel
1.0.1.1.8.11.2 Shoreline
1.0.1.1.8.11.3 Underwater
1.0.1.1.8.12 Science House and lawn areas
1.0.1.1.8.13 Tower and Base area
1.0.1.1.8.14 Shore South and East of tower
1.0.1.1.8.15 South Rock Islands
1.0.1.1.8.15.1 Beyond South Rocks to Strait
1.0.1.1.8.15.1 underwater
1.0.1.1.8.15.2 underwater Rosedale reef
1.0.1.1.8.16 South-east rock beach bay
1.0.1.1.8.17 North side of the Keeper’s House
1.0.1.1.8.18 Water channel off docks
1.0.1.1.8.18.1 underwater
1.0.1.1.8.19 Middle Island
1.0.1.1.8.19.1 East islet of middles
1.0.1.1.8.19.2 Main middle
1.0.1.1.8.19.2.2.1 underwater
1.0.1.1.8.19.3 Turbine Channel
1.0.1.1.8.19.3 underwater
1.0.1.1.8.20 North Rock
1.0.1.1.8.20.1 underwater
1.0.1.1.8.21 North to Pedder Bay and Victoria

1.0.1.1.8.22 Race passage to Bentinck Island
1.0.1.1.8.23West ocean view area
1.0.1.1.8.24 West Race Rocks
1.0.1.1.8.24.1 underwater
1.0.1.1.8.25 Strait of Juan de Fuca West and South
1.0.1.1.8.25.1Within 1 km
1.0.1.1.8.25.2 Beyond 1 km

Lesson 2: Animal Behavior.Go to this file for the Animal Behavior lab.
Link to the Reference File for the Census Lab:

THE ENERGY FLOW ASSIGNMENT

OBJECTIVES: After doing this assignment, you will be able to:a) Trace the pathway of the flow of energy in a portion of the Race Rocks Ecological Reserve.

b) Use a symbolic model to represent energy flow in your own ecosystem.

c) Discuss the contributions of the Odum brothers to the science of Ecology.

PROCEDURE:1.Energy Flow in the Ecosystems of Race Rocks can be partially represented by the figure1.Click on any of the boxes to see the organism which is part of the energy flow and the food web of the Islands.
2. You will have seen that some of the links, especially for the top level consumers have videos and slide shows of energy flow in action involving the predators at Race Rocks. Some of these images have been submitted by viewers using the remote camera 5 .
Your challenge is to come up with a picture or a set of pictures which show energy flow in action. Watch the seabirds on the island, especially in the summer during nesting season as they deliver food to chicks. At low tide, you can often see shorebirds like the Black oyster-catcher as it hammers away at intertidal invertebrates for food. Use the OceanQuest GIS sighting report process to add your observation to the records.3. Use this blank template to construct an energy flow model for your observation.( For further information on the definition of the symbols, see #4 below. You can eliminate most of the boxes, just include ones for which you have direct evidence.4.This is a link to a resource which outlines the theory of modelling energy flow with odum symbols. You may also use it for further ideas that will help you in the construction of an energy flow diagram your own ecosystem.

5. Extension material: Investigate the work of the Odum brothers, in material linked at the bottom of the reference in #4. Write a paragraph on the significance of their work for the modern understanding of Ecology.

6..Extension Material: Investigate the application of the Odum Energy Flow Models in the reference below on the Ebro Watershed.


Figure 1: Energy Flow at Race Rocks…click on the symbols below

For Further Reference on the application of this model: External Link: Models of Energy Flow for Rural Planning in the Ebro River Watershed

Structure and Function of Ecosystems

BACKGROUND:
The “ECOSYSTEM PARADOX” : The assemblage of organisms and the physical, chemical, geological, and biological factors that determine their numbers, is what an ecosystem is all about. This community of organisms and the non-living environment with which they interact is called an ecosystem and all the populations of organisms inhabiting an area are a community .It is important to understand that these designations provide a convenient model or framework which enables us to understanding complex and interdependent processes. In the real world however, discreet packages called “ecosystems” do not actually exist, since everything on the planet is ultimately interrelated.Despite this, it is much more practical and convenient for scientists to look at the smaller interacting units of the planet, so we define oceanic ecosystems according to where they occur and the type of organisms which live in them. In this part of the OceanQuest Project, we will investigate some specific examples of how we can organize an ecosystem in our own minds in a famework of Structure and Function.
OBJECTIVES: After doing this project, you will be able to: a) Outline what is meant by the structure and Function of an Ecosystem using as an example an ecosystem near where you are living.

b) Analyze how the effects of vertical stratification in your ecosystem produce a number of different micro-habitats, and predict the effect of this on organisms.

c) Describe the causes of horizontal distribution in several examples from the Race Rocks Ecosystems and then show similar examples in your own ecosystem

d) Document the kind of abiotic factors which are important in the Race Rocks Ecosystems and then describe those which determine your own ecosystem.

e) Model the process of Energy flow in an ecosystem.

f) Model how Biogeochemical cycles operate in ecosystems.

g) Add the coastal classification designation to the level of the biotope to your observations .

h) Determine how the presence of rare species may be determined by environmental factors.

PROCEDURE:
Introduction:
1. Table 1 below shows one outline of the way that we can look at any ecosystem. You can see that there are a number of completely different components, which alone do not mean much. When taken together however, they help us to understand how the ecosystem is really working. In fact they help us to create a better “Model” of how the ecosystem works. Since many of our environmental concerns today are related to how we are damaging, interfering with, modifying or restoring ecosystems, it is useful to know how these whole systems work.. Take a full page and make an outline in a notebook with spaces similar to those shown in Table 1. Use this outline to help guide you through the different parts of Structure and Function. Make notations in the boxes to help you remember important points about how you will look at your own ecosystem.
2. One of the advantages of using Race Rocks as a model to study ecosystems is that many parts of these components can be studied remotely on the internet. Go to this file to see how you might use the robotic cameras to study the horizontal distribution of the ecosystem. It also provides several examples of how you can determine horizontal distribution of organisms.

3 . Since Race Rocks is rather devoid of trees, the vertical distribution of the ecosystem is not so obvious. It is however an important factor on a different scale, in the intertidal zone, in the tidepools, on the thinly vegetated rock surface and even below the ground. See this file on vertical distribution on the Race Rocks website which documents some of these variations. Then design your own protocol for analyzing the effect that vertical stratification has on the abiotic factors affecting the species of an ecosystem.
4. Biotic components comes next in our attempt to model the structure of the Ecosystem. All ecosystems have a set of organisms which are specific to that ecosystem. In some cases, the set of organisms indeed is the defining character of the ecosystem. We speak of “index species” or “the biotope” to help us define and characterize the ecosystem. On racerocks.com, we are continually updating the list of organisms which occur in the many definable micro-ecosystems of Race Rocks.

The students of the Biology and Environmental Systems classes of Lester Pearson College have helped in the production of the Race Rocks Taxonomy. If you go to that link, shown below, you can work through the hierarchy of a system of classification which allows you to pull up photographs, videos and descriptions of the species we have identified. Also a set of directions which can help you to set up your own taxonomy of an ecosystem near you can be found in the Adopt an Ecosystem assignment.In order to be sure that you understand how our Taxonomy works, we will go through the process of looking for information on the Elephant seal.

a) From the racerocks.ca home page click on the Ecosystem icon.

b) Select the image of The Race Rocks Taxonomy.

c) Follow with your cursor Kingdom Animalia/Phylum Chordata/Subphylum vertebrata/Class mammalia/ and then in the list you should see Mirounga angustirostris, the Northern Elephant Seal. You have essentially followed through the classification right to the genus and species level of this marine mammal often visible at Race Rocks.

5. Rare and Endangered Species: In some areas you will have rare, or endangered species. The abiotic factors may be so specific that only few organisms have adapted to survive in that ecological niche. Choose one of the species shown here that have been sighted only occasionally at Race Rocks, and propose an hypothesis about how environmental factors may determine the distribution of the rare species. It is anticipated that changing climatic conditions as the result of anthropogenic impact might lead to a change in the species that can tolerate the environmental conditions of the future.
6. We will now look at a new concept which involves classification of Coastal Ecosystems in terms of the “Biotope” The Biotope represents the quantum unit of the habitat combining both the abiotic habitat and its fixed biotic components.
7. Many of the abiotic components of the Structure of an Ecosystem are monitored at Race Rocks, and are indexed here in the Index of Race Rocks Environmental Data Index. .

Review this index, noting in particular that there are three sections devoted to :
PRESENT WEATHER DATA AND FORECASTS.
TERRESTRIAL ABIOTIC or PHYSICAL FACTORS
OCEANIC ABIOTIC or PHYSICAL FACTORS
Information from the weather station at Race Rocks provides the weather data when you add a sighting in the OceanQuest GIS database. Go to the Lesson on Abiotic Factors, where you will be able to investigate in greater detail how these determine the Structure of Life in the Ecosystem.

8. In the ECOSYSTEM FUNCTION section, Energy flow is modelled by a diagram showing the flows of a part of the food web for Race Rocks.

Go to this exercise to see what is involved in modelling energy flow and then draw your own energy flow models of your favorite ecosystem.

9.Biogeochemical cycles represent the other part of the FUNCTION of ECOSYSTEMS.
In this part of the assignment, you will be able to assemble some examples of biogeochemical cycles from images of Race Rocks, and from this get the ideas of how to model your ecosystem’s biogeochemical cycles.
TABLE 1. Structure and Function of Ecosystems
1.0 ECOSYSTEM STRUCTURE
1.0.1 DISTRIBUTION OF
POPULATIONS OF SPECIES
1.0.1.1 Horizontal Distribution
1.0.1.1.1 random
1.0.1.1.2 regular
1.0.1.1.3 clumped
1.0.1.2
Vertical Distribution
1.0.1.2.1 Elevation
1.0.1.2.2 Stratification (terrestrial)
1.0.1.2.3
Vertical Stratification (Oceanic)
1.0.1.3
Temporal
Distribution
1.0.1.3.1
Present time
1.0.1.3.2
Hourly patterns
1.0.1.3.3
Monthly patterns
1.0.1.3.4
Yearly patterns
1.0.1.4.5
Long term patterns
1.0.2.1 Domain Eukarya
1.0.2.1.1
Kingdom Animalia
1.0.2.1.2
Kingdom Plantae
1.0.2.1.3
Kingdom Fungi
1.0.2.1.4
Kingdom Protoctista
1.0.2.2 Domain Eubacteria
1.0.2.3 Domain Archaea
1.0.3.1 Solar Energy
1.0.3.2 Wind Speed and Direction
1.0.3.4 Precipitation
1.0.3.5 Temperature
1.0.3.6 Current
1.0.3.7 Salinity
1.0.3.8 List Others??
2.0 ECOSYSTEM FUNCTION
2.0.1.1 Autotrophs
2.0.1.2 Heterotrophs
2.0.1.3 Decomposers
2.0.2.1 Carbon Cycle
2.0.2.2 Nitrogen Cycle
2.0.2.3 Phosphorous Cycle
2.0.2.4 Potassium Cycle
2.0.2.5 Calcium Cycle
2.0.2.6 Water Cycle
2.0.2.7 add other cycles
10.Extension materials: Report on how a research team is studying the Structure and Function of other Ecosystems. Use one of the following external links:ARCTIC and ALPINE Ecosystem Structure and Function Research.<.http://instaar.colorado.edu/research/ecosystems.html>