PEG 15 TRANSECT
ENVIRONMENTAL SYSTEMS CLASS
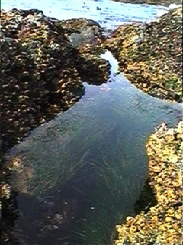
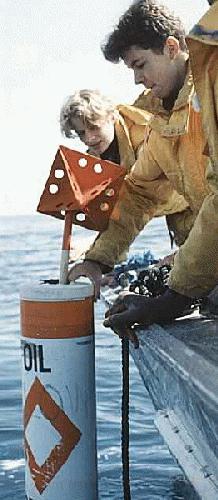
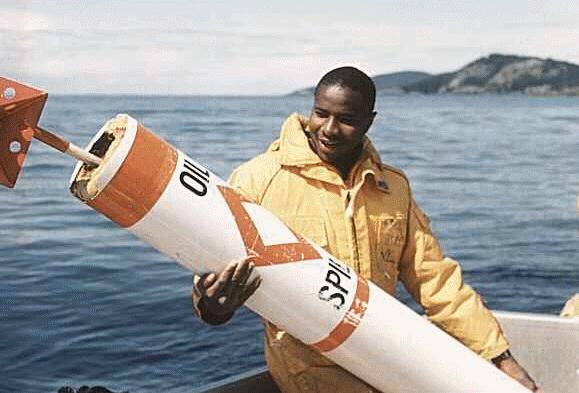
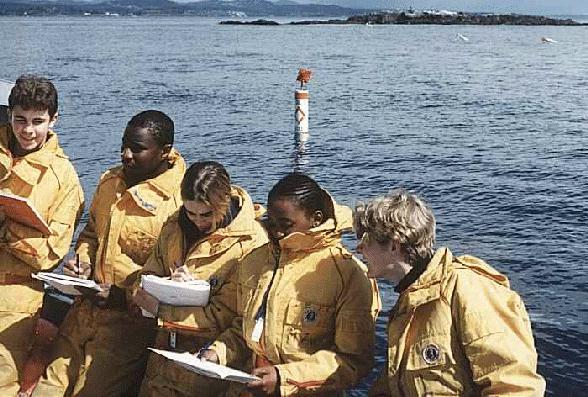
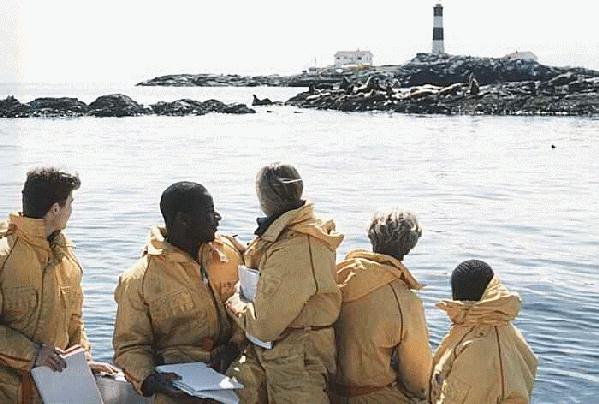
 April 1998: For this Exercise, a section of gently sloping shoreline to the East of the Docks at Peg #15 was chosen.(large old original oil-barge docking post This intertidal zone rock is exposed to the North West, but protected by the corner of Great Race Island projecting to the West. The transect was laid at a bearing of 285 degrees. Maximum exposure of the area occurs when the wind blows from the North East in the winter months. This work was done in April when the area experiences the first of the low tides in the early part of the day.
-
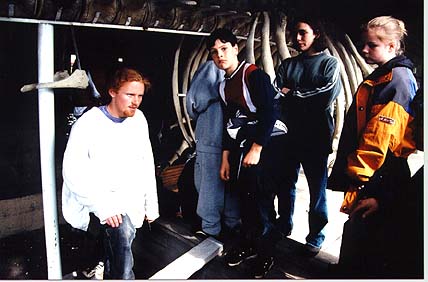
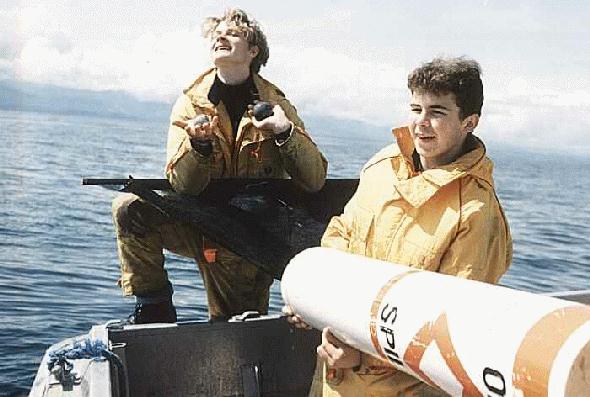
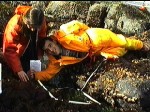
- Nick at the end of the line
-
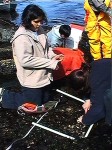
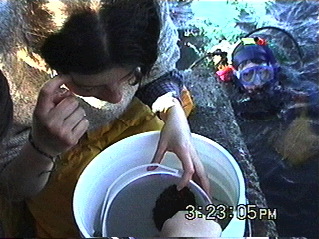
- Andria checks one quadrat
-
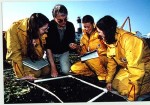
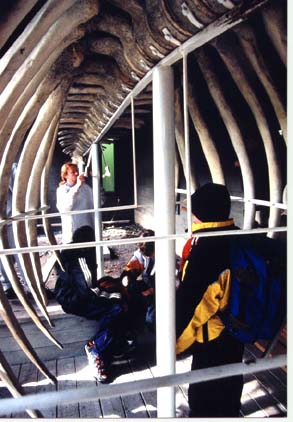
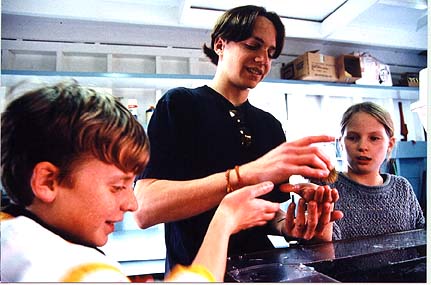
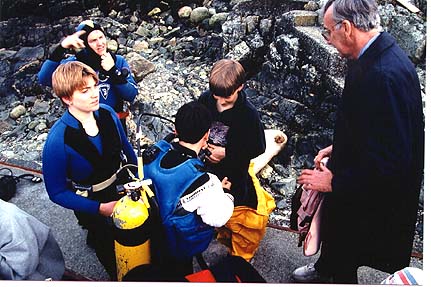
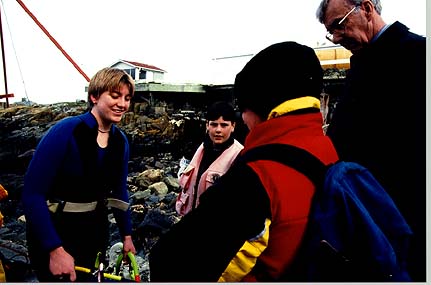
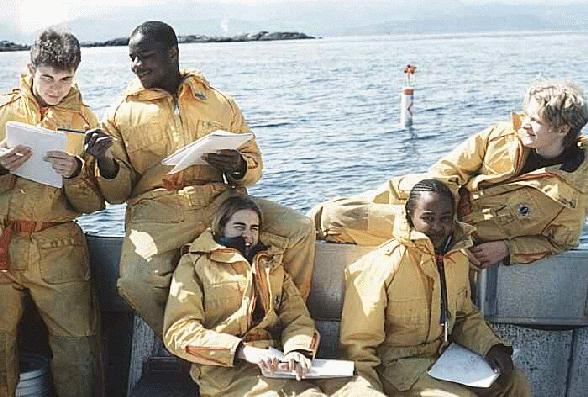
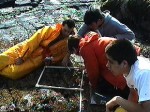
- Ragen and Tara with Garry
-
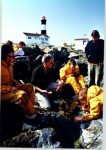
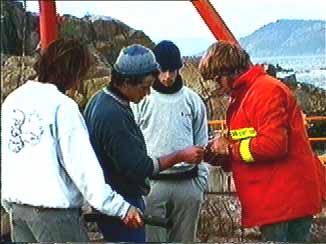
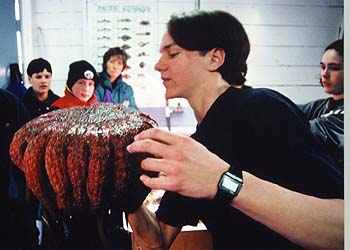
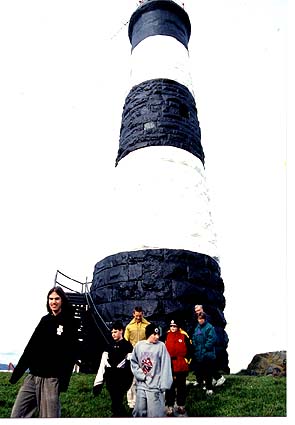
- Garry and class
-
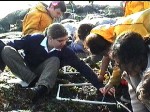
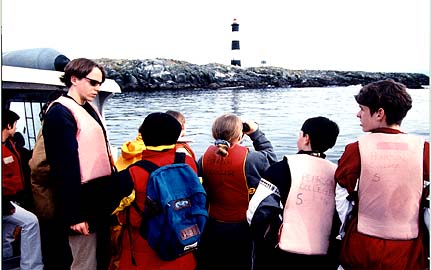
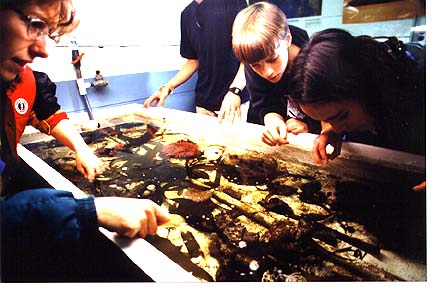
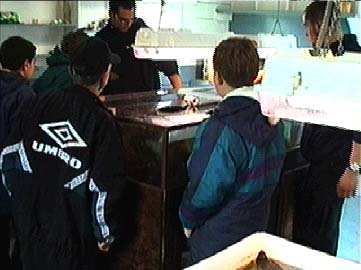
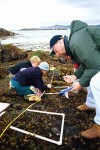
- Sara counts invertebrates
-
- Sebastien as part of the count
-
- Sebastien again
-
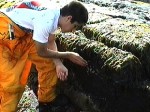
- Jose checks out the algae
 Also see the images of the Royal Roads students working on peg 15 in the summer of 1999.
The following is the transect strip. It will take a few minutes to download the whole strip ..
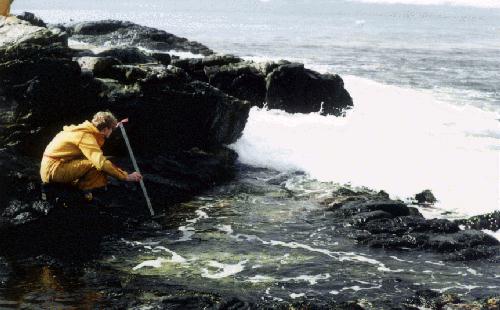
The photos for the transect strips were taken in 8mm video by Sebastian and Garry after the class recorded the details of species distribution over the 50 cm strip, running perpendicular to the shoreline.
Images of the students were scanned from slides taken by Duane Prentice, a professional photographer who lives in Victoria and is an Alumni of Pearson College.. Images copyrighted, 1999 by Duane Prentice.
|
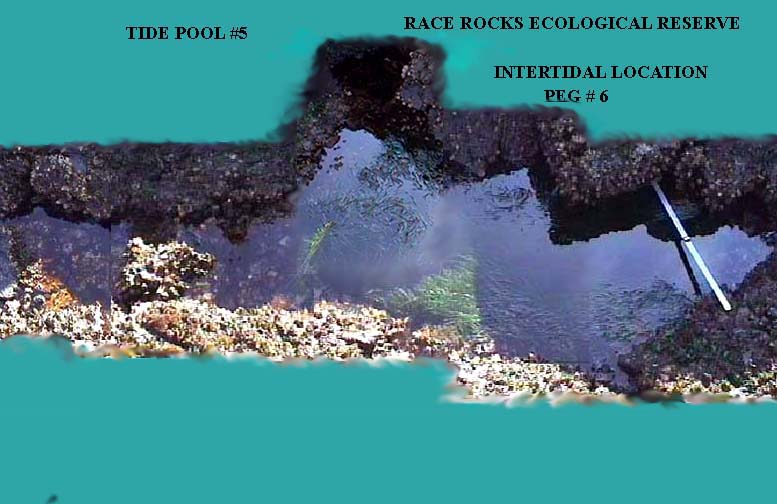
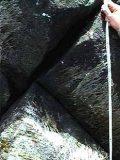
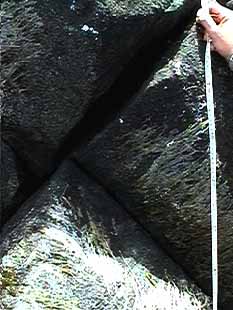
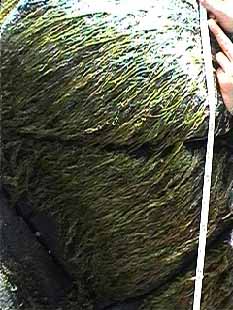
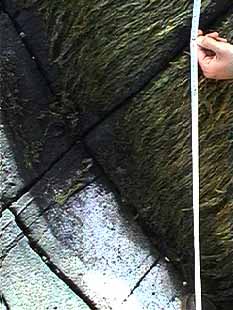
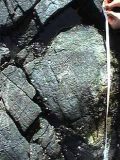
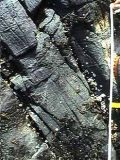
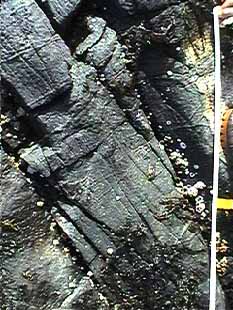
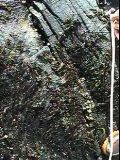
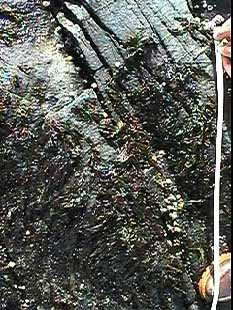
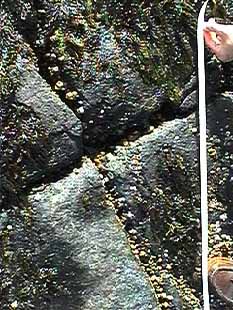
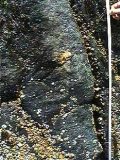
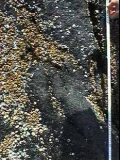
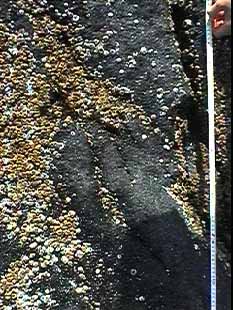
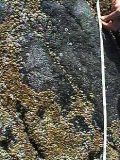
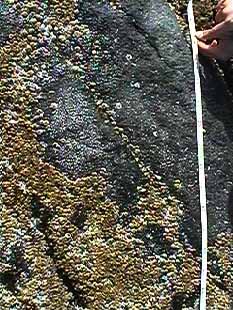
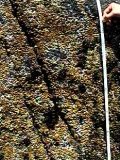
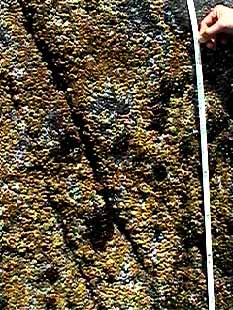
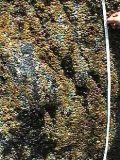
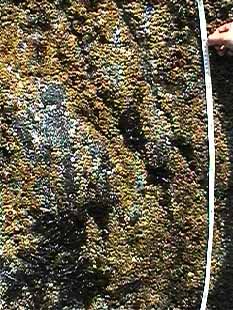
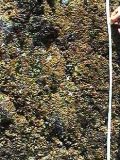
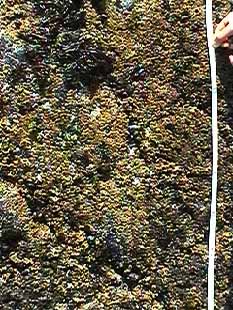
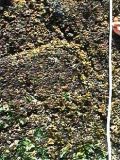
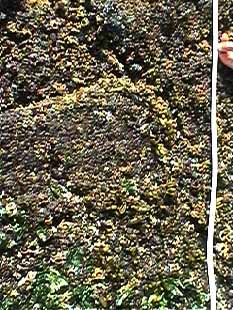
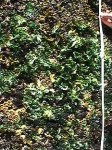
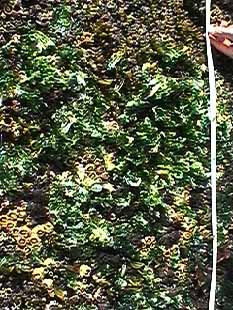
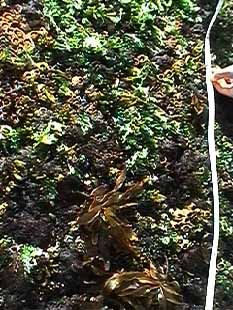
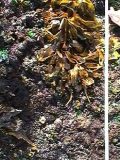
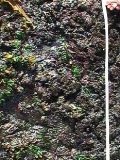
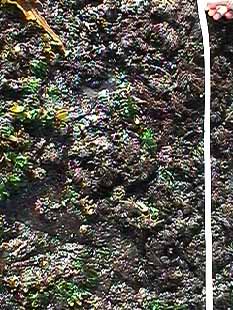
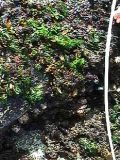
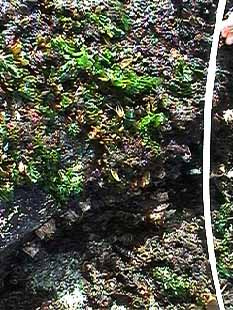
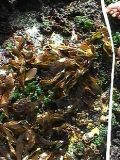
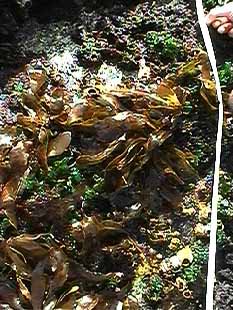
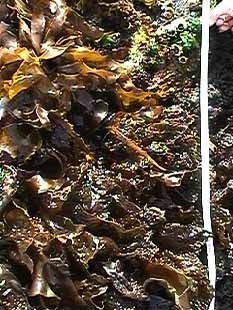
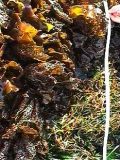
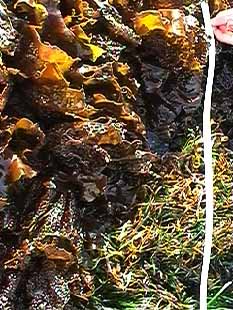
PEG 15 : PHOTO BELT TRANSECT
|
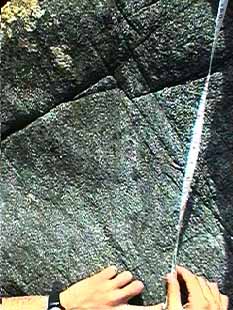
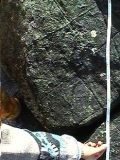
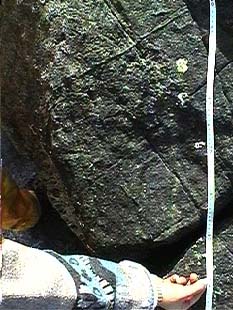
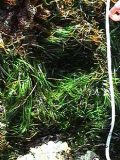
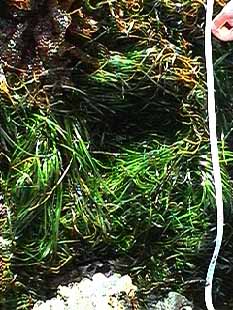
Bearing 285 degrees. This area has a fairly constant slope for the 12.5 meters over a vertical range of 3 meters.The photos, one half meter in length, were taken from a video at low tide, in APRIL 1998 by Garry and Sebastian. |
| Investigation: | 1. Plot a profile of the shoreline given the information provided.2. Determine the percentage coverage of the different species of algae shown.3. The physical factors of the habitat of an algae living high in the intertidal zone like Porphyra changes with the seasons. In this area, our low tides occur in the daytime in the summer and in the night time during the winter. It would be revealing to compare the exposure during the daytime in February or March with the exposure in June. First determine from the profile drawn above, the range of tidal level where this species lives intertidal. Then go to the data page where you can access the Tidal Predictions for Race Rocks . From the tidal level profile for Victoria, you will be able to see a graph of the tide levels .Determine how many hours this Porphyra will be exposed to the air by recording the cumulative lengths of time that the water level does not go above the lower limit of the algae. If you do this for different times of the year, you will be able to quantify the time spent submerged or emmerged over a number of days. Be sure to take into account the time of the tidal cycle when choosing days to measure, because you will notice a two week pattern of Spring ( maximum range ) and Neap( minimum range) tides.
Based on your evidence, suggest a hypothesis that could explain why this algae disappears from this area for most of the summer. |
BELT TRANSECT PHOTO
-
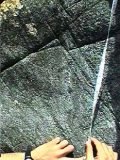
- 0.5 metres
-
- 1.0 metres
-
- 1.5 metres
-

- 2.0 metres
-

- 2.5 metres
-
- 3.0 metres

-
- 3.5 metres
-
- 4.0 metres
-

- 4.5 metres
-
- 5.0 metres

-
- 5.5 metres
-
- 6.0 metres
-
- 6.5 metres
-
- 7.0 metres
-
- 7.5 metres
-
- 8.0 metres
-
- 8.5 metres
-

- 9.0 metres
-
- 9.5 metres

-
- 10.0 metres
-
- 10.5 metres
-
- 11.0metres
-

- 11.5 metres
-
- 12.0metres
-
- 12.5 metres
See Transect A0050101
See Transect A0050102
See Transect A0050103
___________________________________________________________
![]()
Return to the Contents page for Environmental modelling with Transects..