Lab on Primary Productivity of Pyramimonas


Lab on Primary Productivity of Pyramimonas

See the video on a discussion of the high tidepools and productivity

Background: (adapted from Vernier lab 23 of “Biology with Computers”)

Oxygen is vital to life. In the atmosphere, oxygen comprises over 20% of the available gases. In aquatic ecosystems, however, oxygen is scarce. To be useful to aquatic organisms, oxygen must be in the form of molecular oxygen, O2. The concentration of oxygen in water can be affected by many physical and biological factors. Respiration by plants and animals reduces oxygen concentrations, while the photosynthetic activity of plants increases it. In photosynthesis, carbon is assimilated into the biosphere and oxygen is made available, as follows:

6 H2O + 6 CO2(g) + energy = C6H12O6 + 6O2(g)

The rate of assimilation of carbon in water depends on the type and quantity of plants within the water. Primary productivity is the measure of this rate of carbon assimilation. As the above equation indicates, the production of oxygen can be used to monitor the primary productivity of an aquatic ecosystem.

One method of measuring the production of oxygen is the light and dark bottle method. In this method, a sample of water is placed into two bottles. One bottle is stored in the dark and the other in a lighted area. Only respiration can occur in the bottle stored in the dark. The decrease in dissolved oxygen (DO) in the dark bottle over time is a measure of the rate of respiration. Both photosynthesis and respiration can occur in the bottle exposed to light, however. The difference between the amount of oxygen produced through photosynthesis and that consumed through aerobic respiration is the net productivity. The difference in dissolved oxygen over time between the bottles stored in the light and in the dark is a measure of the total amount of oxygen produced by photosynthesis. The total amount of oxygen produced is called the gross productivity.

The productivity of an upper tidepool at Race Rocks, as with many aquatic environments, varies seasonally throughout the year. Rain washes down nitrogen and phosphates into the tidepool and increases the productivity. In a lake or river, human activities, such as fertilization of fields and the operation of sewage treatment facilities, can alter the natural balance of nitrogen and phosphates in water. In this lab, you will first learn the technique of using the Oxygen Probe to measure the primary productivity of a seawater sample, and then you will proceed to devise an experiment to quantify net and gross productivity of microalgae from an upper shore tidepool when you have manipulated a specific factor that may affect photosynthesis.

The identification and taxonomy of these organisms can be assisted by the internet site maintained at the University of Montreal by Charles O’Kelly. You should observe them under the microscope and describe their movements. See the Pyramimonas Index–U. of Montreal


Green single celled flagellated algae species from the Race Rocks Tidepools

OBJECTIVES: In this experiment, you will 1. Use a dissolved oxygen probe to determine the level of dissolved oxygen in a sample of sea water.

 2. Measure the rate of respiration in a water sample.

 3. Measure the net and gross productivity in a water sample.

 4.Design an experiment to compare the rate of productivity under two different environmental conditions.

MATERIALS:

Macintosh computer shallow pan
Serial Box Interface nitrogen enrichment solution
Vernier Dissolved Oxygen Probe phosphate enrichment solution
Data Logger( software-built in) scissors
two 1-mL pipettes siphon tube
aluminum foil or black plastic bag thermometer
BOD bottles

PROCEDURE:

This first procedure will be a practice run so that you can understand how the equipment and data logger work.

1.    Obtain a BOD bottle.

2.    The dissolved oxygen probe requires a 10 minute period to polarize before it can be used. Be sure it has warmed up sufficiently before use.

3.    Prepare the computer for data collection by opening EXP23.LXP from the Biology with Computers experiment files. Load the calibration file EXP23.CLB.

4.    Fill the BOD bottle with a sea-water sample from the jar provided.

To fill a BOD bottle

  • Obtain a siphon tube.
  • Insert the tube into the sea-water sample and fill the tube completely with water.
  • Pinch the tube (or use a tube clamp) to close off the siphon tube.
  • Place one end of the tube in the bottom of BOD bottle. Keep the other end in the water sample, well below the surface. Position the bottle lower than the water sample and above a shallow pan.
  • Siphon the water into the test tube. Fill the test tube until it overflows .Fill the BOD bottle completely to the top of the rim. Use the shallow pan to collect any water that spills over.
  • Replace the stopper on the BOD bottle. Be sure no air is in the bottle

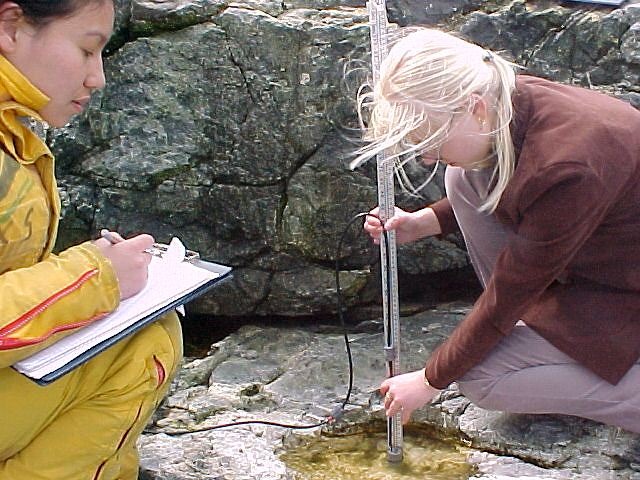
5.  Measure and record the temperature of the water sample .

6. Before using the Oxygen Probe, Calibrate it according to the special directions provided by the instructor.

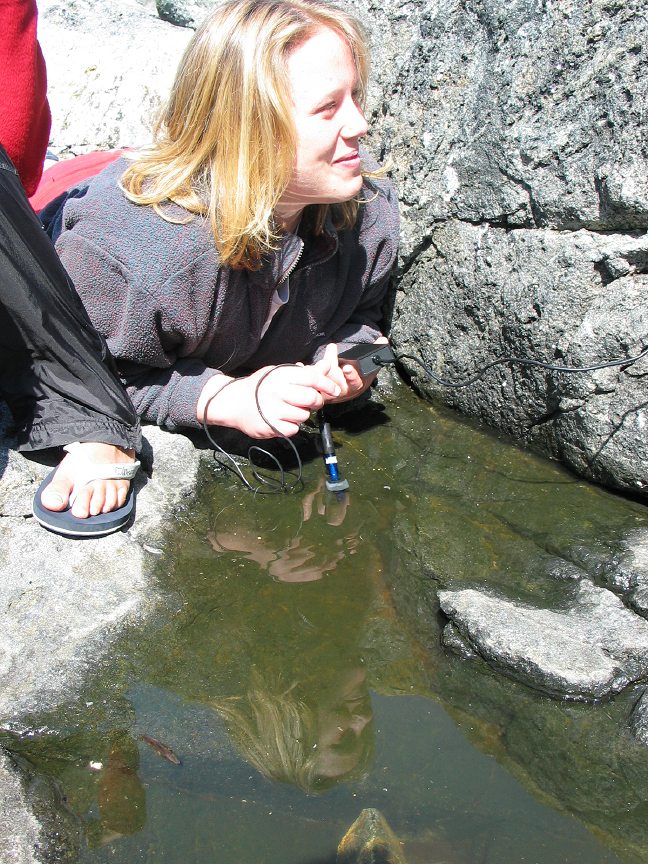
7. Remove the Dissolved Oxygen Probe from the storage bottle. Place the probe into the BOD bottles so that it is submerged half the depth of the water. Gently and continuously move the probe up and down a distance of about 1 cm in the tube. This allows water to move past the probe’s tip. Note: Do not agitate the water, or oxygen from the atmosphere will mix into the water and cause erroneous readings.

8. After 30 seconds, or when the dissolved oxygen reading stabilizes, record the DO reading .

9. Now you are ready to design an experiment to test some variable that affects productivity.

Processing the DATA

1.    Determine the respiration rate. To do this, subtract the DO in BOD Bottle 1(the initial DO value) from that of BOD bottle 2 (the dark bottle’s DO value).

2.    Determine the gross productivity in the BOD bottle. To do this, subtract the DO in the light bottle’s DO value from that of the dark test tube’s DO value.

3.    Determine the net productivity in each BOD bottle. To do this, subtract the DO in the light bottle’s DO value from that of the initial DO value .

THE PLAN FOR AN INVESTIGATION

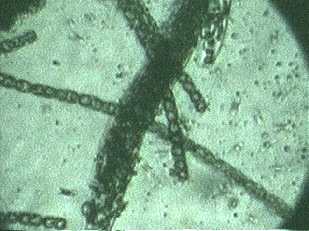
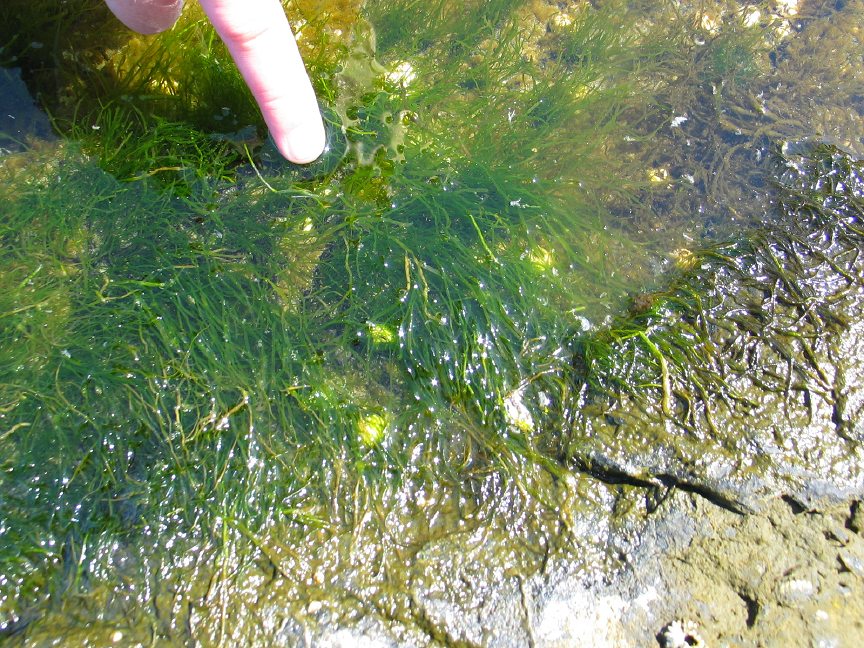
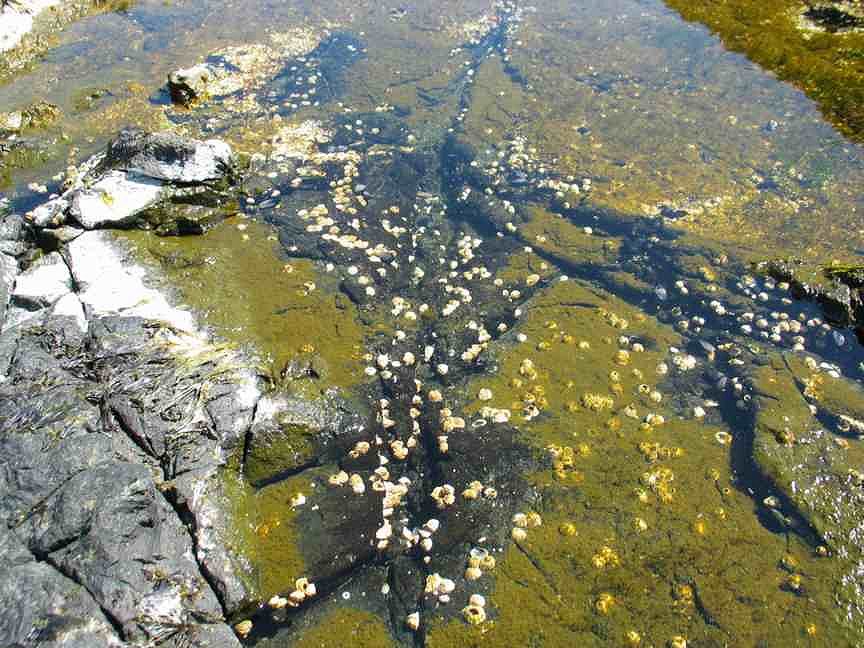
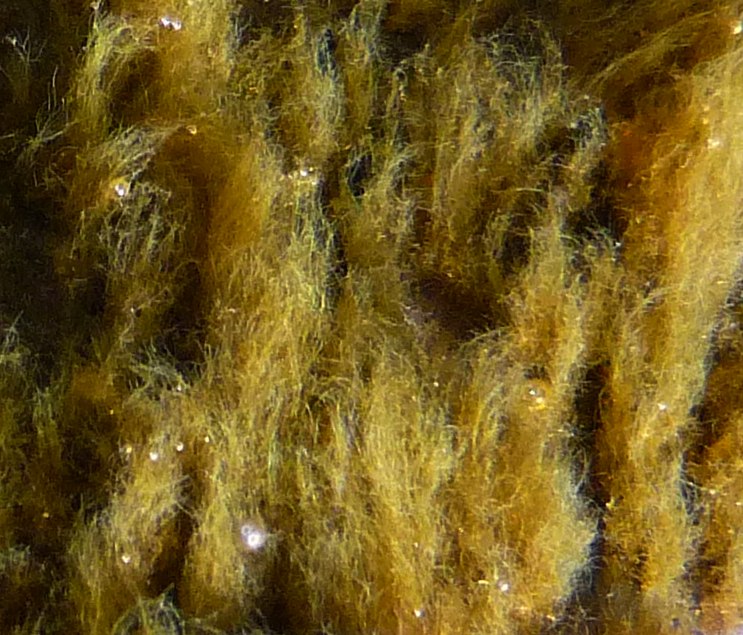
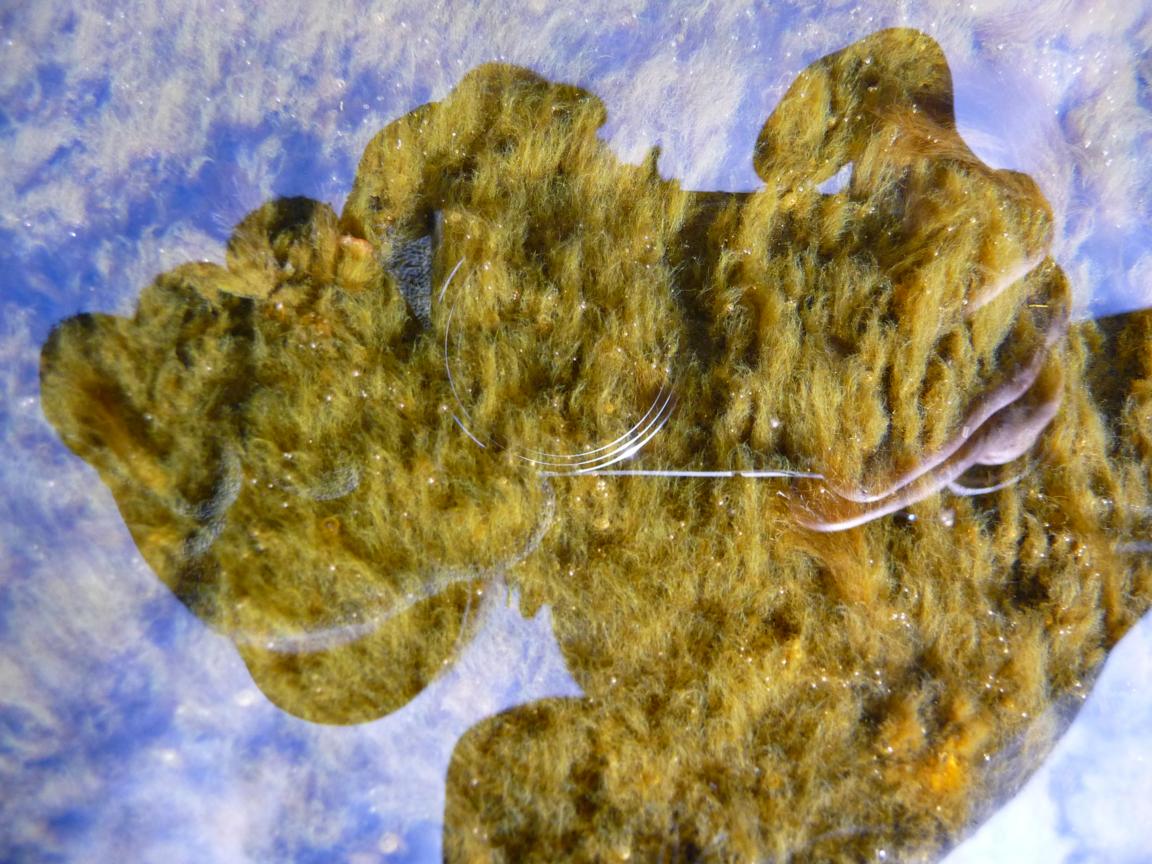
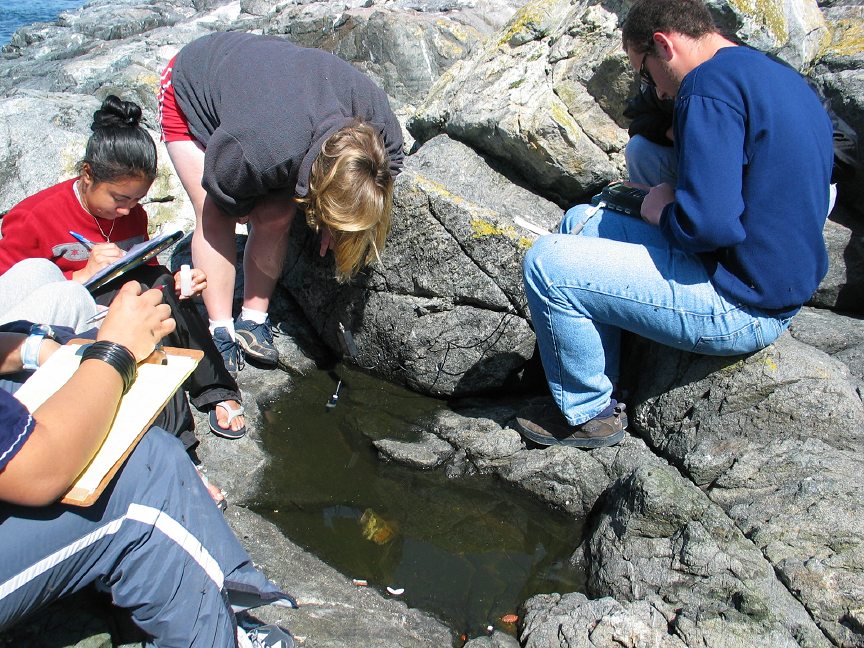
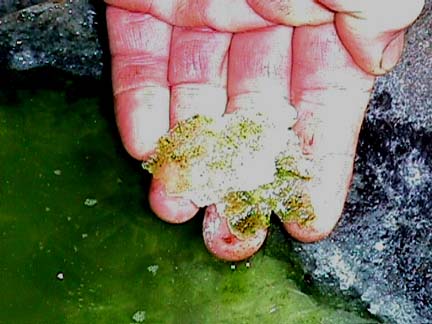
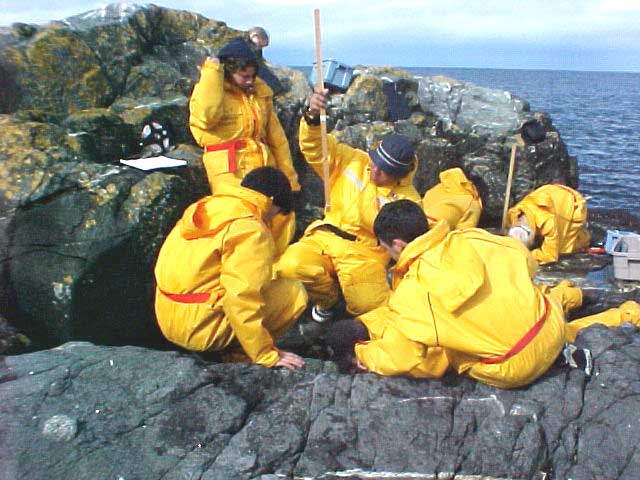
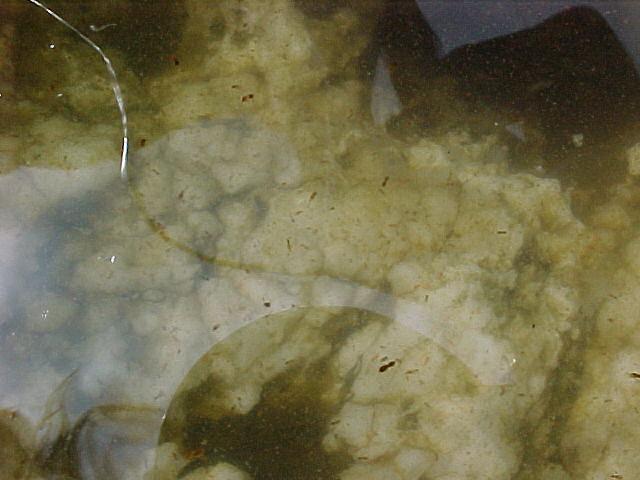
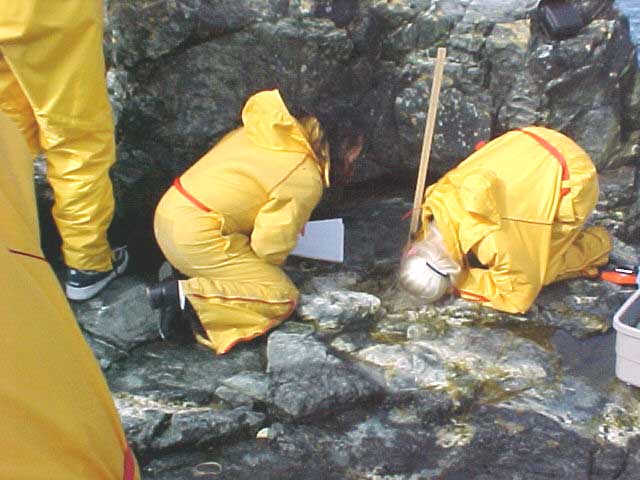
Now that you understand the basics of recording Oxygen levels with an Oxygen Probe, I expect you to come up with an appropriate controlled experiment for the green algal water from the high tidepools at Race Rocks. You will have two periods to plan what you want to do and to carry out the investigation. You will probably need some extra time as well since the minimum time for Oxygen generation is about an hour.

Develop some hypotheses that you can then proceed to test using the technique.

You must provide a written proposal for approval before starting the actual experiment. Be sure to have this checked and initialled by the teacher before proceeding with the investigation.

Some broad hints and way-out ideas to consider:

1. There may be a connection between primary productivity and pH in a pond. See the video on the use of green ponds to provide sewage treatment.

2. Bottles of green algae hung at different levels in the ocean may provide different levels of productivity.( Or you may simulate this by different light intensities in the lab.

3.Turbidity or nutrient level may effect productivity.

4. Note the collection date of the green water sample on the storage jar: Fresh samples may differ in photosynthetic or respiration rates.

5. We have inorganic fertilizer available in the lab.

6. How much does temperature affect productivity and respiration?

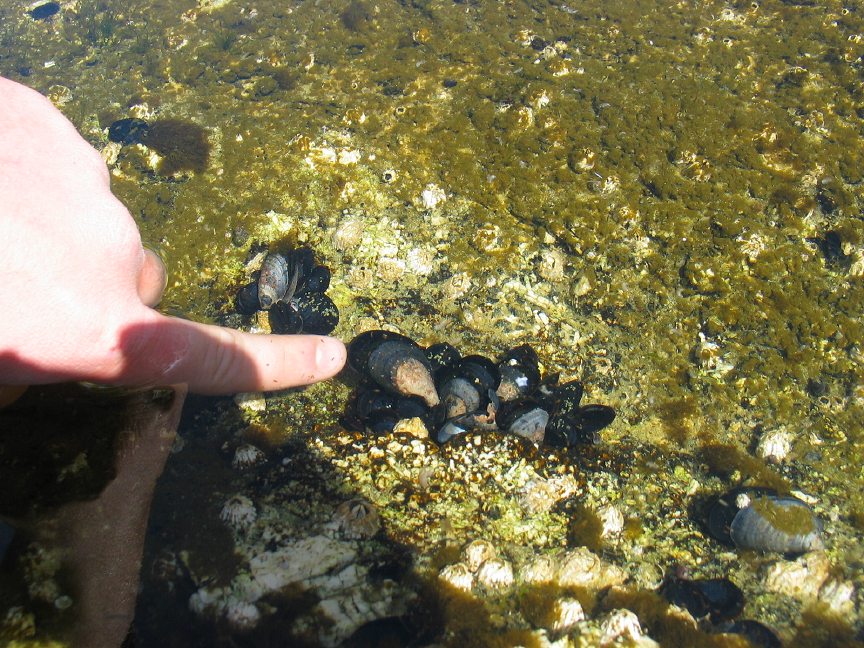
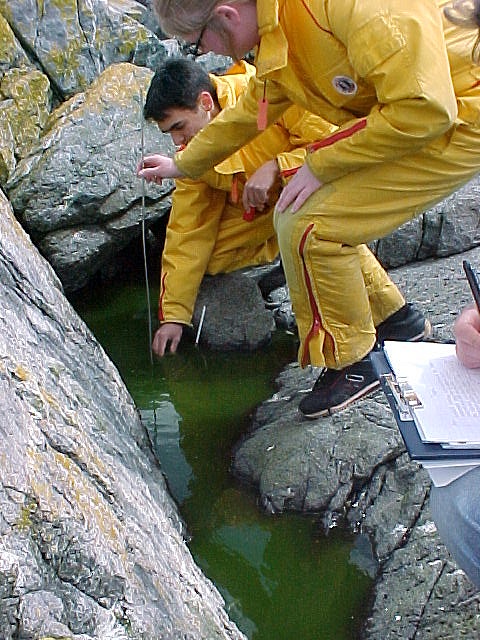
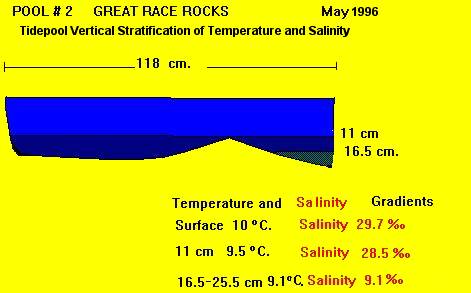
7. From our preliminary measurements of the tidepools, we noticed that high salinity and low salinity were measured in pools that were clear or non-green on the upper intertidal.

8. The pools these samples come from are subjected to heavy rainfall at some times and salt water spray and even submersion at others. I wonder if the organisms and their ability to photosynthesize is affected? – right away— a half- hour later ??

9. If you are going to take a sample, be sure it has been covered with the dark bag for several hours before sampling, as it does not take very much time to saturate the water with oxygen.

10. Be creative: think of all the implications of photosynthesis and take advantage of this opportunity to do a controlled experiment on a specific variable.

11. If you have a good reason to re-sample from the pools, we may even be able to arrange it!

FOR FURTHER REFERENCE:

Tide Pool Abiotic factors

In the high intertidal areas of Race Rocks, there are tidepools with wide fluctuations of abiotic factors. The organisms inhabiting these pools are well adapted to these extremes. Garry talks to a biology class about some of the variables influencing these high tide pools, and the flagellated green algae living within them.

Tidepool #2 at Race Rocks

This file has been started to present some of the information we have accumulated on the pool in order to stimulate students to raise further questions and devise problems that can be investigated at the pool. It is also intended to be part of a cumulative digital legacy that those examining the pool can pass on to future students. A characteristic of the pool that is significant is that it is deeper than most of the other pools and it provides good variations in stratification of temperature and salinity.

Some ideas to consider:
The stratification of Salinity and Temperature in this pool is quite distinct. More work could be done in gathering seasonal records of this. Also, the main organisms, harpacticoids are abundant in the late spring and summer. It may be interesting to identify their source of food, probably diatoms that form a thin layer on the walls. Since the pool only receives new salt water occasionally, temperatures can fluctuate. The pool is however usually shaded by the rock cliff to the South.

Tidepool # 1 – Near Peg 6

This file has been started to present some of the information we have accumulated on the pool in order to stimulate students to raise further questions and devise problems that can be investigated at the pool. It is also intended to be part of a cumulative digital legacy that those examining the pool can pass on to future students.

This pool is located beside Peg #6 and is one of the highest elevated tidepools of the set.

Tidepool Index

USE THIS INDEX INSTEAD

These pools are located 0n the West side of Great Race Rocks. They are located at slightly different elevations resulting in different abiotic factors in the pools and different life forms in the pools as well. Our students brave the elements to get some measurements in this video

Tidepool 1
Tidepool 2
Tidepool 3
Tidepool 4
Tidepool 5
Tidepool 6
Tidepool 7
Tidepool 8
Tidepool 9
not available
Tidepool 10
Tidepool 11  not available
Tidepool 12
Peg 5:
Tidepool 13
artificial

Tigriopus californicus: Harpacticoid–The Race Rocks Taxonomy

We frequently find abundant populations of Harpacticoids in the high tidepools number 10, 7 and 2 at Race Rocks

Populations can fluctuate widely through the seasons.. Since pool 7 is at the highest elevation, it may not receive new inputs of seawater unless there is a wind from the West. In the summer, with no rain, and with elevated temperatures, this shallow pool will develop salt crystals. At that time, the only population of Tigriopus californicus is in pool 2 which is deeper and shaded, and in pool 10 which is small but shaded. Later on, in October, pool 7 may have an abundant population concentrated along the vertical walls of the pool. In this photo, The photo above was taken on a compound microscope at 10 power, but it has been enlarged considerably by photomicrography

In this photo Gerald has scooped up a sample from pool 10,where they are visible to the naked eye as small moving reddish dots.


Research done on this organism by the student T.C. Merchant at the Hopkins Marine Station of Stanford University in 1977, refers to this unique osmoregulatory adaptation for this Euryhaline environment.

“Abstract: Tigriopus californicus exhibit a unique osmoregulatory behavior which is highly adaptive in the high splash pool habitat. They conform osmotically in intermediate salinities and regulate hypo and hyper osmotically in high and low salinities respectively. Gut fluid appears to remain isosmotic with the environment. Evidence is presented to suggest the gut may be a regulatory surface in Tigriopus. The range of osmoconformance depends on the length of acclimation to a given salinity. O2 consumption in Tigriopus is high in low salinities decreasing as salinity rises. Metabolism appears not to change significantly over the conforming range 35 to 60 0/00″

Other interesting research on this organism has been on its Phylogeny. Research done in southern latitudes on Tigriopus revealed one of the highest levels of mitochondrial DNA differentiation ever reported among conspecific populations. S.Edmands ( Molecular Ecology,Volume 10 Page 1743  – July 2001) showed that populations from Puget Sound northward had significantly reduced levels of within-population variation based on cytochrome oxidase I sequences. These patterns are hypothesized to result from the contraction and expansion of populations driven by recent ice ages.

The Pesticide Action Network North America.lists extensive results of toxicity studies with Pesticides using Tigriopus californicus.

Dr. Maarten Voordouw working with Dr.Brad Anholt of the University of Victoria has researched the evolution of Sex ratios in Tigriopus californicus. He found there to be a variation in offspring sex ratio larger than the binomial expectation, and that females produce male-biased clutches at higher temperatures. The trait is heritable and is transmitted primarily through the paternal line. http://web.uvic.ca/~banholt/anhlabsite/tigs.html

Other Members of the Phylum Arthropoda at Race Rocks.

taxonomyiconReturn to the Race Rocks Taxonomy
and Image File
pearsonlogo2_f2The Race Rocks taxonomy is a collaborative venture originally started with the Biology and Environmental Systems students of Lester Pearson College UWC. It now also has contributions added by Faculty, Staff, Volunteers and Observers on the remote control webcams.   G.Fletcher


Tidepool # 10 at Race Rocks

In May 2004 the biology class measured features of several pools, including this one, pool 10.

This file has been started to present some of the information we have accumulated on the pool in order to stimulate students to raise further questions and devise problems that can be investigated at the pool. It is also intended to be part of a cumulative digital legacy that those examining the pool can pass on to future students.

This pool has a diameter of less than half a meter .This pool is characterized by having a base of white crystalline quartz. It is also shaded for much of the day, and is usually filled with harpacticoids.

white quartz with harpactacoids visible

SEE THIS REFERENCE in the Race Rocks Taxonomy on Harpacticoids

A large amphipod and the small red harpacticoids in pool 10

Surge Channel and Surge as an Abiotic factor

On a field trip to Race Rocks with the Biology class in the spring 2003, we took some time to observe and video the surge channel out on the south-west tip of Great Race Rock. It was a calm day which had been preceded by a few days with storms out in the Pacific Ocean. The energy imparted to the water column was just now reaching Great Race and the water was breaking on the west shore. The effect of “Surge” as an abiotic factor is not often considered in affecting the intertidal zonation of organisms on rocky coastlines in marine biological research. See this file on this abiotic factor.


It is our firm belief that here, the level up the shoreline in the intertidal zone where many invertebrates and algae can survive is elevated. These intertidal organisms are able to keep moistened longer, ambient temperatures are depressed from evaporation and and they even have longer availability to food resources being carried in the surging water. This is most obvious with the Goose Neck barnacle population and the intertidal anemone distribution along this shore. Additionally the tidepools up the channel are flooded more frequently, resulting in lower temperatures and more stabilized salinity conditions. It should be emphasized that this is not directly “wind-driven” water movement. As one can see in the video, the surrounding sea is calm, with little wind that day.

Tidepool Studies at Race Rocks Pool #4 Peg6

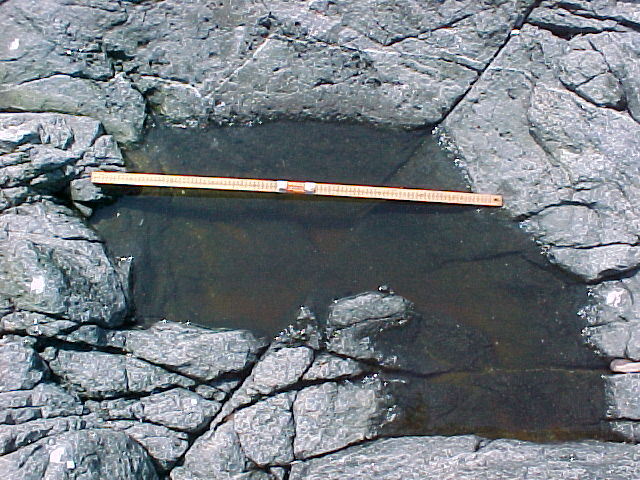
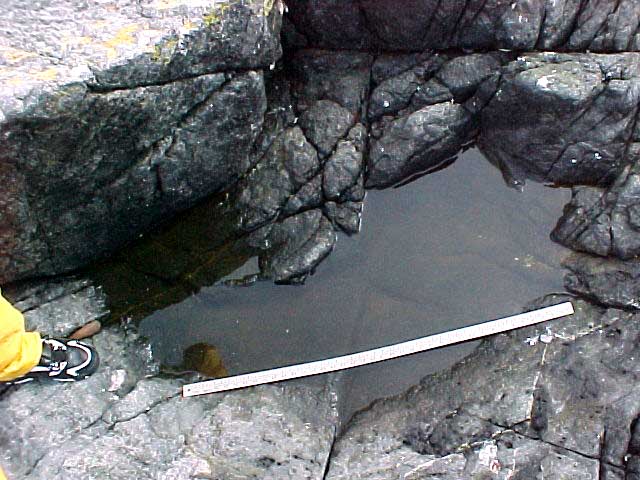
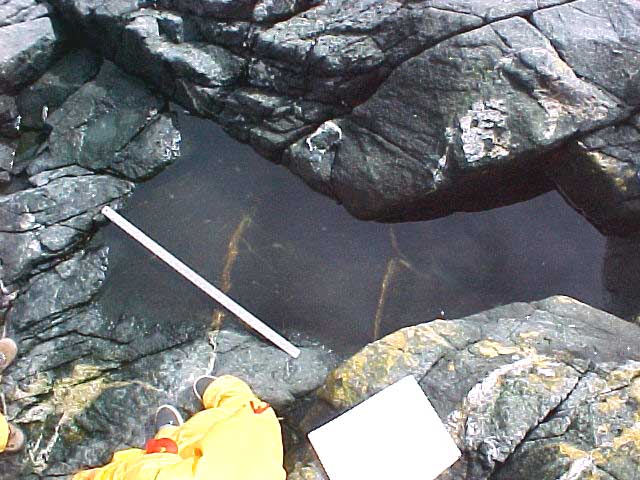
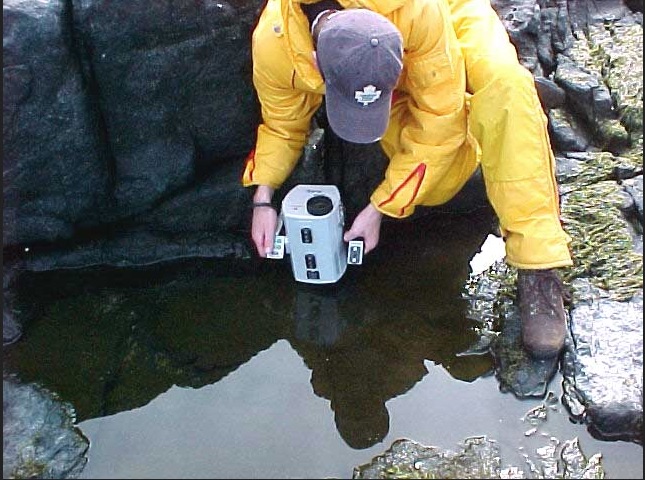
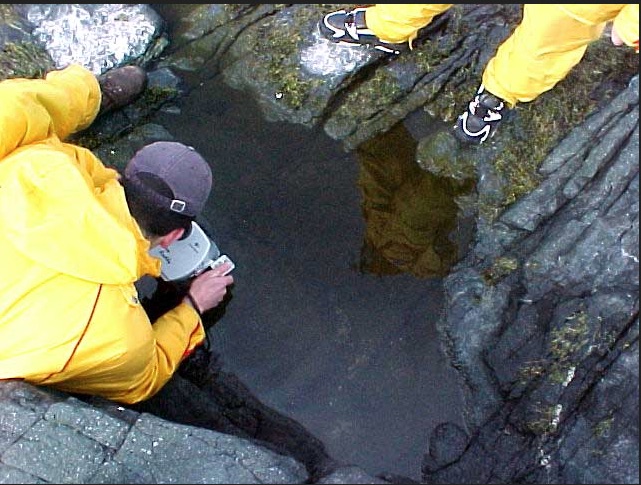
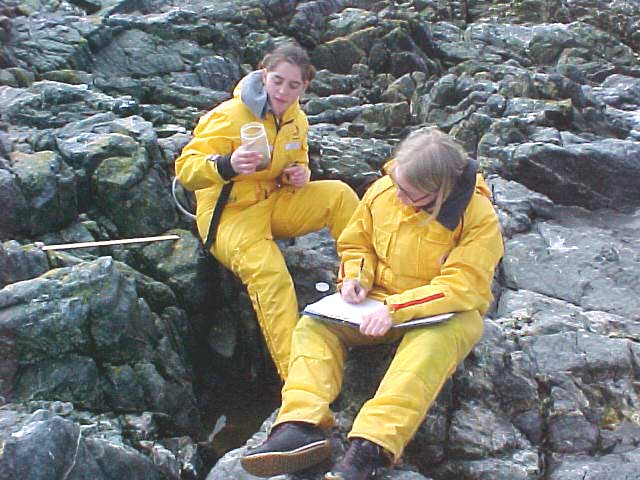
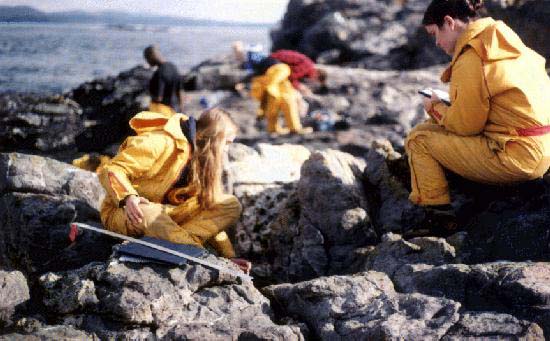
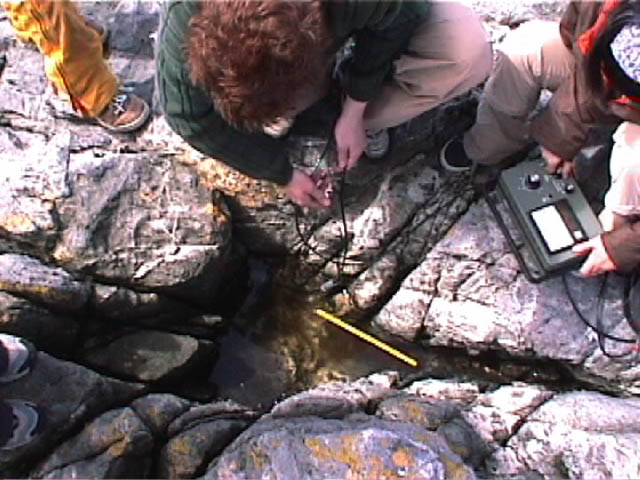
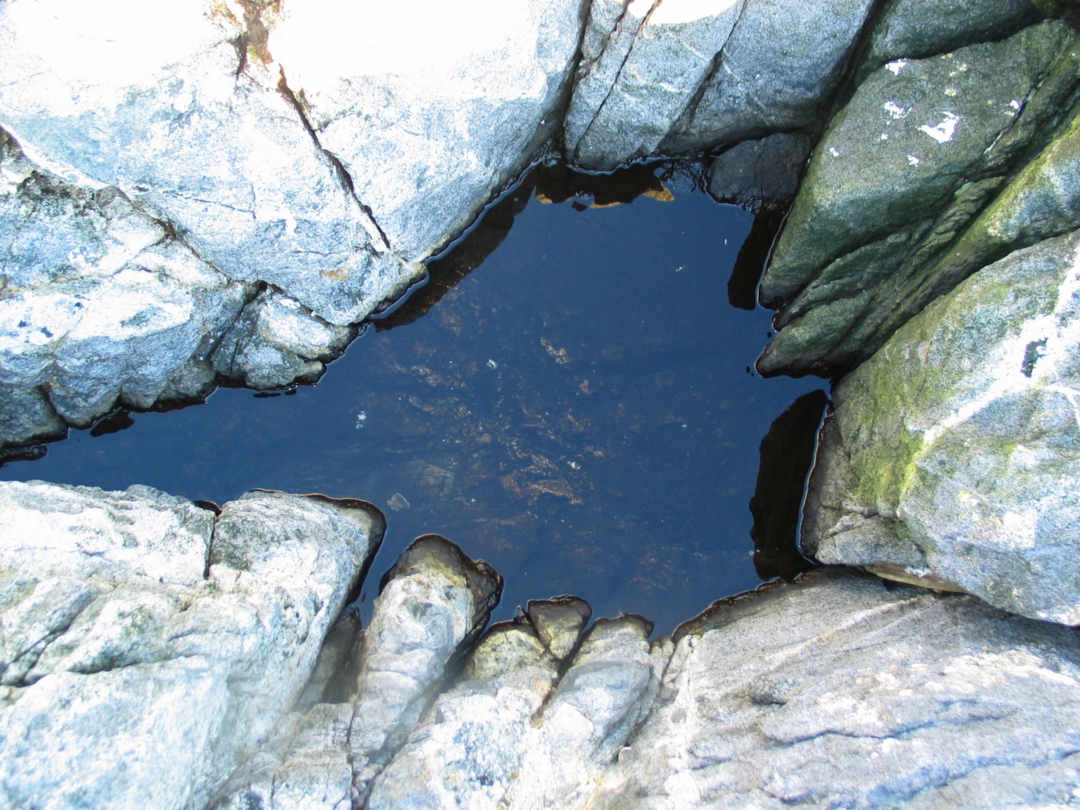
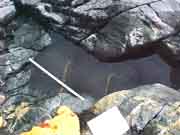
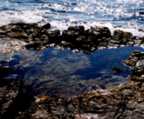
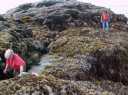
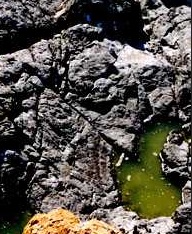
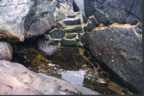
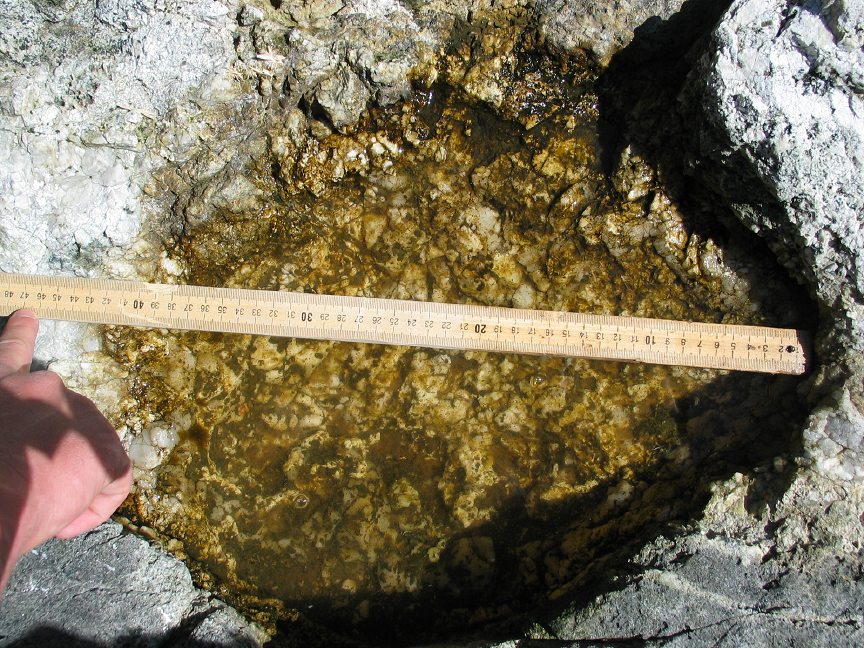
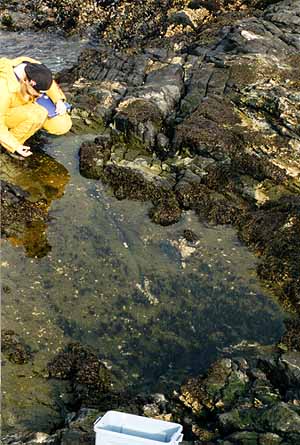
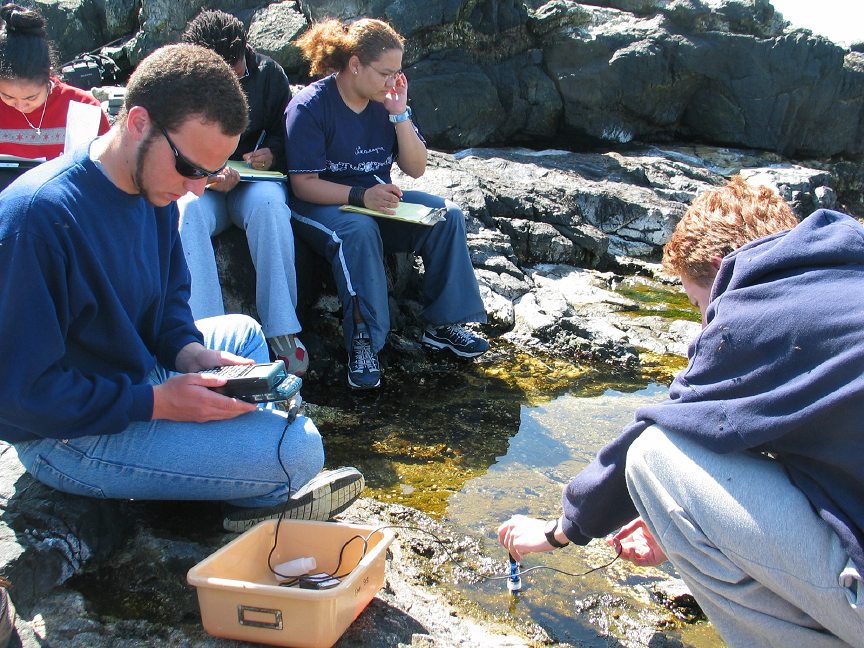
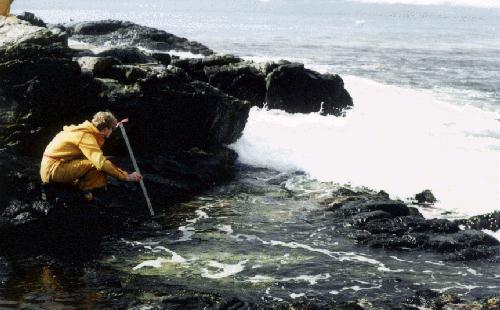
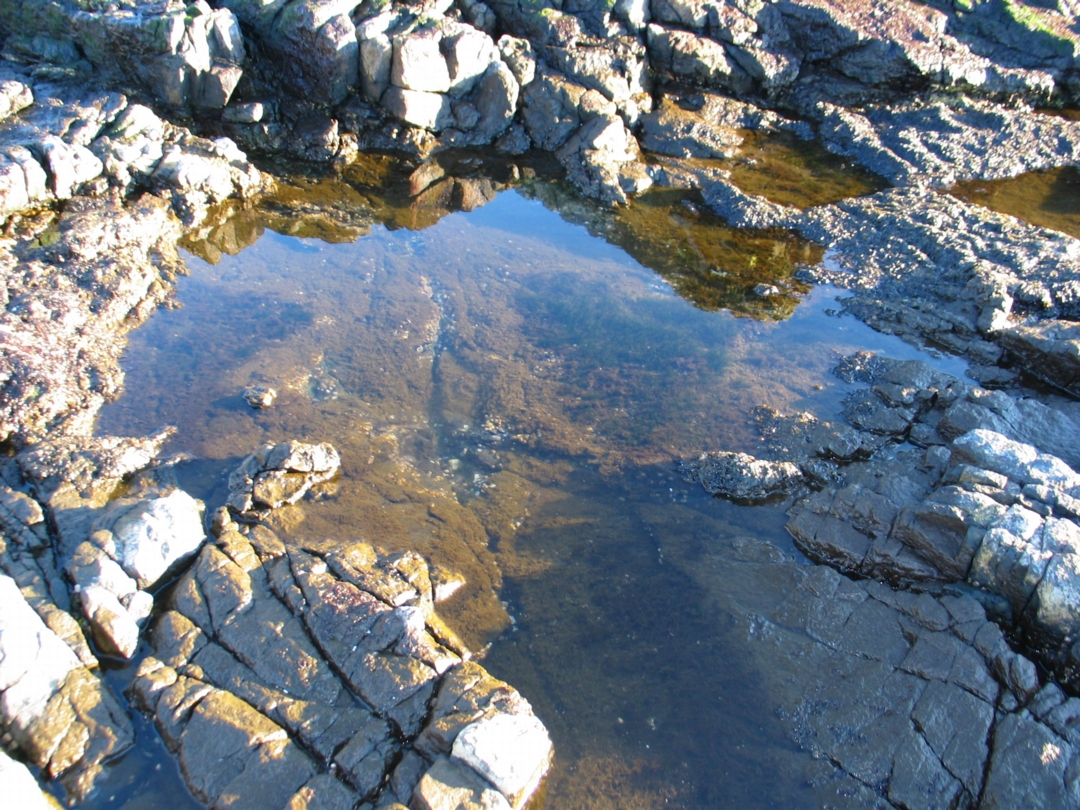
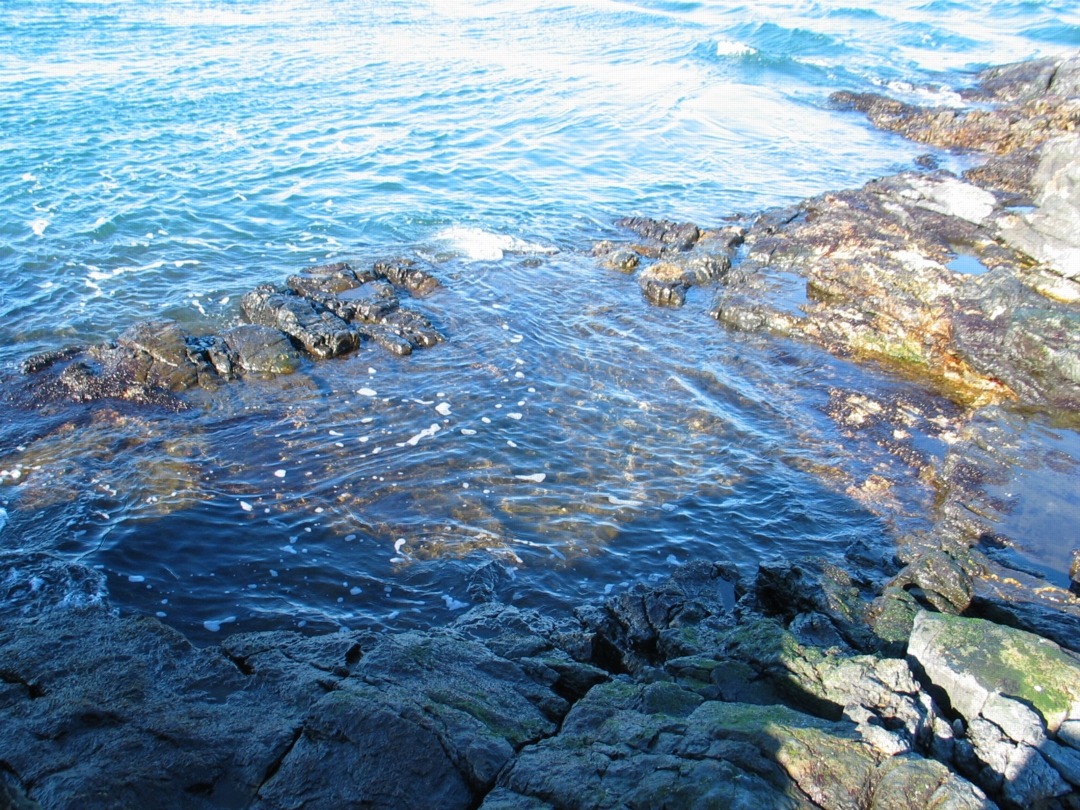
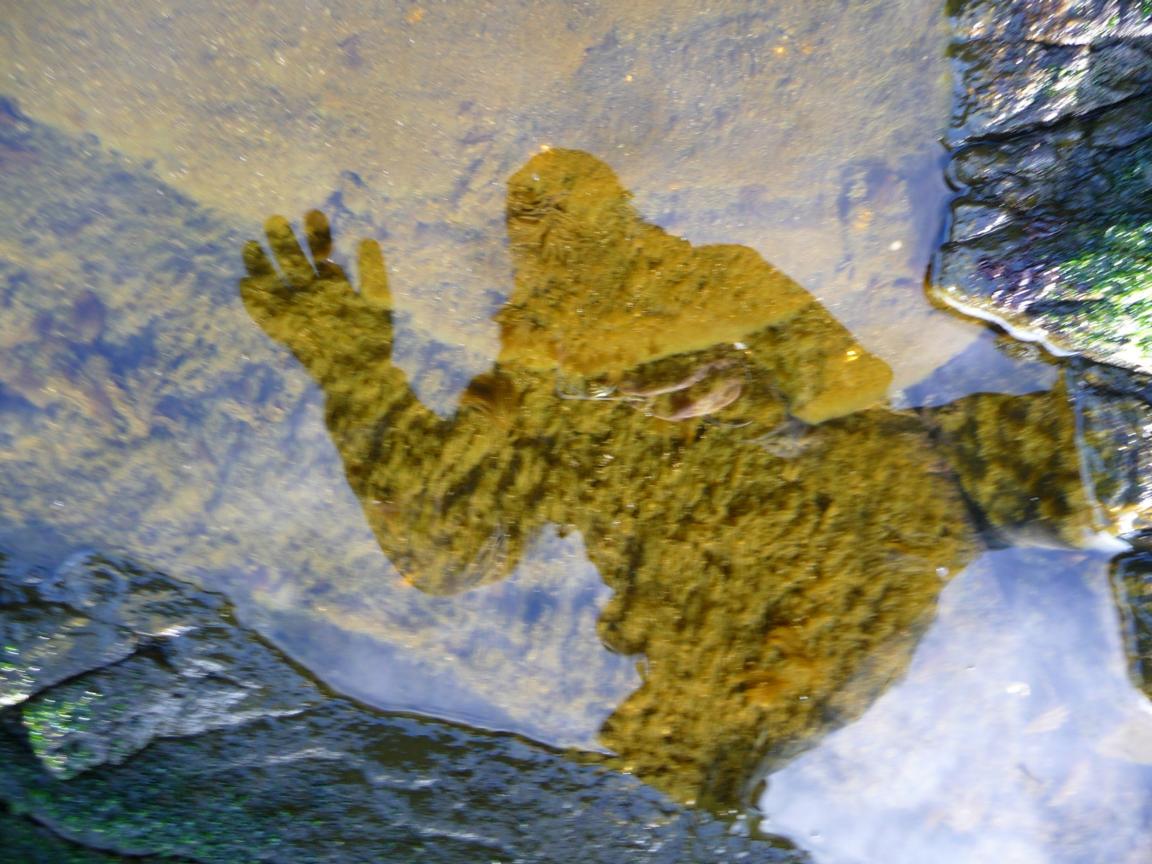
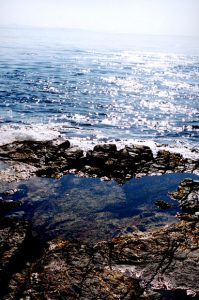
A general view of the pool.It is perched on a shelf which easily gets flooded when there is a slight swell in the ocean. Polymorphism in the Snails of Pool # 4, Extended essay in Environmental Systems,
A student examines the life of pool 4 Amphipods collected with a suction bottle from pool#4.
A microscopic picture of the diatoms that grow as a fuzz in the pool in the early spring. They remain a few months until they are grazed off.
Roberto and the Biology Class measure salinity in pool 4.. May 2004
Enteromorpha growing in the pool. May 2004. Bay mussels, Mytilus trossulus in the brackish water of Pool#4
In May 2004,it is clear where the grazers, Littorina snails and amphipods) have trimmed off the diatoms on the bottom. Arunas measures the depth of pool 4 while watching for swells
In February, 2007, the diatoms cover almost the entire bottom of the pool. This is the winter pattern. Grazing as shown above gradually removes the covering of diatoms.


January, 2007. The tide is at its peak today, showing pool 4 being entirely submerged.
On February 11, 2008 a beast is photographed in the tidepool. Close up of the Filamentous golden algae filling the tidepools in early spring.
Weird form shades a covering of diatom fuzz!


Some ideas to consider:

Invitations to Inquiry:

This pool is unique in a number of ways. The white substrate in the bottom of the pool is the result of a quartz intrusion that has flooded while molten, through the cracks of the basalt.
What is the effect of this white reflective surface on the temperature of the pool and the organisms that live in the pool?

In 1997 while doing a detailed analysis of the organisms in the pool, we noticed for the first time that there were white periwinkles. At that time 26 were counted by Nadia and Catherine. Speculate on the evolutionary implications here.

The mussels in pool #4 are Mytilus trossulus, the bay mussel. Mussels that you can see on the surrounding intertidal areas are the Mytilus californianis. Why the species difference?

The pattern of diatom distribution changes in the bottom of the pool. In the winter, it covers the pool with a thick felt-like appearance, as spring approaches, the cover of diatoms starts to disappear, starting along the cracks where the mussels are anchored.. could one measure the rate of grazing from the amphipods in the cracks?

Temperature and Salinity in the pool fluctuate widely and at times form stratified layers. How does this affect organism distribution.?

The biotic and abiotic features of this pool vary considerably from other pools in the near vicinity. Quantify and explain the differences or similarities.

The only other pool that resembles this one is found over on the north-east corner of the island, at location peg15-pool #14. Compare the biotic and abiotic factors of these two pools, and explain the differences.

The following lab on tidepool abiotic factor measurement was done by Chiara Ravetti in September,2005.
Biology Laboratory

Analysis of the Abiotic Factors in Race Rocks Tidepools

The measurements of salinity, ph, and temperatures of different tidepools at Race Rocks was done September19, after 11.30 a.m., with high tide. For this reason the pools selected were only five, two (pool 7 and 8) several meters away from the sea at that time of the day, the other three (pool 1, 2 and 4) closer to the water and larger.
Data analysis and further note

pool 1 pool 2 pool 4 pool 7 pool 8 Ocean water
Salinity 62.1 32.8 21.9 45.3 45 30
Temperature 14.4 C 14.4 14.2 15.4 15.2 10
ph 8 6.8 6.9 7 8


The measurement of salinity is expressed in parts per thousand; the instrument utilizes electricity, that passing through salt ions determines its quantity.
The pools were contaminated by sealions excrement, which reduced the visibility inside the pool and probably altered the pH of the water.
Other factors which might affect these values in a tidepool are: evaporation, precipitation, and in general pollution, scarce precipitation at that time of the year, the presence of the estuary, (The Strait of Juan de Fuca) with the influence of fresh water. The salinity in a tidepool is higher than the sea, for the evaporation and the little exchange of water, therefore the organisms living in it must tolerate high salinity, as well as variations in temperature. The smaller tidepools further from the sea present even more significant changes.


Tidepool # 3 at Race Rocks

This file has been started to present some of the information we have acumulated on the pool in order to stimulate students to raise further questions and devise problems that can be investigated at the pool. It is also intended to be part of a cumulative digital legacy that those examining the pool can pass on to future students.

Some ideas to consider:

  • This pool is very shallow and has a very low biodiversity. Diatoms, amphipods and a few barnacles live here. Since it is only a few centimeters higher up the shore than pool 4, note how elevation makes a significant impact on the abiotic factors of Temperature and salinity.