At Race Rocks we have a tidal range of about 3 metres.
For tidal Level predictions , from the closest station at Pedder Bay see this link
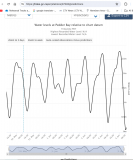 https://tides.gc.ca/en/stations/07080/predictions
The link below is for the Race Passage Current tables. .. See this file for the result of original work done by Pearson College Divers assisting the Institute of Ocean Sciences in the deployment of the current meter to gather a year’s worth of data from which these tables are constructed.
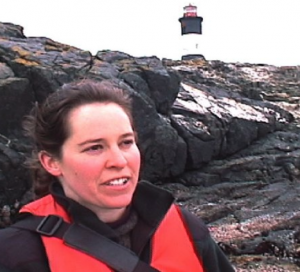 Marine Science teacher at Pearson College Laura Verhegge was interviewed on CBC radio about what was a “Negative tide”. Listen below.
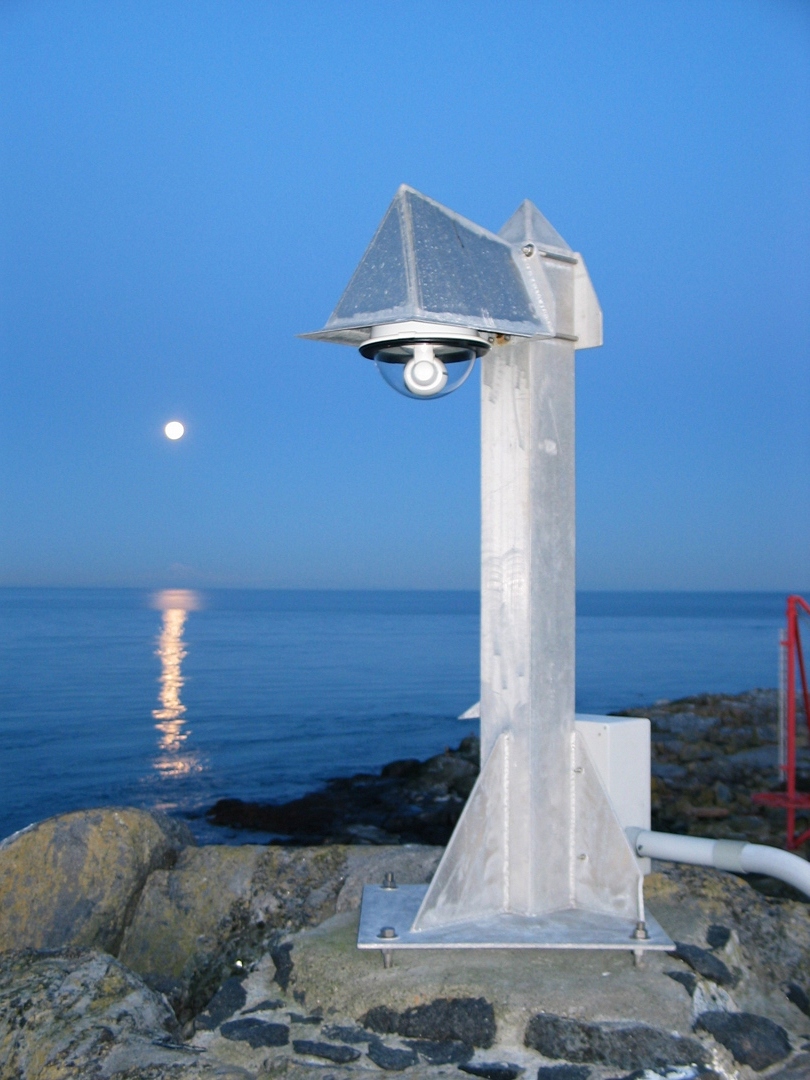
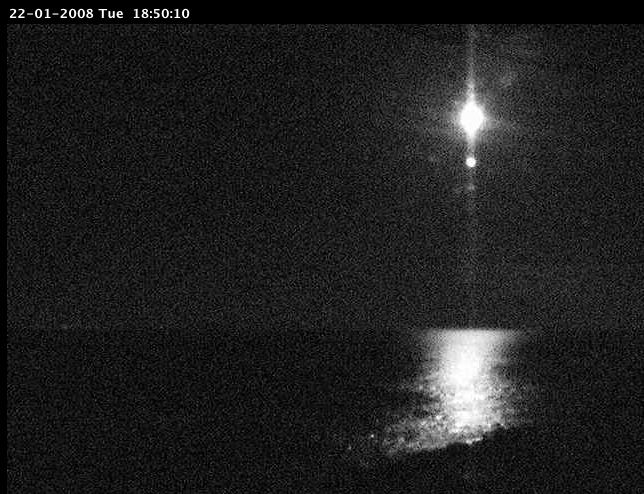
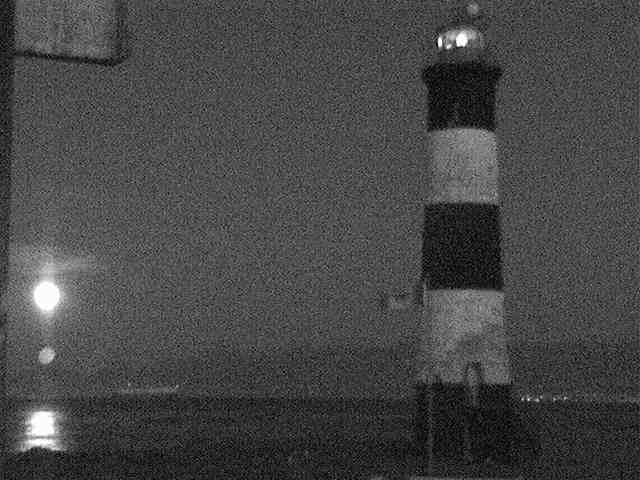
The role of the moon is a major factor in determining the rise and fall of the tides.The view of it from Race Rocks in a full sky is often stunning.

-
-
photo of camera 5 and the moonrise -G.Fletcher photo
-
-
Pam Boirley took these shots from her home in England using camera 5
-
-
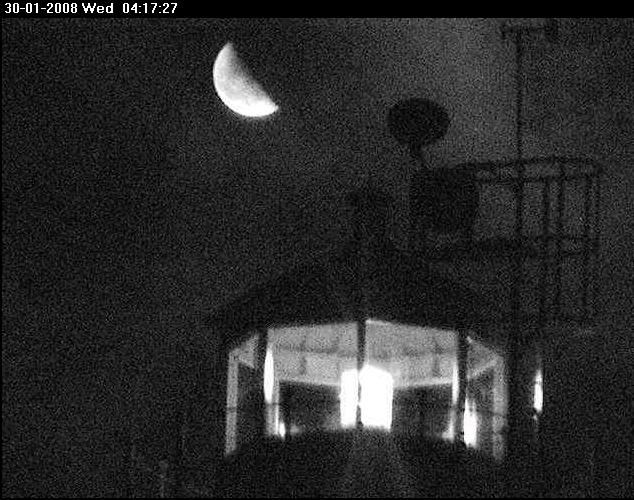

And of course the other component causing tides is the sun. See this file for Solar energy records for Race Rocks .
 See this file for the Abiotic Effect of Solar energy on Organisms at Race Rocks
THE ABIOTIC EFFECTS OF TIDAL LEVEL CHANGES:
The rich variety of life in the intertidal zones of Race Rocks provide habitat for many animals which have adapted to living part of their life exposed . “ANITA’S ISLAND” on the West side of Great Race Rocks provides an excellent example, in the month of June when the tidal level often drops below zero datum so one can really appreciate the effects of the daily changing tidal levels on intertidal life. This island is actually a peninsula which you can walk out onto when the tides drop to -0.0m, but is totally submerged at high tide, (around 2.6 meters). You can often see the top of it from remote camera1 ( It looks black because it is covered with mussels.)
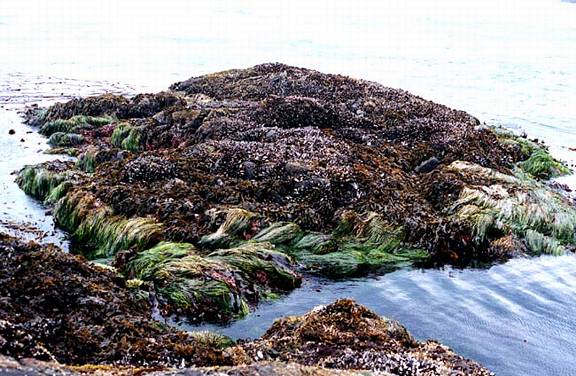 For several years in the 1990s we did research with Dr. Anita Brinckmann-Voss on these low tides in June. We only had a half hour or so until the isthmus joining the island to Great Race Island was flooded however. Each year that we went out, Anita found a great many of the hydroid samples from which she identified for the Ecological Reserve.
-
-
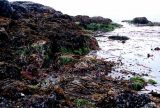
The intertidal zone on the West side of Great Race Rocks as viewed and photographed on June 12, 1999 at a minus 0.1 tide. The predominant macroalgae is Hedophylum sp. although immature bull kelp (Nereocystis luetkeana) is also anchored in this zone close to the shore
-
-
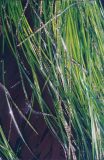
Small pink dots of a Melobesia mediocris, a calcareous pink encrusting algae which grows as an epiphyte on the leaves of surf grass
-

-
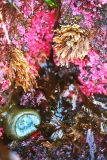
Just below the green fringe of surf grass, Phyllospadix scouleri, pink hydrocorals and other hydroids such as this Abietinaria amphora survive the current and wave swept zone.
-
-
The hydroid Aglaophemia latirostris with an Intertidal Anemone
-
-
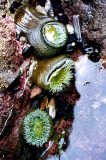
Other Cnidarians such as the green anemone, Anthopleura xanthogrammica, are found in the low intertidal area. These large anemone with symbiotic algae are also found in the surge channel on the south-west corner. The knife placed in the picture for scale measures 10cm in length.
-
-
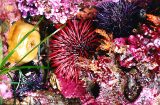
Giant red urchins Strongylocentrotus franciscanis live here at the upper limits of their range and the purple urchin, Strongylocentrotus purpuratus also inhabits a narrow band in this area.
-

-
A giant barnacle, Balanus nubilus plays host to a colony of Symplectoscyphus turgidus ( formerly Sertularella turgida) . Hydrocoral, (Allopora sp. ) encrusts much of the substrate
-
-
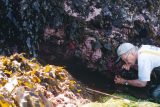
Two of the small caves at this level yield a variety of invertebrates. The ceilings of these caves usually support a variety of hydroids
-
-
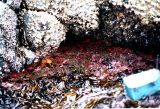
The floor of this cave on the south-west corner is covered with the red encrusting sponge, Ophlitaspongia
-
-
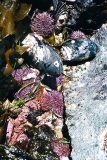
Here on the small island, the purple urchins reside in a crevasse next to the mussle Mytilus californianus.
THE INTERTIDAL ZONE: The island is totally covered on every square centimeter with some form of life, either invertebrate or plant.
-
- Those organisms nearer the top or in the high intertidal area, are more resistant to changing temperatures, and changing salinity. Exposure in a rain storm means they have to tolerate fresh water, and changing salinity. On a hot sunny day , the surface temperatures can elevate quickly.
- Other hazards of this habitat between sea and land create an extreme environment for survival. Predation from Birds and other animals is possible when exposed at low tide , wheres the same organisms are exposed to predation from fish and predatory invertebrates such as sea stars when the tide is in.
- This zone also makes the organism vulnerable to pounding waves and surf, so built in resilience is necessary to hold on and remain attached , and not be crushed by the force of the water.
- Living in this zone also leaves an organism exposed to wind driven foreign objects.. At Race Rocks drifting logs are often present on the surface and these can exert a powerful force when striking a shoreline,
|
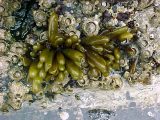 RESEARCH ESSAYS: The implications for an organism living at different elevations on the intertidal zone are very significant. Over the years several students have done research in the intertidal zone at Race Rocks and have examined how different organisms have adapted. Check this file for examples RESEARCH ESSAYS: The implications for an organism living at different elevations on the intertidal zone are very significant. Over the years several students have done research in the intertidal zone at Race Rocks and have examined how different organisms have adapted. Check this file for examples |
 TIDEPOOLS: In our tidepool file , you will find an index with links to a set of tidepools where we have recorded the effects of the tide being out for different lengths of time. The abiotic conditions in the pools change significantly as the tide levels go up and down. Salinity and Temperature are especially variable and they influence the type of organisms that lives within the pools. TIDEPOOLS: In our tidepool file , you will find an index with links to a set of tidepools where we have recorded the effects of the tide being out for different lengths of time. The abiotic conditions in the pools change significantly as the tide levels go up and down. Salinity and Temperature are especially variable and they influence the type of organisms that lives within the pools. |
 Intertidal TRANSECT Studies.We use transects to quantify the interrelations of organisms as they are distributed throughout the intertidal zone on the shore. Tidal levels are a major factor in determining this zonation. In this file you are invited to examine some of our data, and create your own transect baseline studies as well. They may have nothing to do with tides, but they can serve as an excellent record which you may use to base measurements showing change or stability of the ecosystem in the future Intertidal TRANSECT Studies.We use transects to quantify the interrelations of organisms as they are distributed throughout the intertidal zone on the shore. Tidal levels are a major factor in determining this zonation. In this file you are invited to examine some of our data, and create your own transect baseline studies as well. They may have nothing to do with tides, but they can serve as an excellent record which you may use to base measurements showing change or stability of the ecosystem in the future |
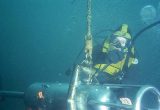 The Effects of CURRENTS. The Effects of CURRENTS.
Tidal Currents are also a result of the tidal cycle . This file documents aspects of the currents at Race Rocks |
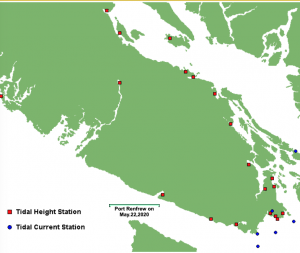 Other tidal heights from along the coast of Vancouver Island and British Columbia
An interesting exercise is to compare the tidal heights at several locations around Vancouver Island. There is a significant difference, with times as well as tidal ranges varying depending where the station is located. There are many factors which determine tide levels, the most obvious being the stages of the moon and the position of the sun, but here you can see that geography has a major role to play as well. |


