Category Archives: Education
The Diving Service Schools Project 1999
 Link to our 1997-98 season of the Diving Service Schools Project.
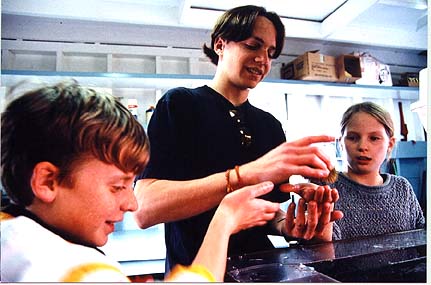
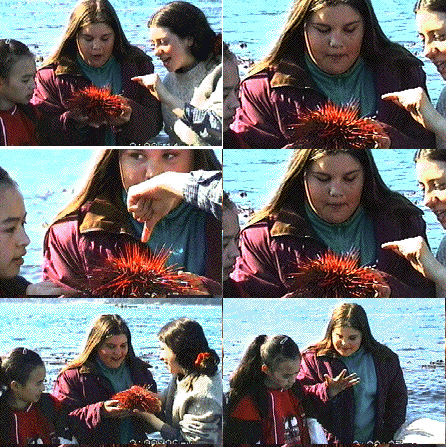
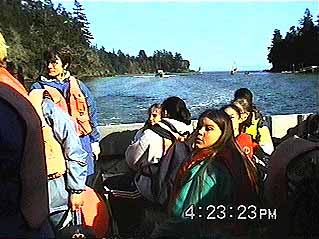
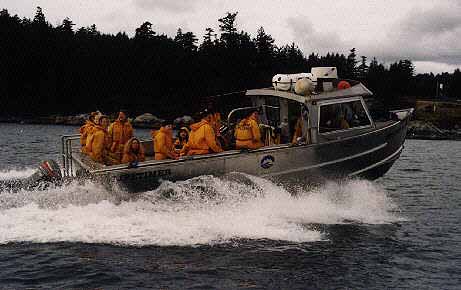
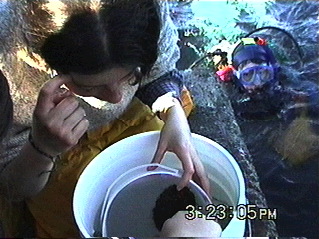
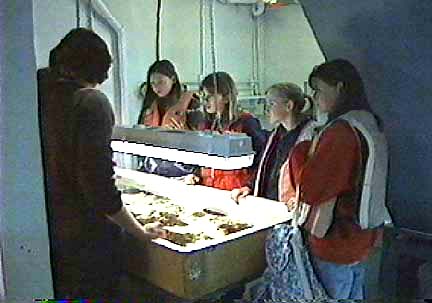
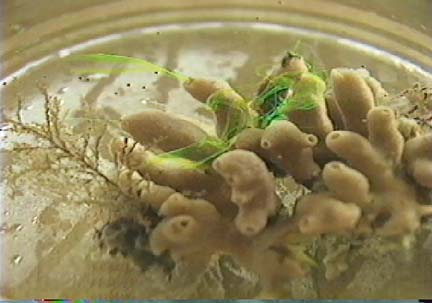
| In the spring term, 1999, the students of the Diving Service took groups of grade 7 students from the Sooke school district on field trips to the Marine Protected Area of Race Rocks Ecological Reserve.
|
||||||||||||||||||||||||
GOALS OF THE DIVING SERVICE SCHOOLS PROGRAM:
In order to make the experience more enjoyable and informative for everyone, we suggest that the students do some research before coming on the field lab. It would make things more interesting if they could get a basic familiarity with some of the possible species in the different phylums which they will be seeing at Race Rocks.
|
Color Polymorphism in the Intertidal Snail Littorina sitkana at Race Rocks
Patterns of Color Polymorphism in the Intertidal Snail Littorina sitkana in the Race Rocks Marine Protected Area.
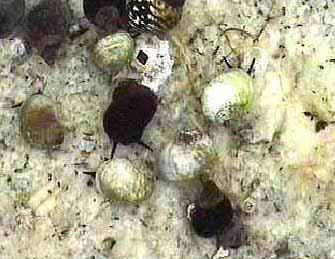
- Figure 1 In Fig. 1 the snails were purposely placed on the white quartz substrate to show the contrast between a shell of color 27 ( white ) and some of colors 1 – 10 ( Black to grey ).
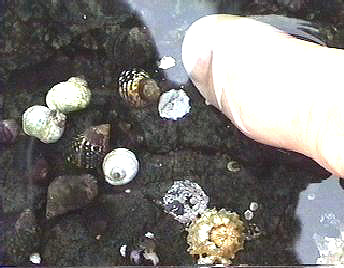
- Figure 2 The same process was repeated in Fig. 2 below only on black, basaltic substrate adjacent in the same tidepool. (Note three black snails (color 1-10) in lower left hand corner.)
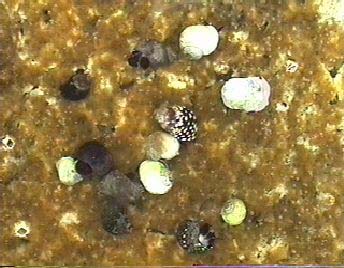
- In Figure 3. Several colors of snail can be seen grazing on the golden diatoms in Pool 4 in the spring of 1998.
Extended Essay done by: Giovanni Rosso, Lester Pearson College, 1998 .
The complete version of the research is available in the Library at the college.
Abstract:
As with most intertidal gastropods, Littorina sitkana shows remarkable variations in shell color. This occurs both in microhabitats which are exposed or sheltered from wave action. There seemed to be a close link between the shell coloration of the periwinkle and the color of the background substrate. Field work was carried out on the Race Rocks Marine Protected Area in order to investigate patterns of color polymorphism. Evidence from previous studies was used to support interpretations and understand certain behaviors.
The results showed that in the study site there was a very strong relation between the shades of the shells and the colors of the rocks. Light colored shells stayed on light shaded rocks and vice versa. An interesting pattern was noticed with the white morphs. These were rare along the coast
(only 2%), but were present in relatively high numbers in tidepools of white quartz. From previous experience (Ron J.Etter,1988), these morphs seem to have developed as evolutionary response a higher resistance to physiological stress from drastic temperature changes between tides. Some results showed that the white morph is present in an unexpectedly high percentage at the juvenile stage, but then their number decreases dramatically. As in Etter’s study more research needs to be made on the role visual predators have in this phenomenon.
ROSSO, Giovanni Edoardo 0034 -083
Patterns of Color Polymorphism in the Intertidal Snail Littorina littorea at
the Race Rocks Marine Protected Area.
AN EXTENDED ESSAY PREPARED FOR THE INTERNATIONAL BACCALAUREATE
Candidate number: 0034 – 083 February 1999
Name: Rosso, Giovanni Edoardo
Best language: Italian
School: Lester B. Pearson College of the Pacific
Subject: Environmental Systems
Supervisor: Mr. Garry Fletcher
Table of contents:
Abstract ————————————————————— 3
Introduction ———————————————————- 4
Materials and methods ———————————————- 5
Data analysis ———————————————————- 7
Conclusion ———————————————————– 12
Observations ——————————————————— 13
Evaluation ———————————————————— 16
Suggestions for further studies ———————————— 16
Acknowledgments ——- ——————————————- 18
Literature cited —————————————————— 18
Appendix ————————————————————- 19
2
Abstract:
As most intertidal gastropods, the Littorina littorea shows remarkable variation in shell color. This occurs in both microhabitats that are exposed or sheltered from wave action. There appeared to be a close link between the shell coloration of the periwinkle and the color of the background surface. Fieldwork was carried out at the Race Rocks Marine Protected Area in order to investigate patterns of color polymorphism. Evidence from previous studies was also taken into account to better support interpretations and understand certain behaviors.
The results showed that in the study site there was a very strong relation between the color of the shells and the color of the rocks. Light colored shells lived on light shaded rocks and vice versa. An interesting pattern was noticed on the white morphs. These were rare along the coast (Only 2%), but were present in relatively high numbers in tidepools set in white quartz. From previous experience (Ron J Etter, 1988 ), these morphs seem to have developed, as an evolutionary response, a higher resistance to physiological stress from drastic temperature changes between tides. Some results showed that the white morph is present in an unexpectedly high percentage at the juvenile stage, but then their number decreases dramatically with age. As in Etter’s study, more research needs to be done on the role of visual predators in this phenomenon.
3
Introduction:
There is strong evidence to prove that intertidal gastropods are highly polymorphic for shell coloration (Ron J Etter, 1987). Even within a single species it is not uncommon to find considerable shell color variation in a single trait (Laurie Burham, 1988 ). In the genus Littorina the color of the shell often appears to be parallel to the one of the background (Heller, 1975; Smith, 1976; Reimehen, 1979; Hughes and Mather, 1986 ). Nevertheless the causes and patterns of color polymorphism. in intertidal gastropods are still a fairly unexplored field. Many paths have been undertaken to make some light upon these obscure areas. The most common interpretation was always the presence of visual predators (Ron J Etter, 1987) like birds and fish. Others investigated on the effects of the shells diets. But more recent studies ( Rowland, 1976; Ossborne, 1977; Berry, 1983 ; Etter, unpubl. ) have shown that diet virtually does not affect the shell coloration, although the intensity of pigmentation might be slightly altered. Finally, physiological stress has been introduced as a possible cause color polymorphism. A very interesting study, made by Ron J. Etter on the intertidal snail Nucella Lapillus, shows how the white coloration suffers much less from temperature variations in dry micro habitats as opposed to the brown morphs. With his work he gave some revolutionary insights on the distribution of the shells according to their color.
In my fieldwork I chose to disprove the null hypothesis that there is no link between the color of the periwinkle and the color of the substrate it is living on. In order to do this I sampled a great quantity of empty shells and scaled their color from I to 27. 1 then chose five rocky coastal areas, each of a different shade. I analyzed the color of the live shells on each of the chosen rocks, scaled them according to their color and then graphed the results. I also observed the young shells in the inside of barnacles and took notice of their color frequencies in relation to their quantity. I ended my study looking in some tide pools and recording new surprising results. I concluded that:
I roughly calculated that between one station and the other there was a change in tide level of 13 cm. I therefore kept this in account and lowered the quadrat accordingly into the water.
Data analysis-
Rock – 1 (Black)
The rock contained a creek were I noticed a very high density of periwinkles in a very limited area. In the inside of the creek they were almost piled and glued on top of each other. With the help of a pen I extracted them and laid them on a white sheet of paper. Once I accomplished the process of identification I put them back. I noticed that the bigger shells (10 to 14 mm wide) were located on top of the smaller ones (3 to 6 mm wide). This made me think that the bigger ones wanted to protect the smaller ones from swells and predators. It actually does work as a protection system, but it surely is not because of the kind nature of periwinkles. It is obviously a matter of physical size.
Rock #1 -Shade #1
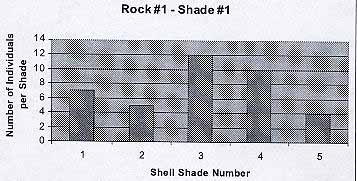
From the graph we see that the black rock hosted the darkest shades, from 1 to 5. The average number of individuals per shade is 7.6. The average shell color is 3.
7
Rock # 2- Dark grey
As opposed to the previous case the surface of rock # 2 was rather flat. Population was regularly distributed. All shells seemed to be above 5 mm in width. Here I had the opportunity to understand the great resistance that periwinkles have to salinity changes. In fact some of the shells were located under the flow of a fresh water pipe. It might have been a coincidence but these shells were slightly bigger (7 to 12mm wide).
Rock #2 – Shade 2
. 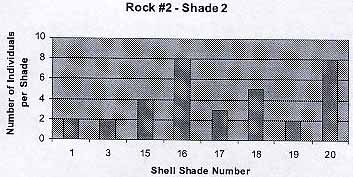
The graph shows that there are some exceptions (Color 1, 3) to the trend that has been shown in the previous graph. I guessed that these are the cases of lucky shells that have not jet been seen by birds or fish. The average number of individuals per shade is 4.25 . The average shell color is 13.6 .
Rock – 3 (Brownish red)
The reddish color of the rock came from many small algae that covered its surface. I did not notice any irregular patterns in distribution. The shells seemed to be above 5 mm in width.
8
The background color was parallel to the shade of the periwinkles. Color 1 and 20 appear to be exceptions: only three individuals in total. The average number of individuals per shade is 4.4 . The average shell color is 9.4.
Rock – 4 (Light brown)
Rock #3 -Shade 3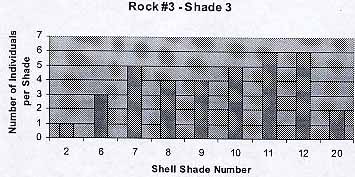
The surface of the rock was very irregular.. Some areas were covered with dead barnacles ( Balanus sp. ). I noticed that here the shells were smaller in size and they tended to be gathered around the barnacles. Nevertheless I repeated the process.
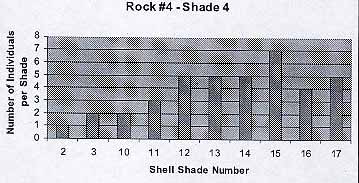
Rock #4 -Shade 4
9
The population reflects the previous trends. The average number of individuals per shade is 3.8. The average shell color is 11.3.
Rock – 5 (White rock with dark patches)
This rock was one of the most interesting ones. In fact, the two different shades of the rock gave place to a particular phenomenon that clearly disproved the null hypothesis. I tried to be as precise as I could in distinguishing the shells on the white and dark spots. I noticed the net distinction between the color polymorphism on the two areas.
Rock #5 -Shade 5
In the light patches the average number of individuals was 4.3. The average shell color was 23. In the dark areas the average number of individuals was 4.8. The average shell color was 3.
If the color of the shell would be directly proportional to the one of the rock, the average shell colors would be:
Ideal Model
10
Rock 1
| 3 | |
| Rock 2 | 13 |
| Rock 3 | 8 |
| Rock 4 | 18.5 |
| Rock 5 | 24.5 / 3 |
Actual Model
In the actual experiment the averages were:
Rock 1
| 7.6 | |
| Rock 2 | 13.6 |
| Rock 3 | 9.4 |
| Rock 4 | 11.3 |
| Rock 5 | 23 / 4.8 |
I assume that the dark grey rock is actually lighter than the brownish red
one. If we observe the results we understand that that:
| Rock Number Actual Shade |
Ideal One | Error | |
| 1 | 7.6 | 3 | 4.6 |
| 2 | 13.6 | 13 | 0.6 |
| 3 | 9.4 | 8 | 1.4 |
| 4 | 11.3 | 18.5 | 7.2 |
| 5 | 23 / 4.8 | 24.5 / 3 | 1 / 1.8 |
Considering that a minority of the shell color numbers was far away from the average: the average error is of 2.8. This means that on average the actual color was 2.8 units away from the ideal one, therefore disproving the null hypothesis. (Chi square test was used to verify the results.)
11
Conclusions:
The data analysis clearly shows that in the Race Rocks area there is a very strong relation between the color of the shell and the color of the background they are standing on. The shells with light shades are found on light colored rocks. The same relation is true also for the opposite extreme case were we find black shells on black rocks.
I feel that the model we can create from this experience is relevant above all because the consequences of human presence are reduced to very low levels. In fact, I have been operating in a Marine Protected Area were not many people go. The area is relatively free both from water and air pollution. The only predators are the natural ones. Besides this, the ecosystem is intact and the populations of all the organisms are at almost climax level. The amount of visual predators includes crabs, sea gulls, black oystercatchers, pigeon guillmonts, otters and fish.
From the observations made (p. 13, second part) on the entirely white morphs, we may deduce that there is a strong link between what Ron J. Etter found out on the Nucella lapillus and the Littorina littorea. Putting the pieces of the puzzle together we notice that the distribution of periwinkles is obviously affected by numerous reasons. There seems to be a wide color gap between the shades 1 to 26 and 27. The first twenty-six, when wet, are not very different from each other. The white morph instead is clearly identifiable both when it is wet or dry. If we keep in account that the vast majority of the coastal area on Race Rocks is dark, obviously it will be easier to for shells 1 to 26 hide. The white shells instead have such a great disadvantage that only 2% survive. Keeping in account Etter’s results we may conclude that, excluding a minority of extraordinary circumstances, all these deaths are caused by predators. In fact, when the juvenile periwinkles leave the barnacles, their shell is still soft. Now, if the white periwinkles are born near an area of white surface, then their chances of being seen decrease and actual groupings of white shells may be noticed. The color of their shell also allows them to bare physiological stress much better than the darker shades. The stress comes from the drastic changes in temperature between tide variations. In the case of the Nucella lapillus, in Etter’s experiment, the white shells inhabited most of the sheltered areas and, as previously mentioned, dry areas. This could also apply to the Littorina littorea, but on the Race Rocks Island the sheltered areas are very few and the number of predators is high. The white quartz is the only substrate that can host them (once they leave the Balanus sp.). I feel that if the ocean conditions were not as rough and there would be fewer
12
predators, the white morphs would also be seen on the darker rocks. In the tide pool both the white morph and the dark one live together The mortality of the last though is obviously higher, both for predation and stress (Ron J Etter).
In the dark areas the presence of the white morph is almost nonexistent (2%). But the shells belonging to shades 1 to 26 are distributed according to a remarkable pattern. On light colored rocks we will find shells that belong to the high numbers. In the opposite case the same trend applies. – In the area I took in exam this close relation is probably emphasized by the high intensity of predation. The contrasts are easily spotted and eliminated. Therefore, in the absence of predators, I think that the darker shells would be able to live on any color surface. Of course the dark population would suffer more in the dry areas as opposed to the lower levels.
Observations:
As I was watching the newborn shells (about 1 mm wide) in the dead barnacles I found out that the presence of white shells is unexpectedly high at this stage. I tried counting them and recording the results. On average a dead 20-mm wide Balanus sp. holds between four and eight shells of Littorina littorea. I analyzed ten samples in two different areas and recorded the number of white juvenile shells:
Area
| Total number of shells | Number of white shells | |
| 1 | 5 | 2 |
| 6 | 2 | |
| 8 | 4 | |
| 4 | 3 | |
| 4 | 1 | |
| 5 | 3 | |
| 6 | 4 | |
| 7 | 3 | |
| 6 | 2 | |
| 8 | 5 | |
| 2 | 4 | 2 |
| 7 | 4 | |
| 8 | 5 | |
| 3 | 0 | |
| 5 | 3 | |
| 7 | 4 | |
| 8 | 4 | |
| 6 | 3 | |
| 4 | 3 | |
| 9 | 5 |
In the first area the average Balanus sp. held 5.9 periwinkles and 2.9
were white or very light colored. The percentage of white shell was of 49.
In the second area the average Balanus sp. held 6.1 periwinkles and
3.3 were white. The percentage of white shells was of 54.
The results show that on average 51.5% of the shells are white. If we
make an exception for the tidepools, the percentage of white shells present
on the protected coastal areas is 2 (This is an approximate calculation made
when collecting the dead samples and when counting the live ones). This
means that 49.5% are eaten or die before reaching a sufficient size to move
in an area where they would be protected by the background they are
standing on. According to the study made by Ron J. Etter on the intertidal
snail, Nucella lapillus, when the brown morphs and the white ones were put
on the same exposed coastal area, there were virtually no differences in the
mortality rates of the two. If we dare to make a parallel between the two
species, it would be therefore wrong to assume that the white morphs die
because of natural causes such as diseases or disadaptation. It is my opinion
that literally 49.5% of the white morphs is victims of visual predators
because they can easily be seen before reaching an area where they would
camouflage. In this case, I am not including tide pools with white bottom
and where the water is shallow. I am referring to the morph with shade 27,
which is not common along the coast probably because of the lack of
almost entirely white rocks.
On the other hand I mentioned tied pools because of a specific reason. In
fact, on the Southwestern part of the island there are six tide pools, each
with different depths and different consequent bottom coloration. During
the days of the experiment this area was inaccessible for the presence of
about 75 California sea lions and about 23 Stellar. Nevertheless, in previous
visits to the island for other reasons (the reserve is in fact managed by
Pearson College and is used for several academic programs, projects and
environmentally oriented diving) I had the opportunity to observe the
presence in tide pool – 4 of about 20 entirely white shells of Littorina littorea
standing on white quartz. This had originated a question that had long
14
remained without an answer. Why can the white periwinkles be found only in this tide pool (if we exclude the two- percent I was talking about before)? The most common explanation was based on the presence of certain minerals, difficult predation and a genetic mutation that occurred only there. To be honest, after coming across Ron J. Etters study on the Nucella Lapillus, it was hard for me not to relate the two cases.. In his study he states that the white morph heats up at a lower rate as opposed to the brown morph in shallow and protected areas. Observing a higher rate of mortality (not due to predation) in the brown morph, he deduced that the white morph had developed a better defense mechanism against physiological stress. It therefore has higher chances of survival in very shallow water or in those areas that remain exposed between tides for a long time. Although brown snails can avoid exposure to the sun by moving to more shaded and moist microenvironments, Etter thinks their greater susceptibility to stress nonetheless puts them at a disadvantage by limiting their foraging area and increasing the amount of time that they must spend in hiding- This in turn could lead to slower growth rates and reduced levels of fecundity (Laurie Burnham, Scientific American, September 1988 ). On the other hand this does not exclude the presence of natural predators, especially in young age.
If we compare these results to the observations made on Race Rocks we may find many points in common. Especially after I had a new confirmation. In fact, in a tide pool with difficult access in another part of the island I found a similar behavior. On a small area of white quartz I found five entirely white periwinkles. There is a big difference in size between the ones I found there and the population of tide pool – 4. The first ones were about 2-3 mm wide; the second ones were 6-12mm. This might be due to the fact that they were living in a creek of difficult access to most predators. Nevertheless the pattern fits: the white periwinkles are almost all found in areas of shallow water or that remain exposed for a long time between the action of tides. On the other hand these are the only areas were white quartz is found on the island. The observations made on the fieldwork make me almost certain that the reasons for the white morphs to be in the tide pools are an adaptation to physiological stress and a perfect camouflage. In Etters experiment most of the protected areas were inhabited by white morphs. On Race Rocks only two tide pools contained such organisms and in very low quantities. I think this can be explained by the combination of several factors. In the first place the ocean conditions around the island are
15
very rough and they make it hard for the shells to survive in all areas.. In the second place there is very limited quantities of white rock were the shells can camouflage. Finally the very high quantity of visual predators, both from the air and form the sea, make it very difficult for these shells to move around because they will immediately be seen.
Evaluation:
Due to the lack of hi-tech material I had to verify my observations with simple tools- This forced me to use other people’s previous studies (Ron J. Etter) to better understand what I saw. If I had disposed of an instrument to measure the internal temperature of the shells I could have repeated Etters experiment on the Littorina littorea.
My experiments allow the creation of a model that is true, as far as we know, only on the Race Rocks Marine Protected Area. Other generalizations should be verified. In order to obtain a more reliable model the experiment should be repeated over a longer period of time on a regular basis. The month of October is a period when there is a significant increase in predation also due to the fact that the colony of seagulls on the island is incremented by the newborn.
I chose a vast scale of shade variations in order to achieve more precise results. By doing this, it was hard for me to identify exactly to which number each shell belonged. Even though I tried my best I might have made some mistakes.
Knowing that there are significant differences in distribution between the exposed and the sheltered areas, each of the sites was not exposed to the same environmental conditions. Some were more exposed to currents than others.
Suggestions for further studies:
As I mentioned in the introduction the causes and patterns of color polymorphism in intertidal gastropods are a fairly unexplored field. There are therefore still many grey areas that need to be cleared.
The fieldwork I had the opportunity to make on Race Rocks allowed me to learned many things on these fascinating creatures, but posed also many questions to which I have no answer.
I was surprised when I found so many white periwinkles in the barnacles. It would be interesting to find out exactly what happens to them once they leave these shells:
Who exactly are their predators?
16
At which stage in growth does their shell become too hard to be digested?
How do they choose the areas where they stop?
Are there certain types of minerals that create better conditions for living? Is there a link at all?
What is the exact probability for a shell to be white at birth?
Is the gene universal or is it majority- present in certain areas?
How does the alimentation affect growth and reproduction rate?
The white shells are more tolerant to physiological stress, but does this affect the immunitary system? Which diseases are the most common?
The fieldwork I have done seems to apply for Race Rocks, but is it true also in other nearby areas? To what extent does the exposure to rough environmental conditions affect distribution? Since the tide pool was covered and surrounded by sea lions, it was obviously affected by their waste products. The population of periwinkles seems to be fairly stable? How tolerant are these shells to changes in pH? Is there a difference between the degree of tolerance of the dark and the white morphs?
17
Acknowledgments
I sincerely thank my supervisor, Mr. Garry Fletcher, for his encouragement, support, precious advise and constructive criticism. I am also very grateful to Mr. Mike and Miss. Carol Slater for hosting me on the island during the field work. I will never forget the delicious supper we had together on Thanksgiving Day. In the end, I would like to thank Mr. Chris Blondeau for his sincere interest and for bringing me at Race Rocks by boat.
Literature cited:
Laurie Burnaham, September 1988, The hard shell, pp.26-27, Scientific American.
Ron J. Etter, April 1987, Physiological stress and color polymorphism in the
intertidal snail Nucella Lapillus, Museum of comparative zoology, Harvard
University, Cambrige, MA 02138.
Jane M. Hughes and Peter B. Mather, December 1984, Evidence for predation as a
factor in determining shell colorfrequencies in a Mangrove snail Littorina Sp.,
School ofAustralian Environmental Studies, Griffith University, Nathan,
Queensland,Australia.
18
APPENDIX 1. Photographs of Littorina littorea
In Fig. 1 the snails were purposely placed on the white quartz substrate to show the contrast
between a shell of color 27 (white) and some of colors
1 – 10 ( Black to grey).
The same process was repeated in Fig. 2 below only on black, basaltic substrate adjacent in the
same tidepool. (Note three black snails (color 1-10) in lower left hand corner.)
Figure 1 Figure 2
19
Apendix 2. Photographs of the shell shades of Littorina littorea
There was a very significant difference in color between the dry and the wet shells. In the two pictures some of the shells had to be moved around in order to maintain the darker periwinkles before the lighter ones. For example, wet shell number 11 had to be moved to 9 on the dry scale
20
Appendix 3. Picture from Ron J. Etters fieldwork
Ron J. Etter noticed that in the Nucella Lapillus the white morph was more common in the sheltered areas. The brown one dominated in the areas of wave exposure. He concluded that the color of sea shells on the seashore may be an evolutionary response to physiological stress.
The color of seashells on the seashore may be an evolutionary response to physiological stress
Photographs of Littorina sitkana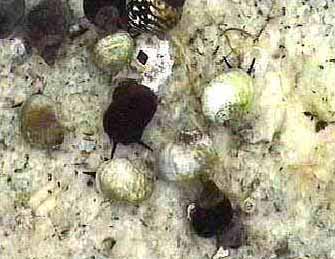 Figure 1
In Fig. 1 the snails were purposely placed on the white quartz substrate to show the contrast between a shell of color 27 ( white ) and some of colors 1 – 10 ( Black to grey ).
The same process was repeated in Fig. 2 below only on black, basaltic substrate adjacent in the same tidepool. (Note three black snails (color 1-10) in lower left hand corner.)
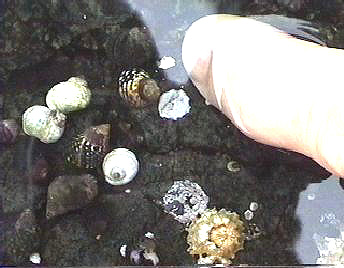 Figure 2
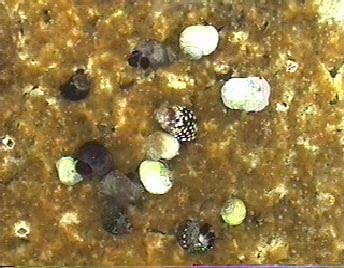 In Figure 3. Several colors of snail can be seen grazing on the golden diatoms in Pool 4 in the spring of 1998.
Abalone tagging at Race Rocks with Pearson College Divers
In 1998, we began a long term research program, initiated by Dr. Scott Wallace, on the population dynamics of the Northern Abalone
(Haliotis kamtschatkana). For several years, the Pearson College divers monitored the population. In this video, Pearson College graduate Jim Palardy (PC yr.25) explains the process.
Transect Study- Environmental Systems Class peg-15
PEG 15 TRANSECT
ENVIRONMENTAL SYSTEMS CLASS
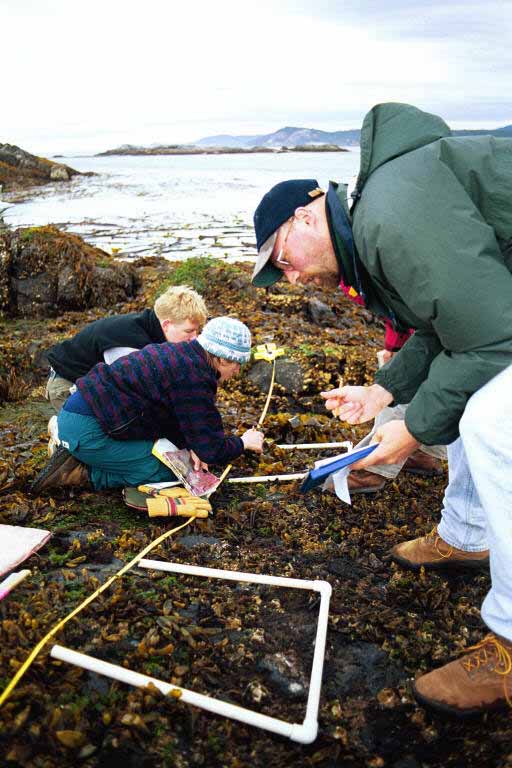
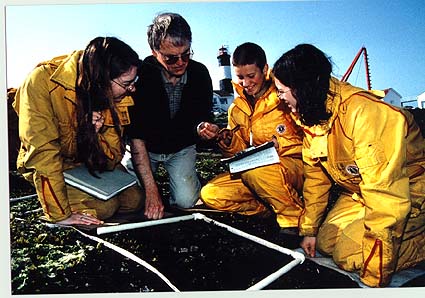 April 1998: For this Exercise, a section of gently sloping shoreline to the East of the Docks at Peg #15 was chosen.(large old original oil-barge docking post This intertidal zone rock is exposed to the North West, but protected by the corner of Great Race Island projecting to the West. The transect was laid at a bearing of 285 degrees. Maximum exposure of the area occurs when the wind blows from the North East in the winter months. This work was done in April when the area experiences the first of the low tides in the early part of the day.
-
- Nick at the end of the line

-
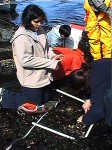
- Andria checks one quadrat

-
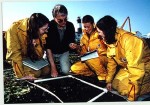
- Ragen and Tara with Garry

-
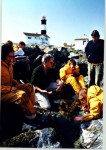
- Garry and class

-
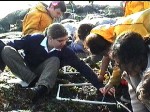
- Sara counts invertebrates

-
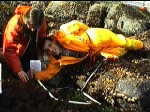
- Sebastien as part of the count

-
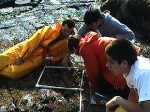
- Sebastien again

-
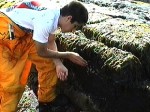
- Jose checks out the algae

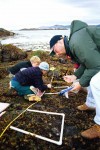 Also see the images of the Royal Roads students working on peg 15 in the summer of 1999.
The following is the transect strip. It will take a few minutes to download the whole strip ..
The photos for the transect strips were taken in 8mm video by Sebastian and Garry after the class recorded the details of species distribution over the 50 cm strip, running perpendicular to the shoreline.
Images of the students were scanned from slides taken by Duane Prentice, a professional photographer who lives in Victoria and is an Alumni of Pearson College.. Images copyrighted, 1999 by Duane Prentice.
|
PEG 15 : PHOTO BELT TRANSECT
|
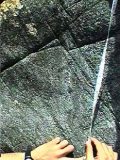
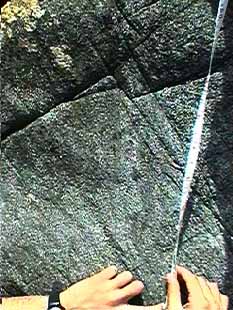
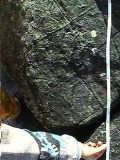
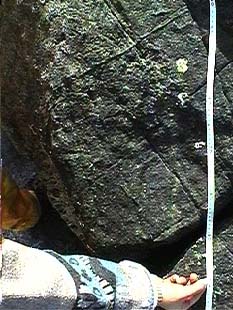
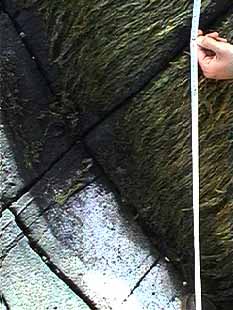
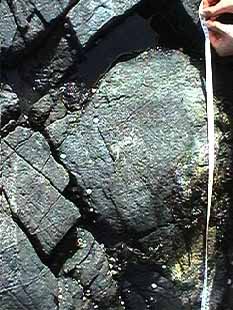
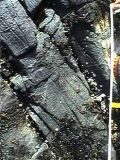
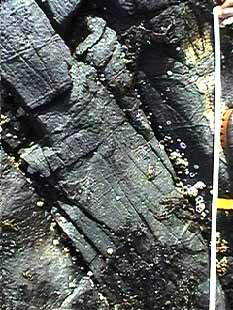
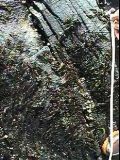
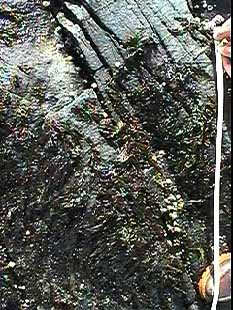
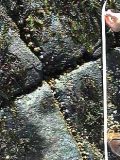
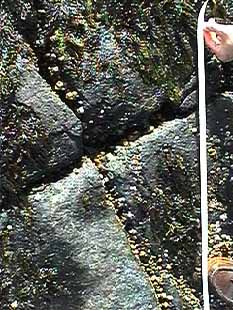
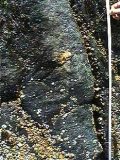
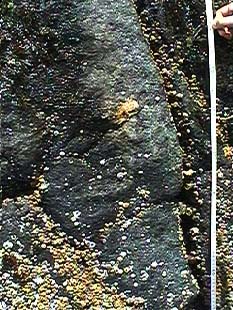
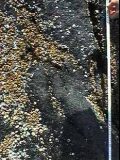
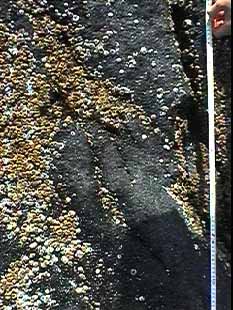
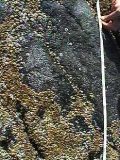
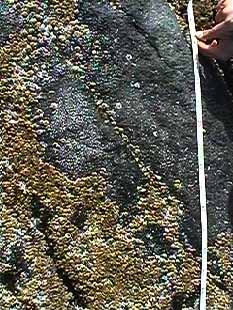
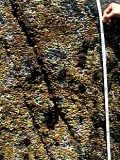
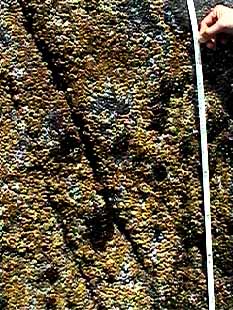
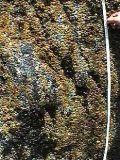
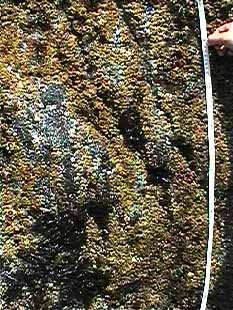
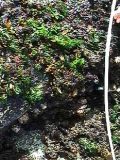
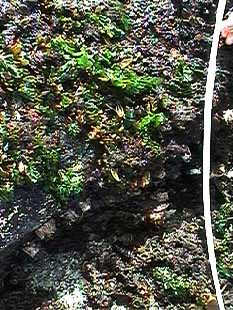
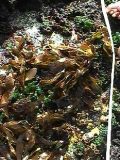
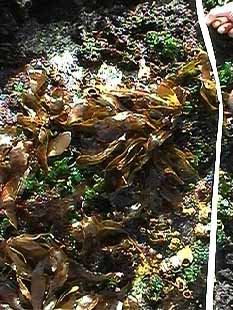
Bearing 285 degrees. This area has a fairly constant slope for the 12.5 meters over a vertical range of 3 meters.The photos, one half meter in length, were taken from a video at low tide, in APRIL 1998 by Garry and Sebastian. |
| Investigation: | 1. Plot a profile of the shoreline given the information provided.2. Determine the percentage coverage of the different species of algae shown.3. The physical factors of the habitat of an algae living high in the intertidal zone like Porphyra changes with the seasons. In this area, our low tides occur in the daytime in the summer and in the night time during the winter. It would be revealing to compare the exposure during the daytime in February or March with the exposure in June. First determine from the profile drawn above, the range of tidal level where this species lives intertidal. Then go to the data page where you can access the Tidal Predictions for Race Rocks . From the tidal level profile for Victoria, you will be able to see a graph of the tide levels .Determine how many hours this Porphyra will be exposed to the air by recording the cumulative lengths of time that the water level does not go above the lower limit of the algae. If you do this for different times of the year, you will be able to quantify the time spent submerged or emmerged over a number of days. Be sure to take into account the time of the tidal cycle when choosing days to measure, because you will notice a two week pattern of Spring ( maximum range ) and Neap( minimum range) tides.
Based on your evidence, suggest a hypothesis that could explain why this algae disappears from this area for most of the summer. |
BELT TRANSECT PHOTO
Distance in metres from peg 15 is at the bottom of the picture
Comments and species identification follow the pictures
-
- 0.5 metres
-
- 1.0 metres
-
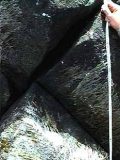
- 1.5 metres
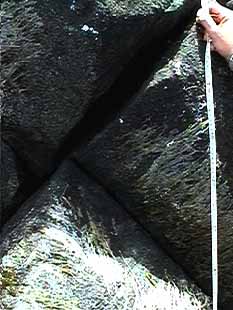
-
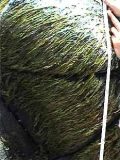
- 2.0 metres
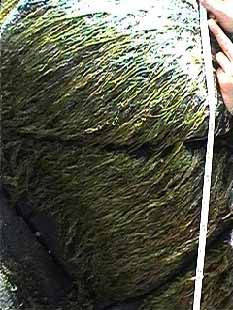
-
- 2.5 metres
-
- 3.0 metres
-
- 3.5 metres
-
- 4.0 metres
-
- 4.5 metres
-
- 5.0 metres
-
- 5.5 metres
-
- 6.0 metres
-
- 6.5 metres
-
- 7.0 metres
-
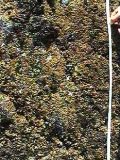
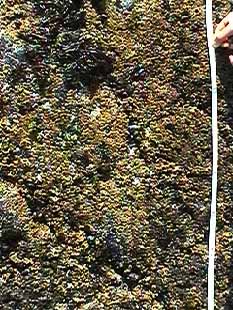
- 7.5 metres
-
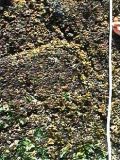
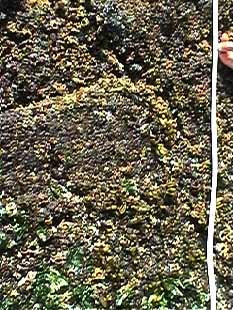
- 8.0 metres
-
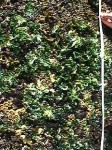
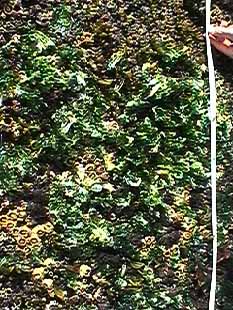
- 8.5 metres
-
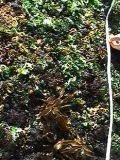
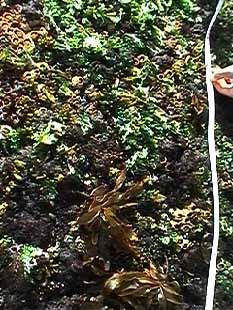
- 9.0 metres
-
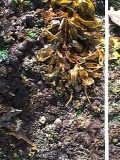
- 9.5 metres
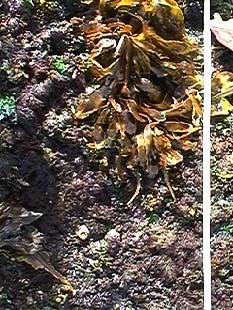
-
- 10.0 metres
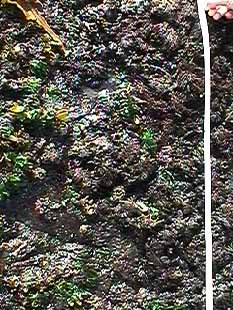
-
- 10.5 metres
-
- 11.0metres
-
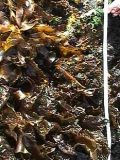
- 11.5 metres
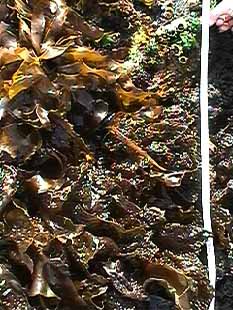
-
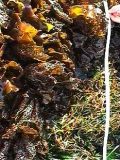
- 12.0metres
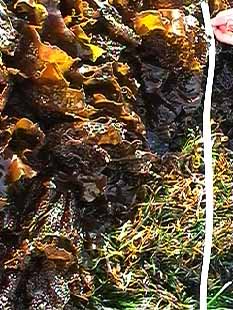
-
- 12.5 metres
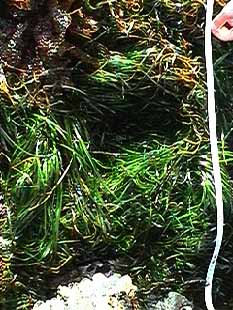
Notes: at 0.5 metres: This is the upper level just below peg15 The yellow lichen at the top by the peg is Xanthoria parietina
At 1.0 Metres : Life is very sparse in this high splash zone, although a prominent invertebrate that we find is the tiny red miteNeomolgus.sp.
At 2.0 metres: Life is very sparse in this high splash zone, although a prominent invertebrate that we find is the tiny red mite Neomolgus.sp
At 3.5 metres: A few barnacles are starting to appear in the moist crevices.
At 6.5 Metres :Barnacles almost totally cover this areas for several meters
At 8.0 metres: The sea lettuce, Ulva lactuca starts to appear.
At 9.5 metres: The brown algae here is Alaria sp
At 11.5 metres: The wrinkled brown algae: Hedophyllum sp.
At 12.5 metres : The green grass-like plant is Phyllospadix sp , (an Angiosperm, not an Algae)
See Transect A0050101
See Transect A0050102
See Transect A0050103
___________________________________________________________
Return to the Contents page for Environmental modelling with Transects..
MEASUREMENT OF SURFACE AREA USING “NIH IMAGE”
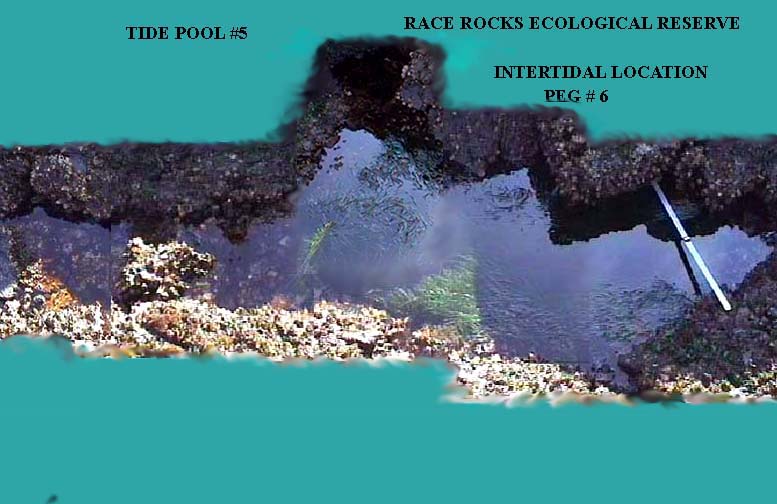 The image that you have available must be either a .Tiff or a .Pict . You may download the full screen version of this image, pool5.jpg and then convert it to one of those formats using graphics converter or Photoshop or any suitable image handling program.The image of the tide pool shown here has a 1 meter ruler in it . An object of known length must be present in the picture in order to do measurements.
1. Open NIH image using the small black microscope icon. (If you do not have NIH Image installed on your computer you may download it here. download NIH Image ( available in Mac or PC )
2. Open the image “pool5.pict” that you have made by downloading the “pool5.jpg”.
3. From the TOOLS pop-up menu in NIH Image, select the SELECT LINES tool ( the dotted line fifth from the top of the right hand column).
4. Click and drag the select lines tool over the one meter image in the picture.
5. Click on the top Menu bar item ANALYZE, then move down to SET SCALE
6. In the SET SCALE box, set the units to centimeters. Set the KNOWN DISTANCE to 100., press “OK“
7. Select the region to measure using the freehand selection tool, ( fourth down on the Tools bar– heart shaped dotted line.)
8. Outline the area to be measured by tracing the perimeter of it with this tool.
9. CLICK on ANALYZE– OPTIONS – in the tool bar.
10 .Click in the boxes for Perimeter and Area. ( Other options may be tried after this basic step has been mastered.)
11. Click on ANALYZE — MEASURE –ANALYZE–SHOW RESULTS . Now you should see the calculated area and perimeter in the results box.
Further information on page 6 of the “NIH Image” direction manual
BBC interview on the future use of technology to bring Race Rocks to the internet
In November of 1997, BBC reporter Hugh Warrick accompanied Garry Fletcher to Race Rocks and did an interview on the future plans for using technology to make available the resources of Race Rocks to all through the internet.
As is said in the interview : “Typical of ecotourism you could love an area to death”— the solution of using the right kind of technology to broadcast on the internet is discussed and even robotically controlled video cameras on the internet are mentioned. Later in the early part of 2000 that was to become a reality .
for mp3:
BBC interview on a Proposal for Virtual Race Rocks
In November of 1997, I was interviewed by Hugh Warrick of the BBC on a plan to set up a network on RaceRocks to be able to have live streaming video on the internet, Here is the audio clip of that interview
BBC Interview at Race Rocks in November of 1997 on Technology for Sustainability at Race Rocks
Why do Transects ? overview and techniques
THE OVERVIEW:
Images of transects applied to biological systems provide educators and students an opportunity to explore a wide diversity of systems and habitats. Traditionally, transects have been used in ecological studies to understand populations and community associations within selected habitats. The same concepts may be used to investigate any number of other biological systems ranging from individual organisms, or parts of organisms, to global ecosystems.
The transect provides a tool to focus attention on specific, selected systems and the effects of abiotic and biotic parameters affecting those biological units in the system. Qualitative and quantitative analyses by students at many levels, utilizing the resources of the world wide web, will provide the ability to study not only the specific transect site, but to link those studies with related research and information. It is our expectation that this exercise will not only provide an opportunity for an actual educational experience but will form the initial stimulus for contributions on new sites by other individuals and groups on a world wide basis. This would transfer the collaborative classroom exercise to a research activity reflecting the collaborative nature of international science.Educators and students are encouraged to use, among others, the Bio QUEST philosophy of collaborative learning to develop additional exercises that support the use of transects as a tool for biological investigations and learning.
Collaborative Curriculum Lead-In:
Using the internet with biological transects can enhance knowledge and appreciation of important relationships in established biological systems. It is an ideal technique to foster and promote collaboration among students of a class, or between students from different geographic areas, the states or provinces, and countries. Teachers at all levels (K- 16) can take advantage of this medium to introduce students to the WWW as an information-providing tool, and as a research tool (example: NIH Image). Furthermore, they are encouraged to get their students to provide other examples of transects so that a transect data base on the web can be expanded. It could eventually include a wide variety of biological systems whether from a microscopic view point or a satellite perspective.
TECHNIQUES:
The basic premise of the initial transect presentations on this web site is of transects established linearly across a biological site (often through an environmental gradient). The measuring device used depends on the size of the site and the logistical constraints in putting it into place. It is envisioned that eventually transects ranging in size from a microscopic level to a satellite image level will appear here.
Note: to be useful for this project, all images contributed must have a reference measurement scale visible or the scale must be known so that it could be inserted into the pictures. Photos also need to be of good quality. It is also possible that accurate drawings could provide the image for a transect.
BIOLOGICAL SYSTEMS
Transects may be used in any biological system that is appropriate to the educational and scientific mission. What is presented here are suggestions for choosing habitats; the list is not all-inclusive, but hopefully a stimulus for further selection and development of sites. Most of our natural ecosystems in the world are being affected by the onset of Climate Change. If we are to know what the components of a natural ecosystem are , we need to document them before irreversible change occurs,
EXTERNAL SITES:
1. AQUATIC HABITATS:
a. Marine
- Water column (vertical and horizontal transects; use of satellite imagery)
- Rocky Intertidal
- Mud Flats
- Sandy Beaches
- Subtidal
- Cobble and Shingle Beaches
- Tide Pools
- Coral Reefs
- Thermal vent communities
- Ice Flow Communities
b. Estuarine
- Water column
- Mangrove communities
- Mud and sand flats
- Salt marshes
- Lagoons
- Docks and pilings
c. Fouling (Settlement) communities
d. Freshwater
- Lakes and ponds
- Ephemeral pools
- Rivers, streams and creeks
- Marshes
2. TERRESTRIAL HABITATS:
- Forest and woodland
- Grassland
- Savannah
- Chapparal
- Deserts
- Urban lot
- Agricultural fields
- Tundra
INTERNAL [LABORATORY BASED] SITES:
1. Microscopic communities: use of bacteria, protists, invertebrates, algae
- Petri dish populations
- Tissue culture populations
- Glass slide populations
2. Macroscopic habitats
- Aquaria – marine, estuarine and freshwater
- Terraria – desert to moist
We hope that this page will soon expand to include a wide range of images of very different transects. Some of the transects we would like to see contributed are :
-
- A transect through a bog ecosystem.
- A transect through an alpine ecosystem from the foot of a melting glacier.
- A transect through the shoreline of a drying salt pan as one sees in Saskatchewan or other locations on the North American Plains.
- Aerial transects from the tundra showing distribution of Caribou herds and vegetation .
- Aerial transects through the savannahs of Africa showing animal distribution patterns .
- Coral Reef and Mangrove Forest transects.
- Vertical Transects in Forest Ecosystems.
- Microscopic Transects.
HOW DOES ONE PREPARE IMAGES TO BE ANALYZED?
ECOLOGICAL NICHE MODELING: This file gives detailed instructions on the method used to download pictures for processing, measuring, and further work. It also contains details for an exercise on the 3D modelling of ecological niches of organisms.
ORIGINAL AUTHORS:
| This program was developed at the 1995 BioQUEST Summer Workshop on Collaborative Learning, Peer Review, and Persuasion in Biology Education at Beloit College, WI. USA The authors of the program were :
|
Peg 5 sample transects
See Transect A0050101
See Transect A0050102
See Transect A0050103
_____________________________________________________________
Return to the Contents page for Environmental modelling with Transects..
The Schools Project Archive 1997-98
SCHOOLS FIELD LAB PROJECT: In the late 1990’s the Pearson College Diving Service ran a series of field trips involving students of grade seven classes in the Sooke School District.The field trips were to the Pilot Study Marine Protected Area of Race Rocks Ecological Reserve. The students of the Diving Service took responsibility for designing the curriculum, organizing the trips and conducting the field trips. The files below came from an earlier version of the Pearson College website. This page will show some of the images from those trips and the exercises the Diving Service members designed for the grade 7 students.
-
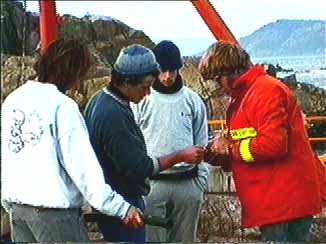
- In the fall of 1997, the members of the diving service worked to establish a wet lab in the old Workshop at Race Rocks.
-
- This involved moving two large touch tank-aquariums and installing a saltwater pump for the operation of the system.Local grade 7 students visit for a tour.
-
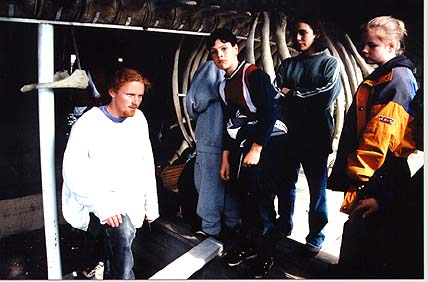
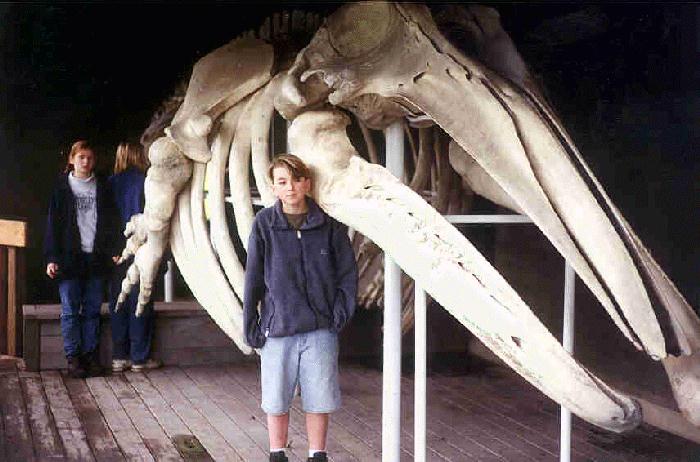
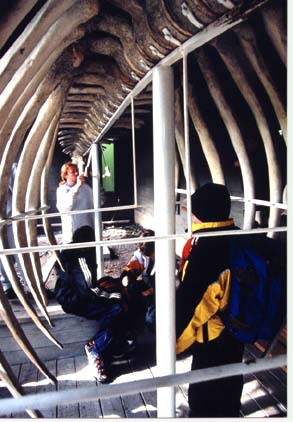
- Andrew gets the students to think about the size of the Gray Whale mounted on the campus before the students load onto the boat for their trip to the Ecological Reserve.
-
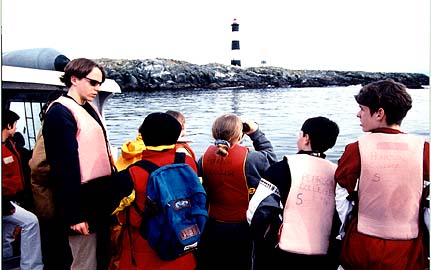
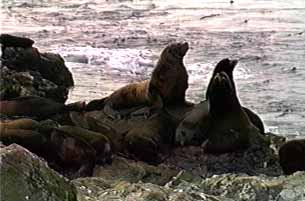
- On the way to the island, the boat stops at various islands to see the four species of marine mammal.
-
- The visiting grade seven students were rotated around to the different stations upon arrival at the island of Great Race Rock in the ecological reserve.
-
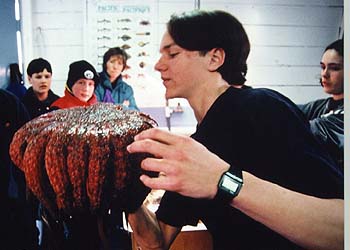
- Albert demonstrates marine invertebrates and their adaptions for feeding and locomotion , and Ragen urges the students top get a close up view of a sea star.
-
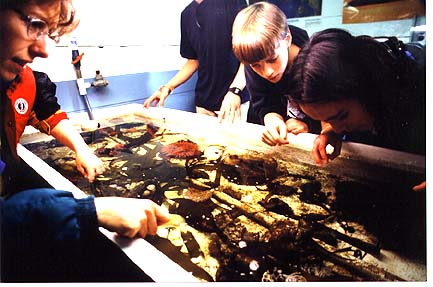
- Ragen urges the students top get a close up view of a sea star.
-
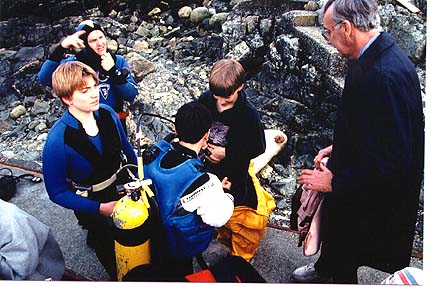
- Sarah showing members of Mr.Philion’s class of Wishart Elementary School, the operation of the SCUBA apparatus.
-
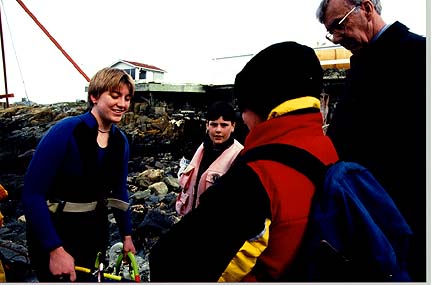
- The students take turns breathing compressed air and test the weight of the equipment.
-
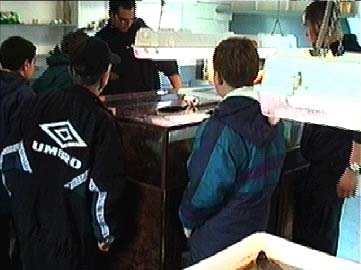
- We were also able to get a group of Cubs from the local Metchosin community on a field trip to the island. Giovanni shows the cubs the invertebrates in the seawater tanks.
-
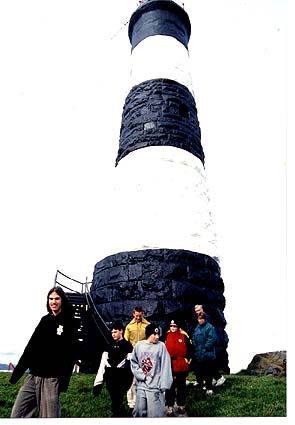
- Nick at the base of the light tower with a group touring the various systems that help to support the operation of the station.
A special thanks to Duane Prentice (PC year4), now a professional photographer working out of Victoria, who has contributed his time and energy to help us build up a set of pictures on Race Rocks. Most of the schools program pictures above have been supplied by him.