Underwater Materials Performance Testing-Succession/Fouling


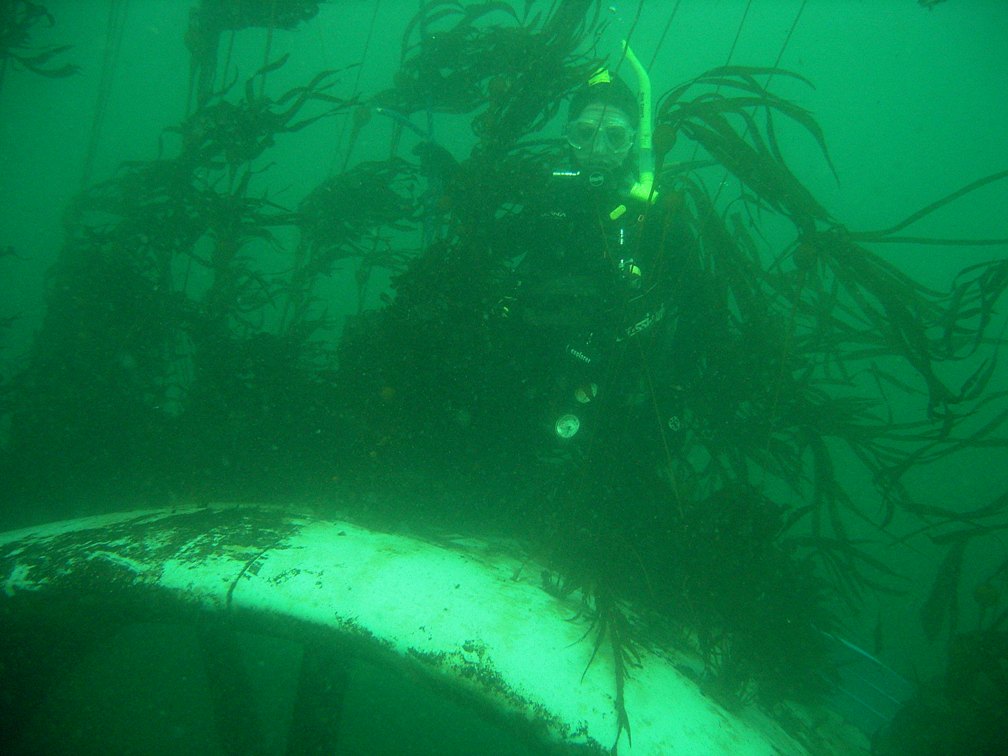
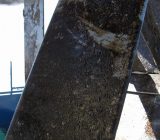
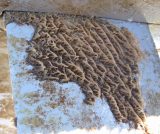
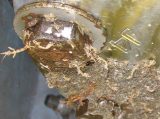
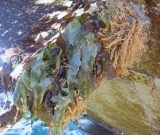
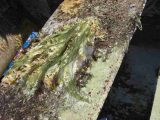
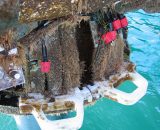
In December of 2007,The Pearson College Divers installed a set of junction boxes as part of a materials testing experiment for the tidal energy project

Procedure 1 Dec 7, 2007– Purpose: To test performance and resistance to fouling of PVC junction boxes and sealant compounds
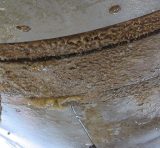
Procedure 2 Jan 10, 2008– Purpose: to test resistance to fouling and corrosion of different alloys of Stainless Steel as well as various types of fasteners.
Procedure 3 Purpose: to protect submarine cables from chafing on sharp rocky edges
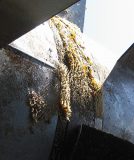
Procedure 4 Purpose: To prevent corrosion of steel Ibeam supporting and holding power and control cables through intertidal zone.
Procedure 5 Purpose: To provide ballast to steel Ibeam carrying power cables in intertidal zone preventing movement during heavy surge.

STRATEGIES FOR A SUSTAINABLE MARINE FUTURE

1.0 Introduction:

The key message of this resource is on global marine issues, and the integral role of all humans in maintaining environmentally sustainable marine ecosystems. Examples from the British Columbia marine environment are used to illustrate the principles which can also apply on a global scale. The over-arching concept of this resource is what marine environmental sustainability means locally and how people can be encouraged to commit to contribute to the process. We believe that people of all ages can use the tools to actively participate in making our marine environment sustainable.


logoWe thank the Shaw Ocean Discovery Centre, formerly the New Marine Centre in Sidney on Vancouver Island in British Columbia for supporting the development of the document that provides the basis for this curriculum resource. I encourage you to visit this centre opened in the spring of 2009.

Garry Fletcher
Marine Education Consulting
Victoria, BC.

Proceed to 2.0 Marine Environmental Sustainability :

Index

Underwater Materials Performance Testing

See other archived video with Pearson College Divers

Procedure 1 Dec 7, 2007– Purpose: To test performance and resistance to fouling of PVC junction boxes and sealant compounds
Procedure 2 Jan 10, 2008– Purpose: to test resistance to fouling and corrosion of different alloys of Stainless Steel as well as various types of fasteners.
Procedure 3 Purpose: to protect submarine cables from chafing on sharp rocky edges
Procedure 4 Purpose: To prevent corrosion of steel Ibeam supporting and holding power and control cables through intertidal zone.
Procedure 5 Purpose: To provide ballast to steel Ibeam carrying power cables in intertidal zone preventing movement during heavy surge.

Ecological Niche -the Empirical Model

Return to the Contents page for Environmental modelling with Transects..

BACKGROUND HISTORICAL TREATMENT of the ECOLOGICAL NICHE
Joseph Grinnell 1917 the habitats and habits of birds
Charles Elton 1927 the species’ place in the biological environment, its relationship to food and predators.
G.F. Gause 1934 the intensity of competition between species suggest the degree to which their niches overlapped
David Lack 1947 realized that niche relationships could provide a basis for evolutionary diversification of species
G.E.Hutchinson 1959 was the first to define the niche concept formally as the activity range of each species along every dimension of the environment.

G. E. Hutchinson on the Niche Concept:  In 1957, in a paper entitled “the Niche Concept by G. E. Hutchinson defined the niche concept formally. One could describe the activity range along every dimension of the environment. Physical and chemical factors such as temperature, humidity, salinity, and oxygen concentration, and biological factors such as prey species and resting background against which an individual may escape detection by predators, could be determined. Each of these dimensions could be thought of as one of n-dimensions in space. Visualizing a space with more than three dimensions is difficult, since the concept of the n-dimensional niche is an abstraction. We may, however, deal with multi-dimensional concepts mathematically and statistically, depicting their essence by physical or graphical representations in three or fewer dimensions.

Ricklefs (1996) notes that “… for example, a graph relating biological activity to a single environmental gradient represents the distribution of a species’ activity along one niche dimension. The level of activity, whether oxygen metabolism as a function of temperature or consumption rate as function of prey size, conveys the ability of an individual to exploit resources in a particular part of the niche space and, conversely, the degree to which the environment can support the population of that species. In two dimensions the individuals niche may be depicted as a hill, with contours representing the various levels of biological activity. In three dimensions, we must think of a cloud in space whose density conveys niche utilization. Beyond three the mind boggles.”

Please see Hutchinson, R.E. 1957. Concluding remarks. Cold Spring Harbor. Symp. Quant. Biol. 22: 415-427.
Paraphrased from Ecology by R. E. Ricklefs 1996.
Hutchinson was the first to formally quantify the niche concept in terms of geometric space. For example, suppose the distribution of a given species of tree squirrel is determined primarily by 3 variables: branch diameter, acorn size and temperature. The “level of activity” describes the ability of the individual to exploit the resources in a given part of the niche space; in this case, number of squirrels foraging for a given level of each environmental factor. Then the niche space occupied by the species is the 3-dimensional space actually occupied by all individuals (Ricklefs 1996). This can be represented graphically as a contour plot.
An empirical model ( Box and Draper 1989) can be obtained by the empirical determination of “niche occupancy” (e.g. density, number of individuals, etc.) in terms of n environmental variables (these may be both biotic and abiotic). This model may be formalized as a second-order polynomial equation; the eigenvalues calculated from the matrix of coefficients of cross-product terms formally quantify the response surface in the area of the optimum response. The simultaneous evaluation of multiple variables is important in biological systems where optimum responses usually consist of a range of values rather than a single point.

THE EXERCISE
We have developed an exercise that allows one to take images from the transect file on the internet and process them, using the computer in order to quantify the ecological niche of organisms. The example provided is from the intertidal transect files from The Race Rocks ecological reserve, in Southern Vancouver Island, Canada.
Follow through the steps as indicated below.
a0050107.

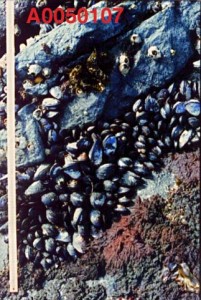
1. For instance from this image from the first transect, A00501, (A0 being the Race Rocks location, 05 being the sample station location and 01 being the first transect at that location, 07 being the seventh quadrat from the top of the intertidal zone. ). Quadrat 07 looks like this. By clicking on this icon you will see this one sample of the actual photo from the transect file.

2. If we want to define the space that the mussels occupy in this quadrat, we have to measure the percent of the quadrat that they are covering. This could be done simply by cutting out a piece of acetate that has been made by xeroxing a piece of graph paper and overlaying it on the screen.

3. A more precise way of doing this is by using an Imaging program to help analyse different aspects of the photograph. Download this image by clicking on the full size image then pressing and holding the right mouse button on a PC or pressing and holding the mouse of a Macintosh . Note that the mussels occupy a portion of this quadrat, a meter stick on the left side gives you the size of the quadrat.

4. CONVERTING THE IMAGES:
Since the above image is in a .JPG format , it has to be converted to a .PICT format for image processing. Do this with a graphic processing program .

5. Using GifConverter: Open the .jpg file obove that you have downloaded. Save it as a .PICT file. This is the format that is necessary to use in the next stage of the process, using NIH Image to measure features of the picture.

6. If you do not have a copy of the freeware NIH IMAGE. Download it from this site. (Both Mac and PC versions are available)

7. INSTRUCTIONS FOR NIH IMAGE: See this file :

Measurement of Surface Area Using “NIH IMAGE”

Also there may now be other software that is easier to use for measuring surface area coverage if one does a google search.

UPDATE: Also from NIH .. ImageJ. http://wsr.imagej.net/distros/

Calibration:
a) To calibrate the image in terms of real units: Use the straight line tool on the left panel, and draw it the length of the meter stick.
b) Use the pull-down menu called “Analyze”; go to “Set scale” . Change the units to centimeters, and “known distance” to 100.00, then hit “OK”.
c) To compute area: From “Tools” menu, select the heart-shaped tool. Outline the total area occupied by mussels. Click on “Analyze options” ; be sure the area box is selected). Press “OK”. From tool bar, select “Analyze”, “Measure”, “Analyze”, “Show results”. A table appears with the area of mussel coverage (in cm2). To compute % area occupied by mussels, measure the total quadrat area with the above procedure except use the rectangle measurement tool to outline the entire quadrat box.

8. DOWNLOADING THE TRANSECT IMAGES: Now, repeat this procedure with all the quadrats in the belt transect strip that contain mussels, you will also have to copy down the elevation found at the base of each quadrat as well..

Go to one of the transect files.

See Transect A0050101
See Transect A0050102
See Transect A0050103
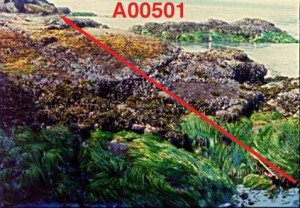
a00501


9. Select one of the transects, and download the clips.
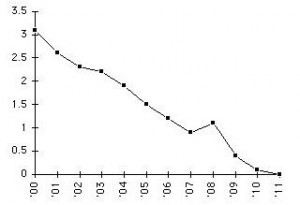


tr50110. USING A SPREADSHEET
Now we have to enter the data into an EXCEL or other suitable spreadsheet.. We will give the detailed instructions for EXCEL.
Enter data in column format (each column is a separate variable).
Calculate:
(a) % area covered by mussels for each transect (area covered by mussels/total area)
(b) percent slope: distance in perpendicular height (elevation change between adjacent quadrats divided by the linear distance (one meter) .
To evaluate terrain gradient for each transect (that is, the steepness of the intertidal shoreline), you can graph the relationship between elevation and slope .

excelfile See this example .Here is a sample of the mussel distribution data as it appears on this spread sheet
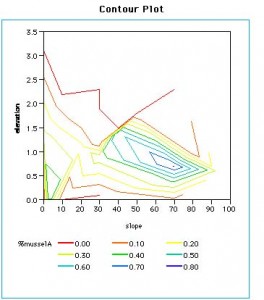


musPLOTTING IN 3D

The goal of the analysis is to both describe and predict the environmental space that mussels must occupy in order to survive. The first step in the formal process is a graphical description of the environmental space actually occupied by the animals. In this example, the environmental space is the two dimensional space defined by the variables elevation and slope; the biotic “response” is the percent area occupied by mussels.We imported the variables X1 = “elevation”, X2 = “slope”, Y = “% mussel area” into a standard 3D graphics package (e.g. JMP-Contour Plot). The resulting graph gives the contour plots of mussel density as a function of the 2 environmental variables. Interpretation is similar to reading contour lines on an ordinary topographical map. Note that the “optimum” area for mussel settlement is a range of values for elevation and slope rather than a single point.

This file on Ecological Niche Models was developed by Penny Reynolds, Richard Rosecrance and Garry Fletcher at the Bioquest Consortium Workshop, on WHAT CAN WE LEARN FROM CONTEMPORARY MATHEMATICS REFORM? June 21-29, 1997. Beloit, Wisconsin. It was supported by a grant from the Howard Hughes Medical Institute to : The BioQuest Curriculum Consortium

1. Other websites on Photo transects :

Getting to the bottom of things

http://sango.churashima.okinawa/monitoring_en/cpc.html

Marine Algae of Hawaii.

Location of the photographic transects recorded during the benthic survey of the reefs in the Pondoland Marine Protected Area,
Return to the Contents page for Environmental modelling with Transects..

6-Month Fouling Records on Tidal Energy Turbine

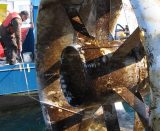
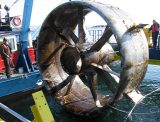
A week before raising the turbine in April 2007, the outer Nereocystis, or Bull kelp  growth was removed by the Pearson College Divers. Since the top of the turbine is in a water depth averaging 10 metres it is shallow enough for the brown Macroalgae to take foothold and within a few weeks it would have reached the surface. This algae can atttach to a solid substrate within the top 12 metres of water at Race Rocks.

asasa

Solar Energy at Race Rocks

cormwingm correlate  solar
Link to the Effects of Solar energy on organisms at Race Rocks: Correlations File: Data has been selected to show seasonal patterns and to allow some study of the relationships between solar radiation, uv  and temperature Second exercise on Solar and UV. This one also links through to the raw data references for the factors.
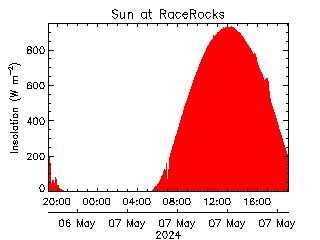
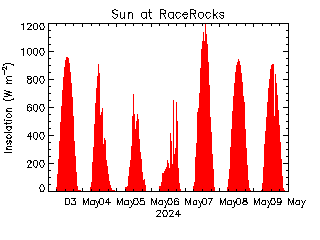
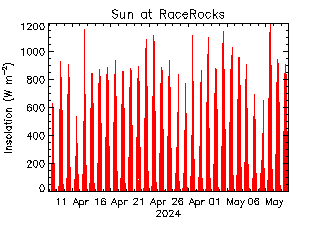
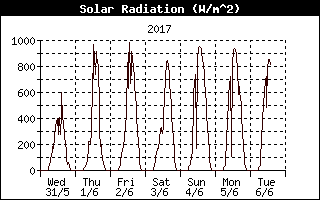
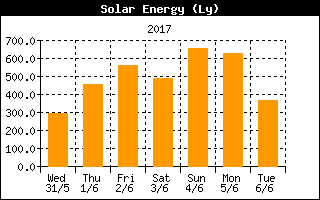
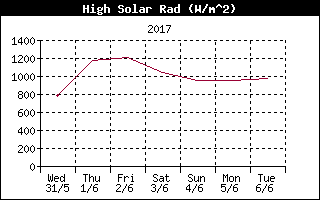
solar day solar week solar month
Graph of today’s Solar Insolation:
The intensity of the incoming radiation is measured in Watts per square metre (Wm-2)
Cick on the above graphs for a larger version of the past week’s solar level at Race Rocks.  The “three graphs above represent historical records of Solar insolation at different time scales These graphical interpretations are made possible by the website victoriaweather.ca
Solar Radiation Levels SOLAR ENERGY Hi Solar
Solar Radiation levels for the past week.. This is the peak solar raddiation measured during the archive interval..(30 min) Solar Energy history for the past week: The amount of accumulated solar radiation energy over a period of time measured in Langleys; 1 Langley= 11.622 Watt-hours per square meter =41.84  kilojoules per sqare metre=3.687   BTUs per square foot Highest levels of Solar Radiation for the past week as recorded on the davis Weather Instrument.
solar energy
The SOLAR ENERGY part of the
Integrated Energy Project at Race Rocks
Alternate Energy: Solar,
A curriculum resource
AN EXPLANATION OF WHAT THE SOLAR MEASUREMENT REPRESENTS
As the Earth orbits the Sun, it receives approximately 1,400 W / m? of energy, as measured upon a surface kept normal (at a right angle) to the Sun (this number is referred to as the solar constant). Of the energy received, roughly 19% is absorbed by the atmosphere, while clouds on average reflect a further 35% of the total energy. The generally accepted standard is 1020 watts per square meter at sea level.
website on the Basics of Solar Energyhttp://zebu.uoregon.edu/disted/ph162/l4.html
Incident Solar Energy on the ground:• Average over the entire earth = 164 Watts per square meter over a 24 hour day So the entire planet receives 84 Terrawatts of Power our current worldwide consumption is about 12 Terrawatts so is this a solution?
Broadband Solar Irradiance – theoretically the solar radiation arriving at the earth from all frequencies or wavelengths, in practice limited to the spectral range of radiometers, typically from 300 nm to 3000 nm wavelength. Meteorologists refer to this band as short-wave radiation.
Electromagnetic Radiation – the energy produced by an oscillating electrical (and magnetic) field, transmitted by photons. See Electromagnetic Spectrum – the entire energy range of electromagnetic radiation specified by frequency, wavelength, or photon energy. The low end of the spectrum is infrared radiation (heat), and passes through the colors of visual light from red through violet, through ultraviolet radiation, x-rays, and gamma rays. Radio and television are transmitted on specific electromagnetic frequencies.
Shortwave Radiation – the principal portion of the solar spectrum that spans from approximately 300 nanometers (nm) to 4000 nm in the electromagnetic spectrum. Longwave radiation is infrared radiation (>4000 nm).
Watt – a unit of power defined as a Joule per second.. A Joule is – a metric energy unit (Newton-meter) equal to approximately 0.2389 calories.
Btu – British Thermal Unit, the amount of energy required to raise one pound of water one degree Farenheit at 60°F, equivalent to 1055 joules or 252.1 calories.
LuxThe lux (symbolized lx) is the unit of illuminance in the International System of Units (SI). It is defined in terms of lumens per meter squared (lm/m2). Reduced to SI base units, one lux is equal to 0.00146 kilogram per second cubed (1.46 x 10⁻³ kg / s3).
One lux is the equivalent of 1.46 milliwatt (1.46 x 10⁻³ W) of radiant electromagnetic (EM) power at a frequency of 540 terahertz (540 THz or 5.40 x 10¹⁴ Hz), impinging at a right angle on a surface whose area is one square meter. A frequency of 540 THz corresponds to a wavelength of about 555 nanometers (nm), which is in the middle of the visible-light spectrum.
The lux is a small unit. An alternative unit is the watt per meter squared (W / m2). To obtain lux when the illuminance in watts per meter squared is known, multiply by 683. To obtain watts per meter squared when the illuminance in lux is known, divide by 683 or multiply by 0.00146.
Illuminance varies inversely with the square of the distance from the source on a free-space line of sight. If the distance is doubled, the illuminance is cut to 1/4; if the distance increases by a factor of 10, the illuminance becomes 1/100 (0.01 times) as great.
lumenThe lumen (symbolized lm) is the International Unit of luminous flux. It is defined in terms of candela steradians (cd multiplied by sr). One lumen is the amount of light emitted in a solid angle of 1 sr, from a source that radiates to an equal extent in all directions, and whose intensity is 1 cd.
One lumen is the equivalent of 1.46 milliwatt (1.46 x 10⁻³ W) of radiant electromagnetic (EM) power at a frequency of 540 terahertz (540 THz or 5.40 x 10¹⁴ Hz). Reduced to SI base units, one lumen is equal to 0.00146 kilogram meter squared per second cubed (1.46 x 10⁻³ kg multiplied by m2 / s3).
The lumen is a small unit. An electromagnetic field power level of 1.46 milliwatt is small; the radio-frequency (RF) output of a children’s toy two-way radio is several times that much. A frequency of 540 THz corresponds to a wavelength of about 556 nanometers (nm), which is in the middle of the visible-light spectrum. A steradian is the standard unit solid angle in three dimensions; a sphere encloses 4 pi (approximately 12.57) steradians.The Davis Weather Instrument provides a measure of solar radiation in Langleys: This is Solar Radiation Integrated over time. One Langley equals 11.622 Watt hours per square meter= 697.32 Watt minutes per square meter.This file is  a link on Solar Cycle Progression from NOAA. It includes data on sunspot activity.Return to the Physical/Abiotic factors Files:

Dichotomous Key for Animals of Race Rocks

Description: This is a key to only the more common animals you may see using the remote cameras on Race Rocks. Use the taxonomy files to view others you may sight.

Go to the Race Rocks Taxonomy for more detailed descriptions of the organisms.

Number . Go to / and Identify
1a Bird 2
1b Mammal 30
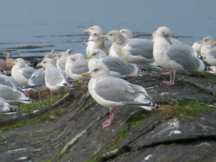
2a Gull-like, white or brown 3
2b Non-gull 11
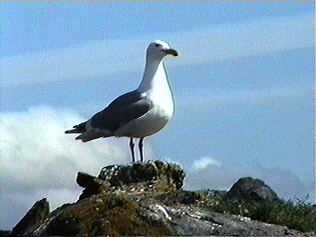
3a The Largest white-headed gull we see at Race Rocks. It is present March to October
Glaucous- winged gull
3b Other gulls 4
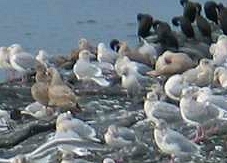
4a Present in large flocks – November to January. Colour white with beige-tinged flecks
Thayer’s gulls
4b Other gulls 5
5a White – smaller head with an outlined eye
Mew gulls  
5b Other gulls 6
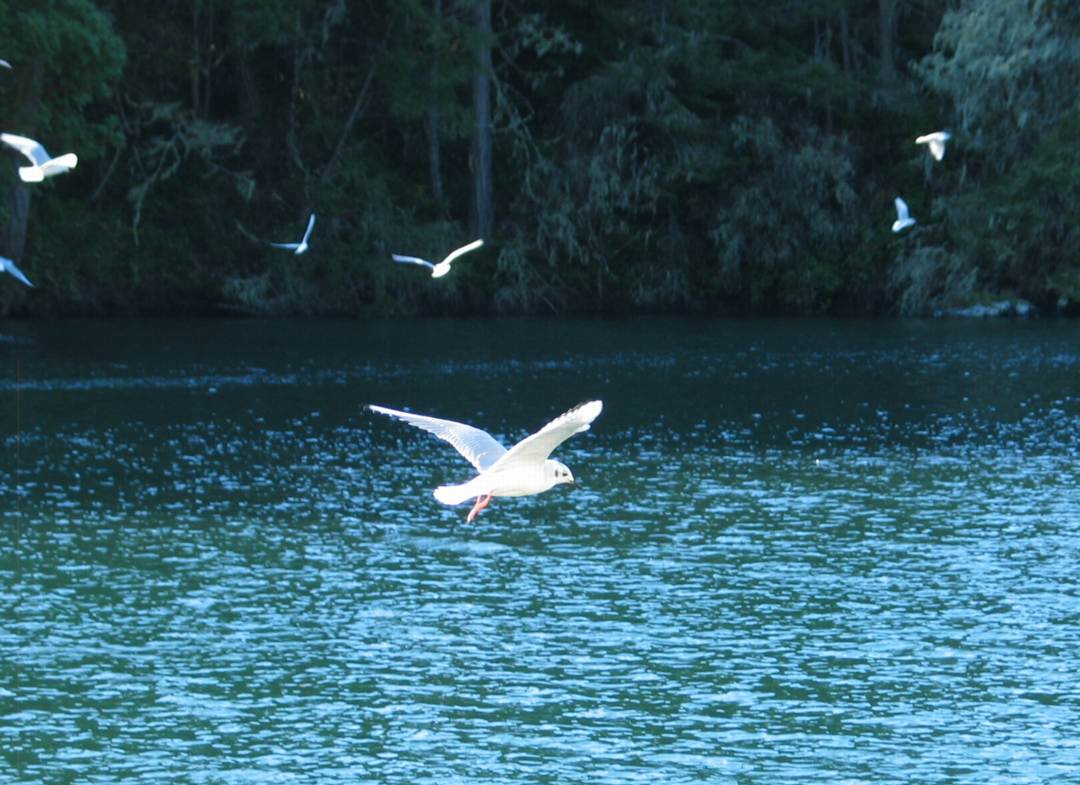
6a Small white-headed gulls with black eyes and small black markings over the body. Often seen in flocks diving into the water… Aug to Dec.
Bonaparte’s gullsbonapartes
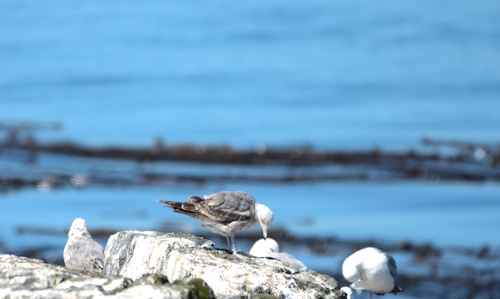
6b Brown or dark grey gull. 7
7a Grey gull, short tail
Immature Glaucous winged gull
7b Brown gulls 8
8a Brown mottled. appear November thru Feb.
Immature Thayer’s gulls
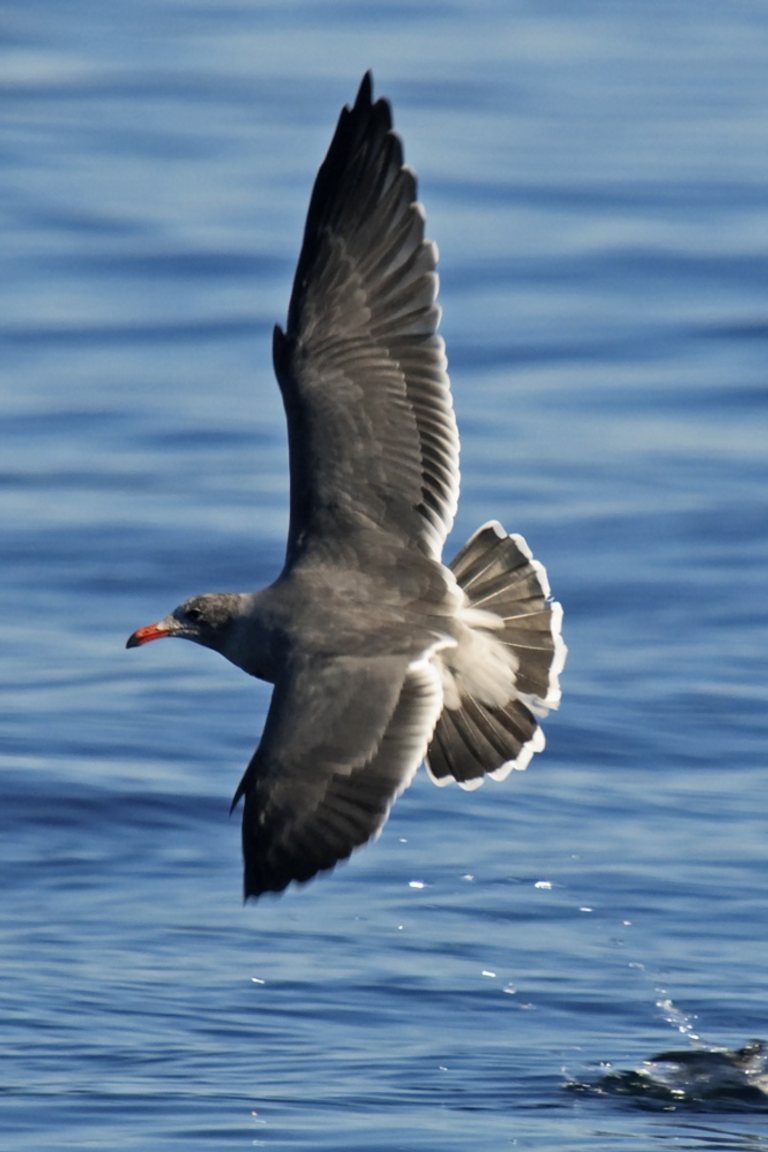
8b Brown Gull with orange beak. adults have white markings on the tail. Heerman’s Gull
9a For future additions.
9b
10a
10b NOTE : We are adding more birds frequently so they can not be anticipated in a key like this. Other gulls and shorebirds added since this key was made may be viewed in the Race Rocks Taxonomy files .. vertebrata-Aves-Charadriiformes


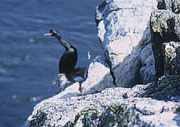
11a Predominantly black, long-necked bird:one of the 3 cormorant species 12
11b Birds other than gulls or cormorants: otherwise, all other shorebirds and land birds on Race Rocks. 14
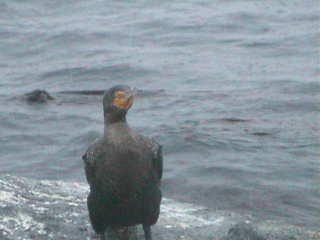
12a Pale or yellow coloured face – present only during winter months
Double-crested cormorant
12b Predominantly black face 13
13a Light-coloured throat patch, males with white ears – present in January
Brandts’ cormorant
13b Snake-like neck, smallest of the cormorants
Pelagic cormorant
14a Black with white wing patches and red feet
Pigeon guillimot
14b Other shorebirds and landbirds and ducks/geese 15.
15a Shorebirds.and ducks/geese 16
15b Land birds.. shorter bills 21
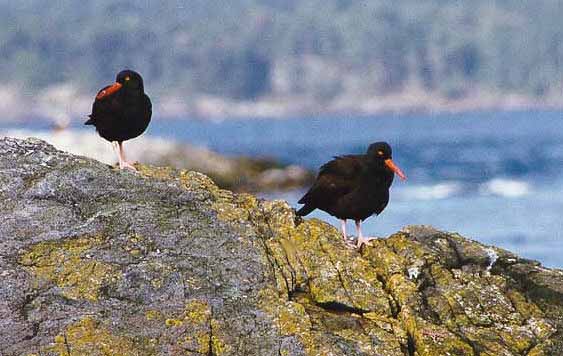
16a Black with long red bill.. crow-sized
Black oyster-catcher
16b ducks or geese and other shorebirds 17
17a Small shorebird, often seen in winter near the fresh water pools. White breast, uppers mottled.black and white pattern in flight
Black turnstone
17b Duck or goose or land birds 18
18a Small colourful duck..swimming in kelp beds or perched very near shore
Harlequin Duck
18b Geese and other birds 19
19a Geese 20
19b Other birds 21
20a Large Goose, Black neck with white throat. Nests in April
Canada Goose
20b Half the size of the Canada goose, only rarely appears. white neck-ring and black chest.
Black Brant Goose
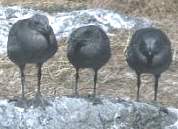
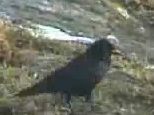
21a Black- Crow-like bird 22
21b Other birds,and songbirds 24
22a Large black bird with thick bill. They are as large as Glaucous-winged gulls
Raven
22b Medium sized black bird smaller than Glaucous winged gulls. go to 23
23a Large black bird , the bill is finer than a raven’s
North-western Crow
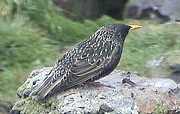
23b Small balckish bird, speckled with color
European
Starling
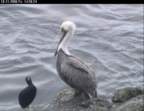
24a Very Large brown and white bird with a long bill equipped with a pouch
Brown
Pelican
24b Other shorebirds go to 25
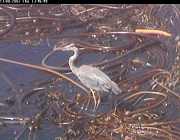
25a Long legged, and long necked bird… heron -like
Great Blue
Heron
25b Other shorebirds go to 26
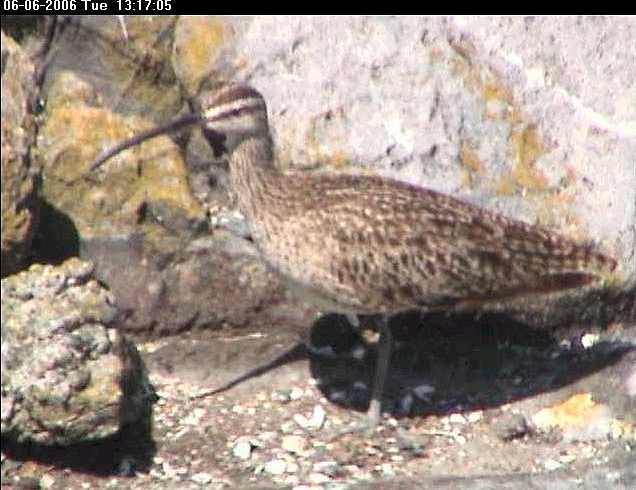
26 Brown shorebird with long bill curved downward. Brown eye- line.
Whimbrel


<>

30a Always found in water, with fins, and a large, flat, two-pointed tail – Whales, Dolphins, Porpoises 31
30b Often found resting on land or on rocks – size of a dog or larger 37
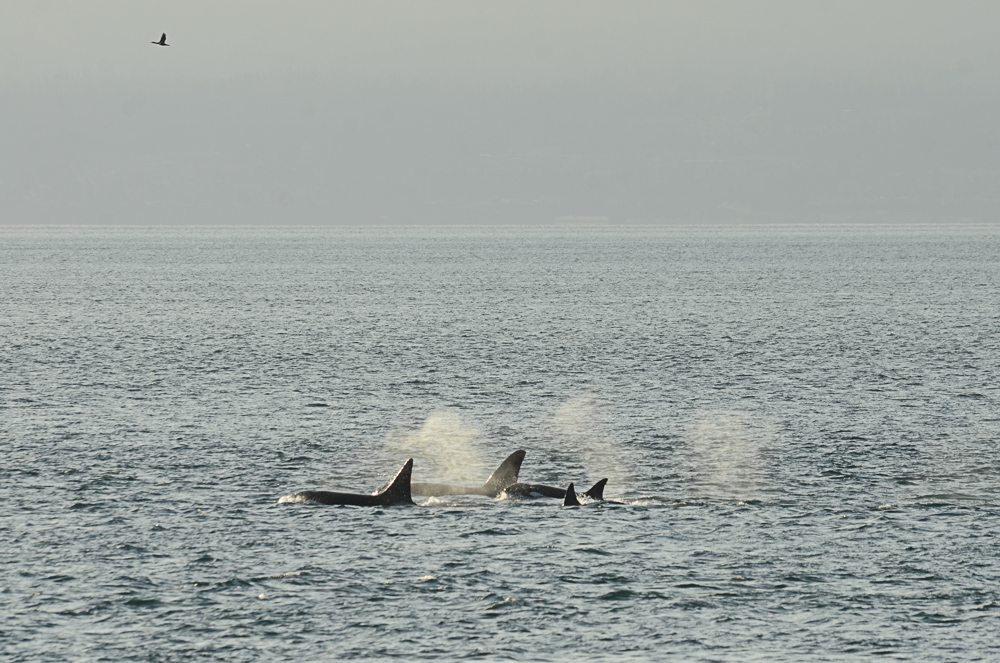
31a Black with a large white patch on the belly, greater than 4m long, males with large dorsal fin (1m high or greater)
Orca,
Killer whale
31b Not black or without white patches 32
32a Smaller, light grey colour, flippers smooth on edges
Gray whale
32b Other marine mammals 33
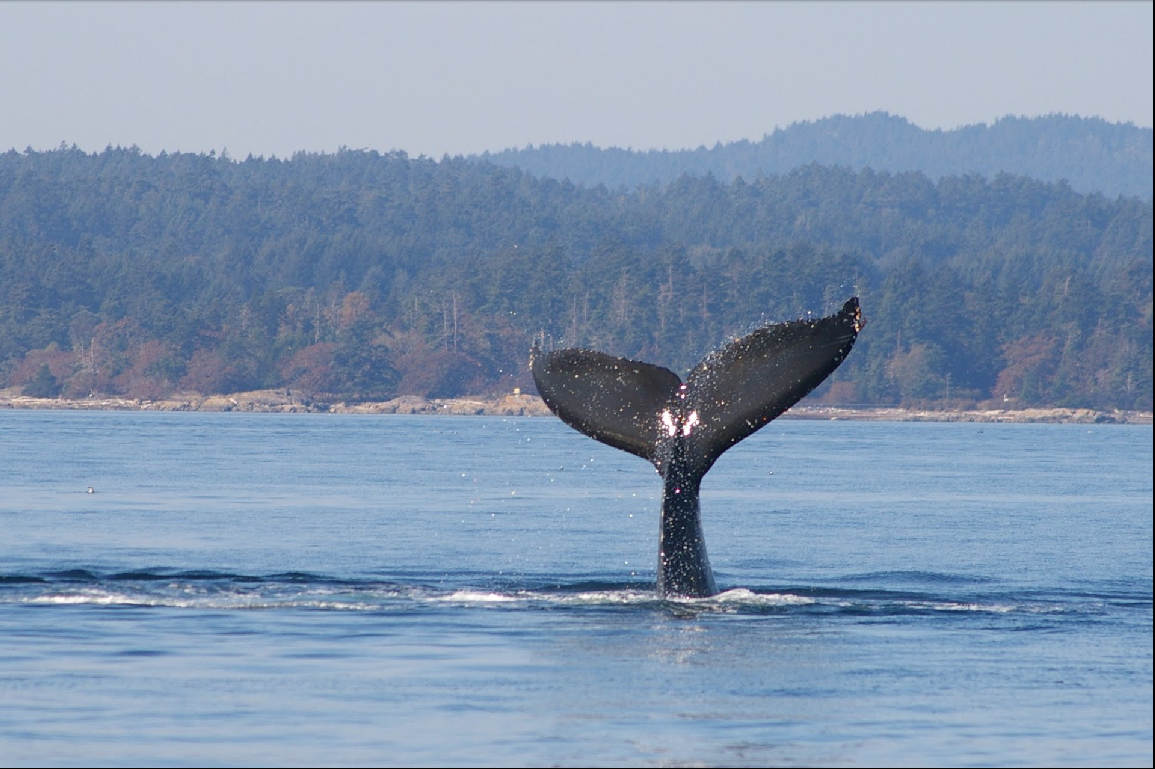
33a Large whale, dark grey to black, with distinct ridged underbelly, flippers jagged on edges. usually seen solitary.
Humpback whale ” alt=”humpback” width=”129″ height=”107″ border=”2″ />
33b Small porpoise often seen in pods, leaping in the waves.
Dall’s
Porpoise
34a spare room for future whales and porpoises. See the taxonomy for other species that have been sighted near Race Rocks
34b
37a Lie prone on land, rocks, or very shallow water; when swimming, are mostly submerged – Earless seals 38
37b May be sitting on their elbows or lying prone on land; often visible swimming in the water; colour beige through chocolate. 39
38a White through black colouration, may have young from April through July
Harbour seal
38b May be very large; length up to 4m; males have a bulbous nose; colour grey through chocolate.. present year round.Females smaller, usually on the top of middle rock, but not year round.
Elephant seal
39a Small; furry animals the size of a cat or dog
Otters go to 41
39b Sea lions 40
40a High-browed; chocolate coloured
California sea lion
40b Round forehead; light beige coloured; may be twice as large as California sea lion
Northern sea lion (Steller’s sea lion)
41a Small; long tail; runs on all fours on land may appear as serpent-like in water. River otter
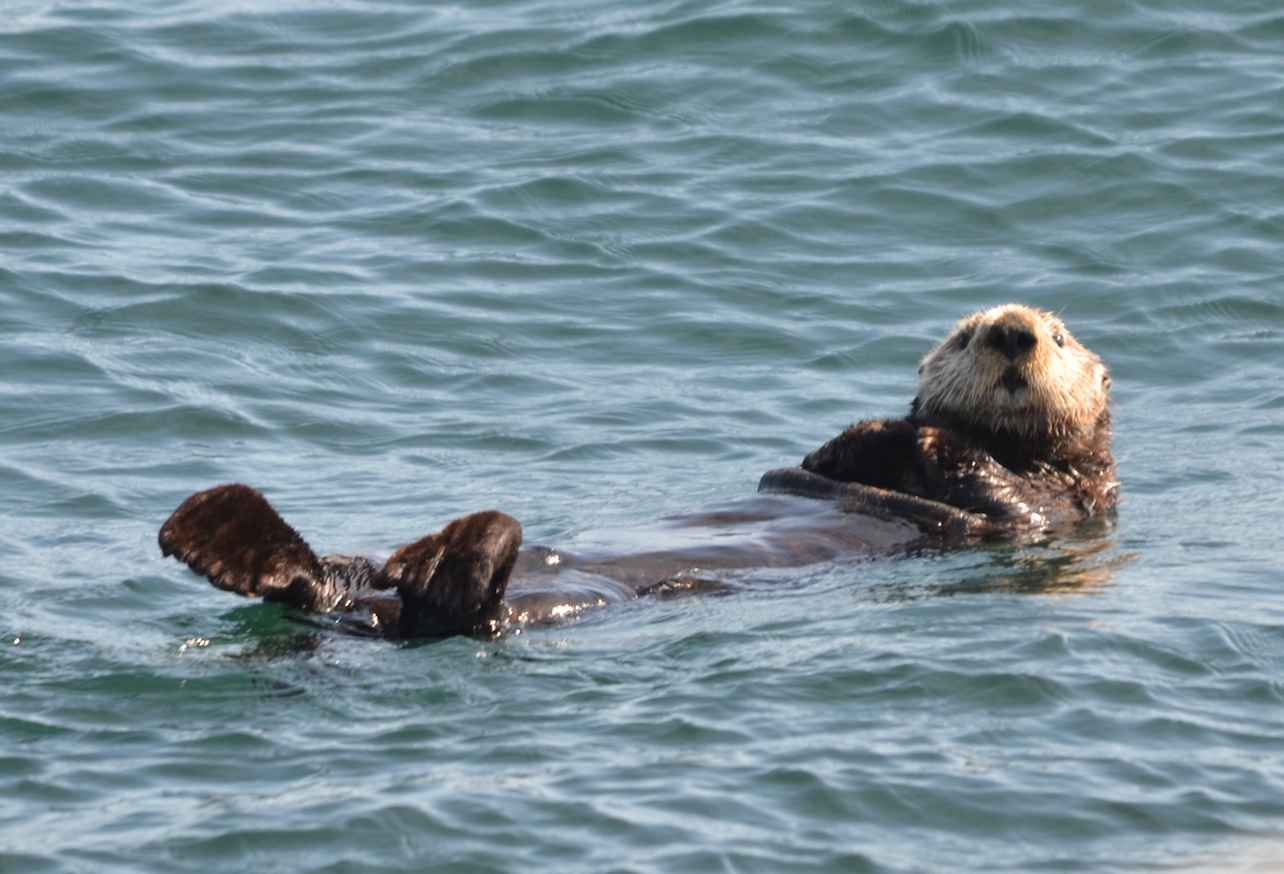
41b Small: always in the water,often  lies in kelp beds on back sea otter

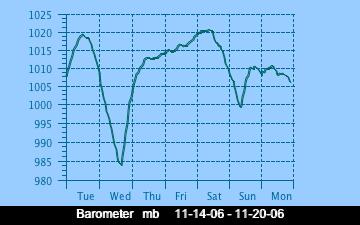
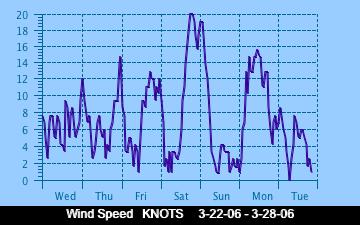
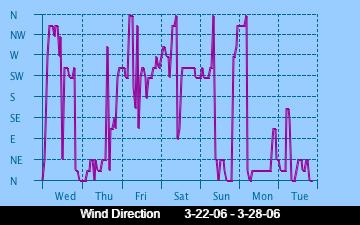
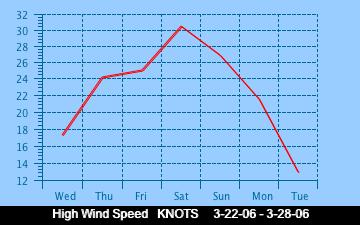
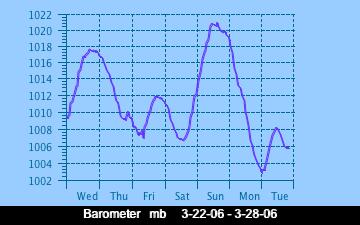
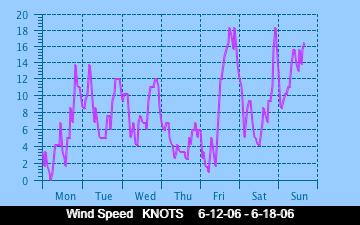
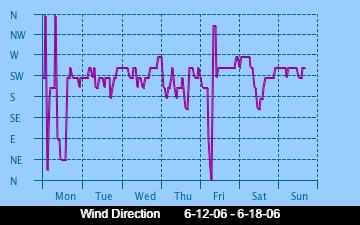
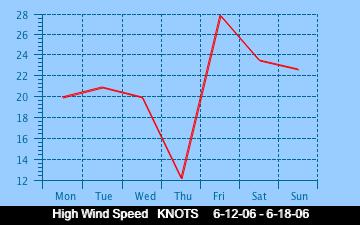
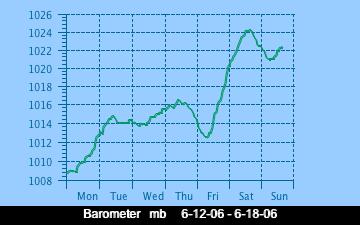
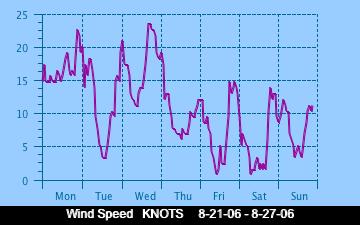
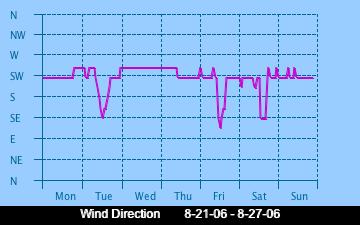
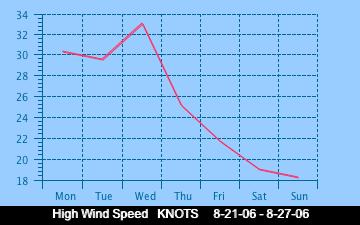
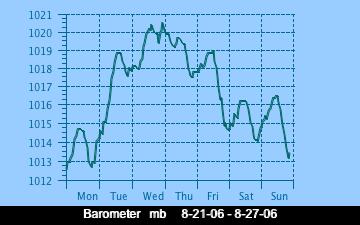
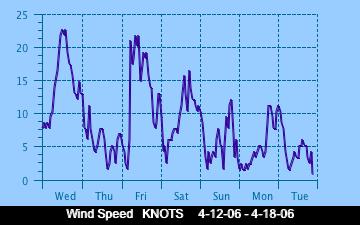
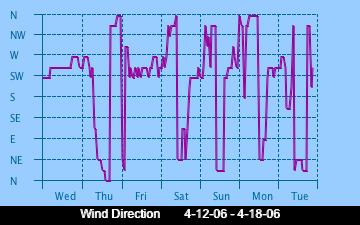
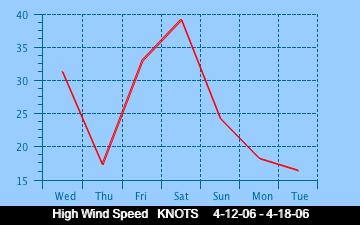
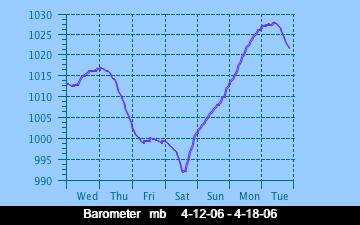
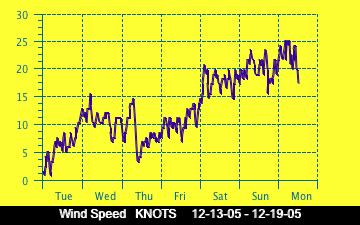
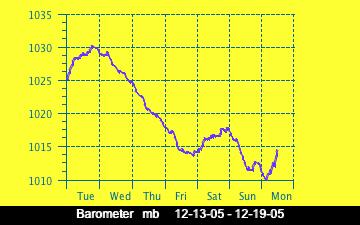
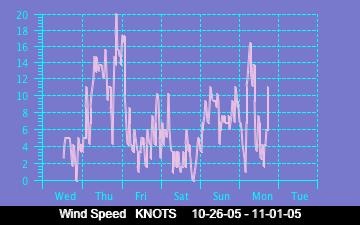
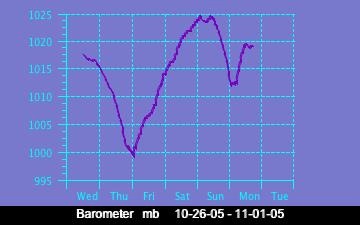
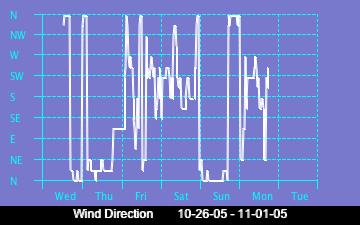
Correlation : Wind and Barometric Pressure Relationships

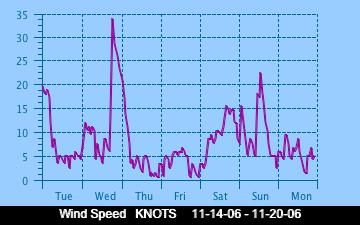
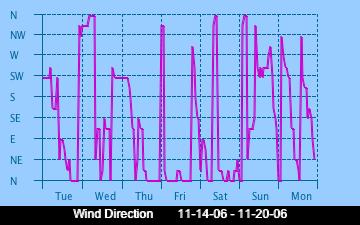
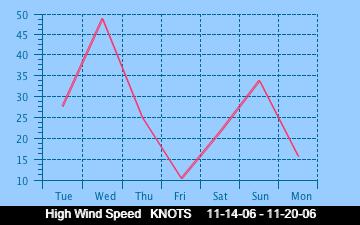
Below are presented some of the historical graphs of wind direction, wind speed and barometric pressure as recorded on the weather station at Race Rocks. . Several interesting problems can be posed from which one could form some hypotheses using these data. Make a similar comparison with the current week’s graphs.

Note: you may find some variations in patterns in the summer.

Temperature Changes Through Time


BACKGROUND: With so much information in the media about Climate Change, it is important to be able to sort out and analyze the evidence first hand. From 1921 until the present, records of temperature of the sea water have been taken daily at Race Rocks. The question is, do we have evidence of an increase in ocean temperature over this time period?
OBJECTIVES: After doing this assignments, you will be able to:
a) Comment on the importance of maintaining a database of environmental factors over time.b) Compare the monthly temperature averages for the decade of the 1920’s with the last decade c) Examine data temperature records and determine if there is evidence of a change through time..d) Evaluate temperature change through time as an abiotic factor that affects the biodiversity of organisms in an ecosystem.e) Account for the geoclimatic reasons for similarities and differences of water temperatures, and indicate the implications for organisms living in these ecosystems.

PROCEDURE: 1. Describe how this set of sea-water temperature records have been obtained. This file provides examples of the records which have been submitted to The Institute of Ocean Sciences at Sidney, Vancouver Island.

The students from Lester Pearson College often stay at the island and take over the daily duties such as the water sampling for temperature and salinity. This video shows the process used in the manual determination of these factors.

When the records have been submitted, they are added to a database which is maintained by the Institute of Ocean Sciences. This link shows historic sets of raw data from IOS for the British Columbia Light Stations.
 Seawater temperature and salinity observations in the past few years:
See

2. Go to this file to obtain the Race Rocks Mean Monthly Sea Temperature 1921-present,a) open an excel workbook and save it as “Temperature records at Race Rocks. We will copy the data for the first ten years of the record and the last ten years of the record to an empty Excel file.

b) Highlight years 1921 to 1930 from the data, copy and paste to the open Excel file.

c) Cut out each year and paste it side by side so that you have the rows representing the months and the columns representing the years. Make a horizontal table of the data

d) highlight across the able, the temperatures for each month of the ten year group. Then click on the symbol in the menu line which produces an average. This average will appear to the right of the last years column.

e) Do the same with the last ten years set of data. You now have two sets of averages by month of the two decades.

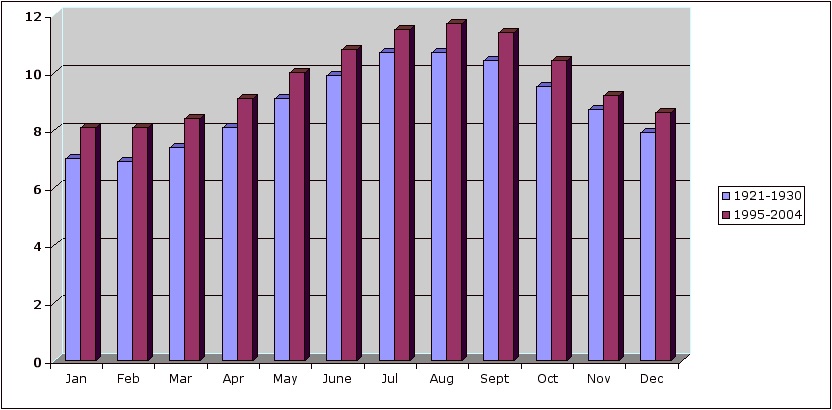
f) Compare the monthly averages for the two decades. What do you find?

3. There are of course many ways of looking at this data. Try summing the total averages for each decade. Simply highlight the column of averages and click on the tool for SUM. What is your finding.4. You could also do the same for all the decades.Once you have a chart made up of the monthly averages of all the decades, It is easy to have Excel draw a graph for you. Click on the Wizard symbol and choose the type of graph.

5. After manipulating the data, and looking at it in several ways, write a statement which expresses your understanding of the whether or not there has been a temperature change in the Strait of Juan de Fuca as measured by daily samples taken at Race Rocks. Be sure that you do not generalize beyond the evidence provided by your data. Also discuss the assumptions that you must recognize before drawing a conclusion from this data.

6. For Extension work: Run a statistical program to determine if the difference you find is significant.

7. For Extension work: Read the review below and if possible, read the book! Present a summary to your class. The long-term Sea temperature record at Race Rocks has been pointed out as one of the pieces of evidence that has accumulated on global warming. Author Terry Glavin, in reviewing the book The Weather Makers by Tim Flannery ( Harper Collins Publishers, 2006) says :

” The Pacific Ocean itself is getting warmer. Measurements at the Race Rocks lighthouse near Victoria show an average rise in temperature of 1°C since 1921, which doesn’t sound like much until you remember that its only 10°C in the other direction that separates us from the deep freeze of the Ice Age. The ocean, absorbing increasing volumes of carbon dioxide, is becoming more acidic, too, inhibiting the production of plankton, the basis of all life in the sea.”

The rest of the article may be seen at http://www.straight.com/content.cfm?id=17132

8. Refer to the file: Sea Temperature as an abiotic factor . Several ideas are discussed in this file about how the sea water temperature affects marine organisms. Discuss how organisms adapt to changes in sea temperature.
9. Extension: Find out the monthly water temperature averages from your own area. Compare them with Race Rocks and discuss the geoclimatic factors which lead to the similarities and or the differences, and the implications for organisms living in the two ecosystems.

See also https://racerocks.ca/category/education/climate-change/

Sea Water Temperatures at Race Rocks

From
1921 until 1997 daily records of Seawater Temperature and
Salinity were manually taken at Race Rocks by the Lightkeepers and assistants. In 1997 the station was automated and Lester Pearson College took over the hiring of the Lightkeeper Mike Slater and his wife Carol as Guardians for the Ecological Reserve / Marine Protected Area. They  maintained the daily sea temp and salinity records until their retirement in 2009. The records have been submitted monthly to the Institute of Ocean Sciences, thus continuing this important long term record.

See the Decade Comparisons:Sea Surface Temperature at Race Rocks- 1921-1930 and 1995-2005


The students from Lester Pearson College often stayed at the island and took over the daily duties such as the water sampling for temperature and salinity. The following is their introduction to the video:During our project week at Race Rocks, Mike Slater, the Race Rocks Marine Protected Area Guardian asked us if we could make a video explaining the daily duties necessary to maintain the facility. Students who are relieving on the island during Mike’s absence will be able to use this data as a guide for performing their duties, as well as providing a useful information resource for students visiting the island. These duties include two daily engine checks, a salinity check one hour before high tide, and keeping a record of the days weather, as well as explaining the functions and instructions for testing machinery located on the island.


Garry gives a good demonstration of when one should avoid taking seawater temperatures!~ (Photo by Barry Herring Feb 2009)


SEA TEMPERATURE 1921 to 2008

Also
see historic sets of raw data from IOS for the British
Columbia Light Stations

http://www.pac.dfo-mpo.gc.ca/science/oceans/data-donnees/lighthouses-phares/data/racerockday.txt

Observations of Seawater Temperature and Salinity at British Columbia Shore Stations, 1983. F. Glovando 1985

Refer
to the File “Temperature Changes Through Time for an
Educational exercise on Sea water Temperature changes.


OCEAN
WARMING:
The
long-term Sea temperature record at Race Rocks has
been pointed out as one of the pieces of evidence that has
accumulated on global warming. Terry Glavin, in reviewing
the book The Weather Makers by Tim
Flannery
( Harper Collins Publishers, 2006) says
:

The Pacific Ocean itself is getting warmer.
Measurements at the Race Rocks lighthouse near
Victoria show an average rise in temperature of 1°C
since 1921, which doesn’t sound like much until you
remember that its only 10°C in the other direction
that separates us from the deep freeze of the Ice Age.
The ocean, absorbing increasing volumes of carbon
dioxide, is becoming more acidic too, inhibiting the
production of plankton, the basis of all life in the
sea.”
The
rest of the article may be seen at
http://www.straight.com/content.cfm?id=17132
See this file for our own analysis which supports this statement:

page 21
State
of the Pacific Ocean 2005
context.http://www.pac.dfo-mpo.gc.ca/sci/psarc/OSRs/StateofOceans2005fnl.pdf
Two
references are made to Race Rocks Sea Temperature
data. page 6 and page 31
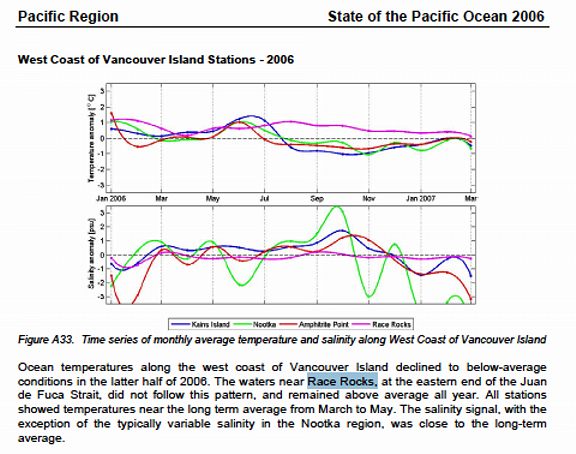
State
of the Pacific Ocean , 2006

state of the pacific ocean 2006,
page 36 ” Ocean
Temperatures along the west coast of Vancouver island
declined to below average conditions in the latter half
of 2006. The waters of race Rocks …did not follow this
pattern, and remained above average all year.”
RESPONSE
OF ORGANISMS TO SEAWATER TEMPERATURES:
The
seawater in the Strait of Juan de Fuca has a very narrow
variation in temperature range. It is important to
understand about Heat Capacity, as it is partly due to
this ability of water to warm up slowly and cool off
slowly that the climate of Vancouver Island and the lower
mainland of British Columbia has the mildest weather in
Canada.
Heat
capacity is the ratio of the heat energy absorbed to the
rise in temperature. Objects with high heat capacity, such
as water, require a great amount of heat energy to change
temperature. Materials with low heat capacities, such as
air, easily change temperature with small amounts of heat
energy.

These
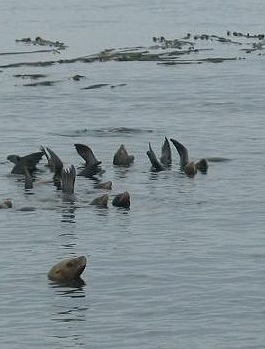
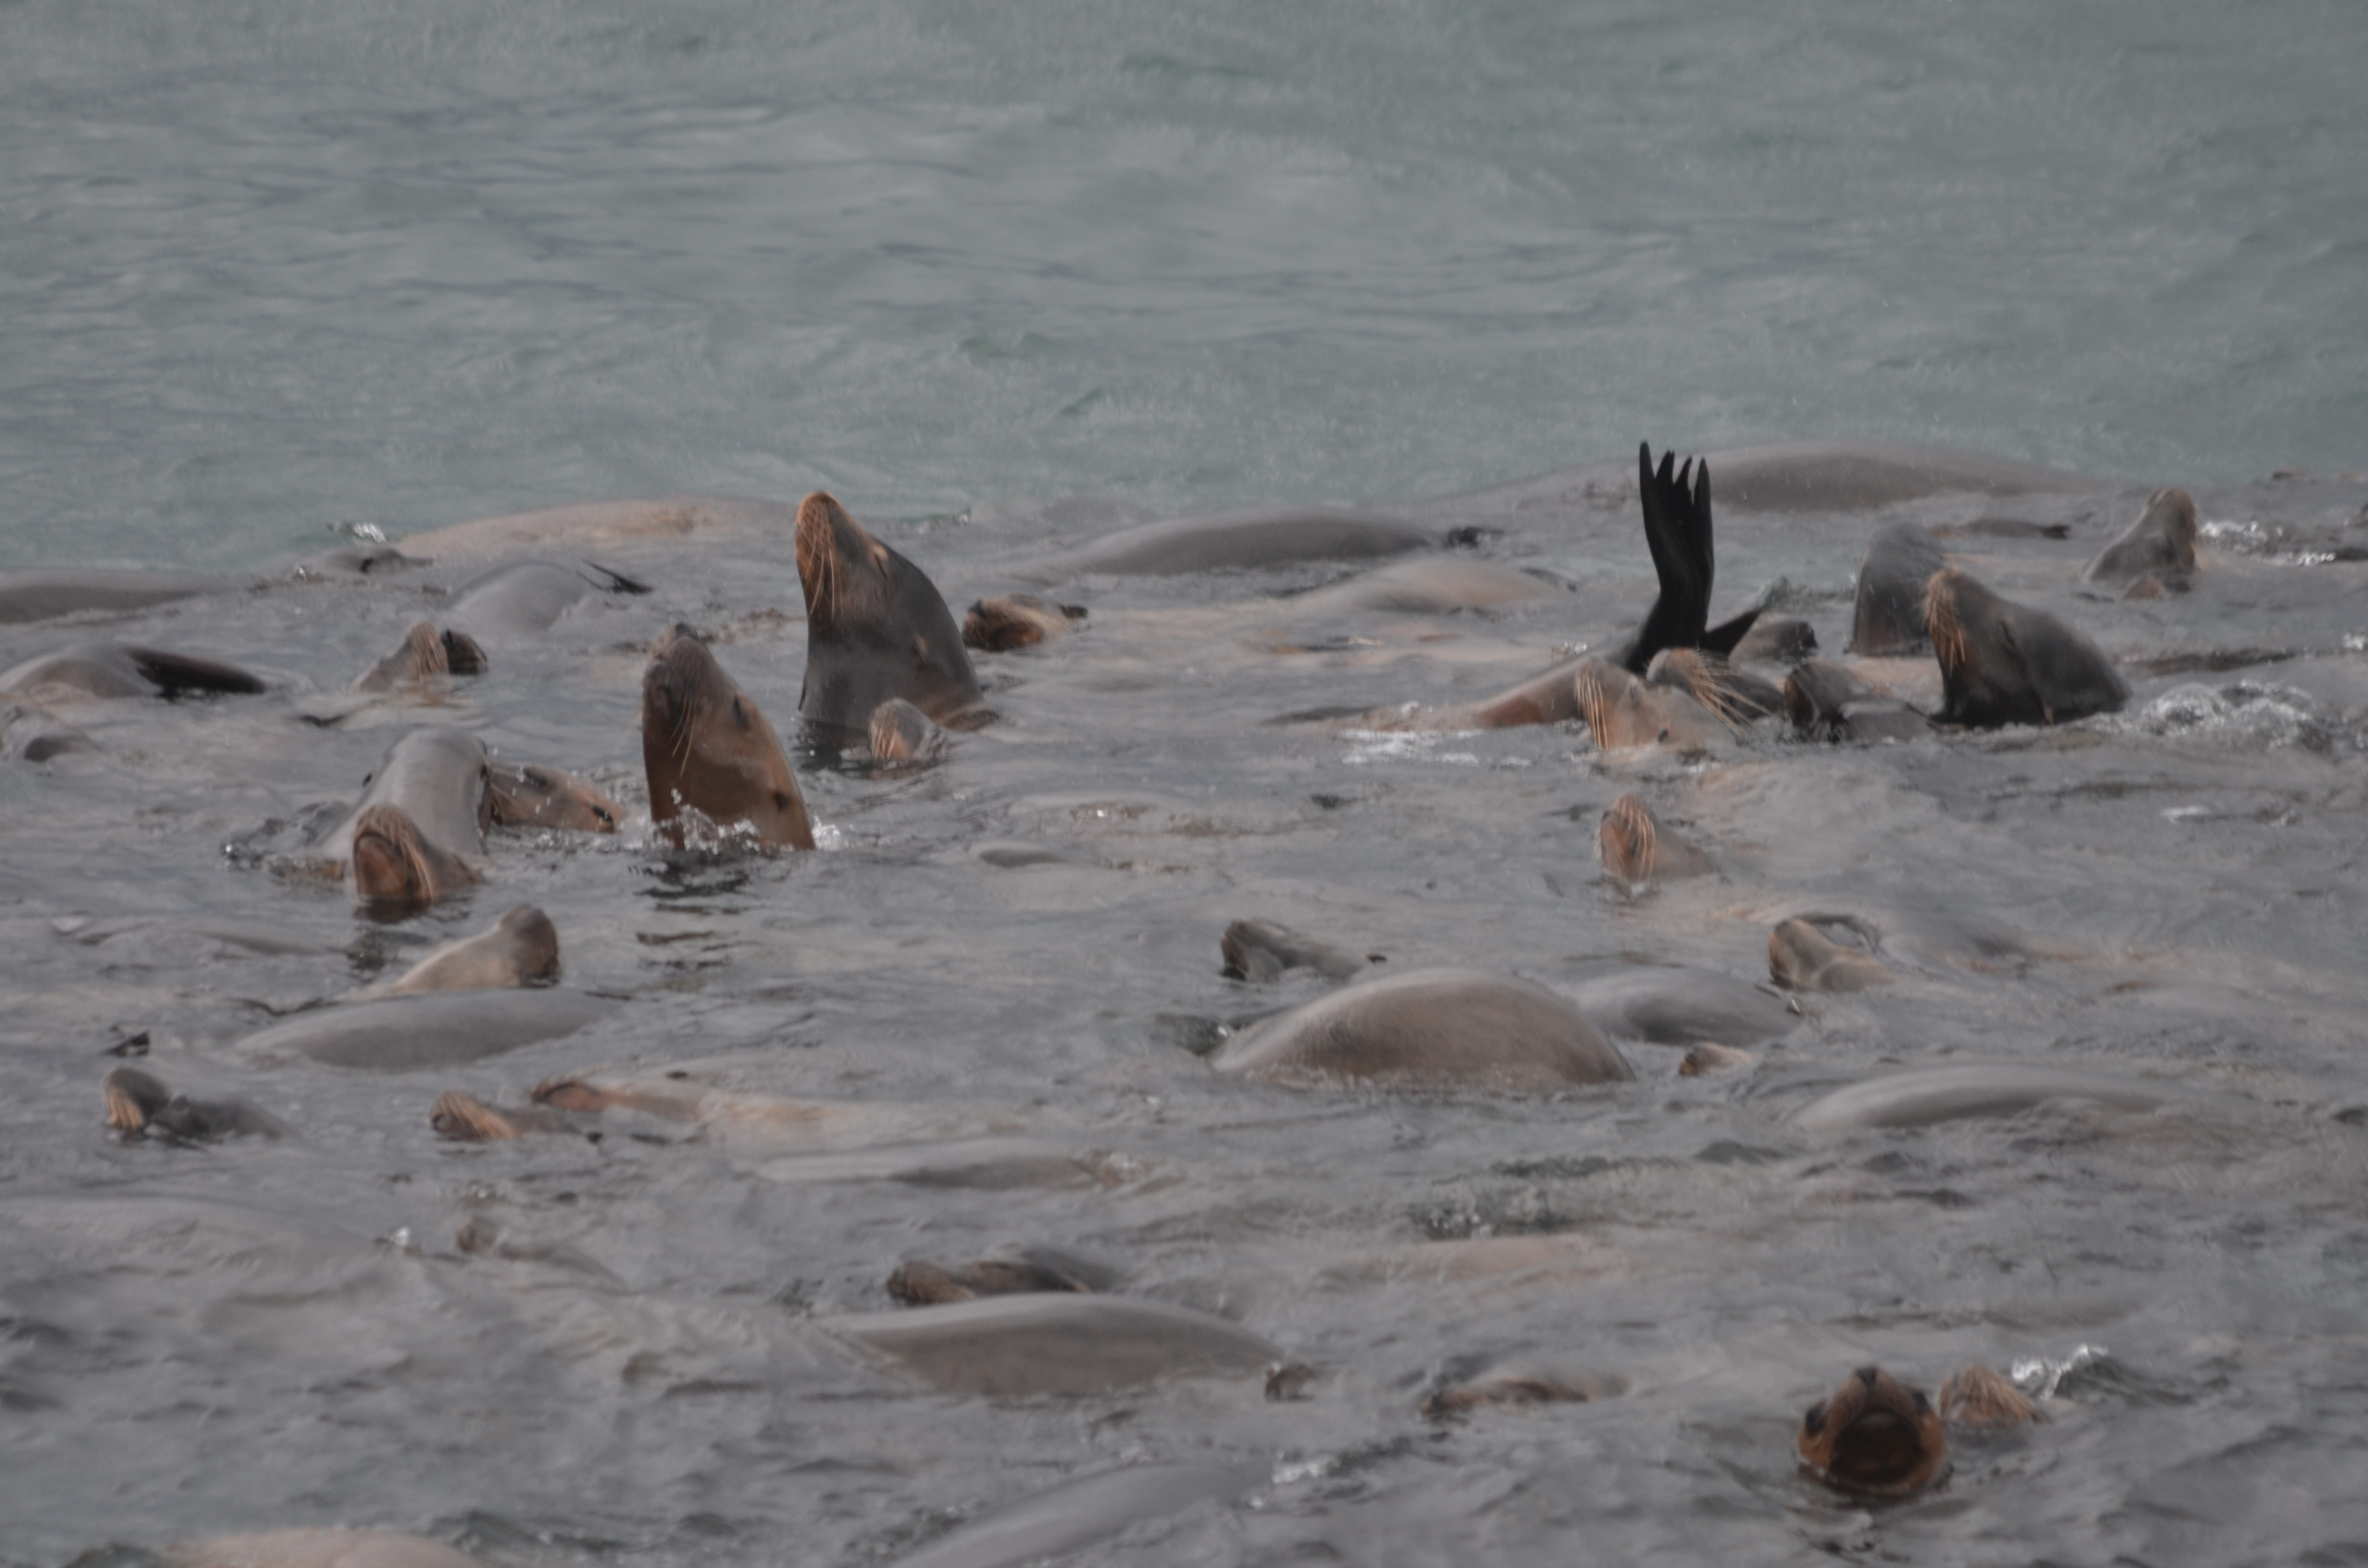
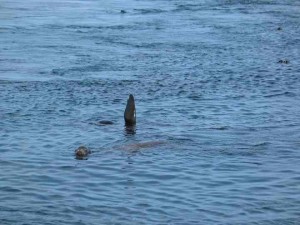
photos are from the California sea lion page. They demonstrate one of the forms of heat exchange used by the sea lions atRace Rocks. Their flippers are filled with blood vessels, so this behaviour allows heat exchange with the atmosphere.

Heat
Capacity is also sensitive to the size of the object
(for example, a bathtub of water has more heat capacity
than a cup of water). Therefore we can expect the
greatest variation in temperatures to occur at Race
Rocks in the tidepools.

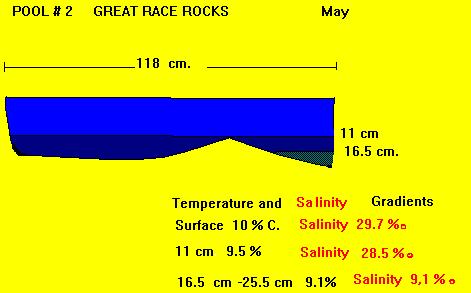
This file shows one example of measurements taken on
tidepools. It illustrates this idea of size of the object and it also helps explain why our tidepools
have different biodiversity depending on the temperature variations of the pools.

Other ideas to be developed here:
1.Temperature stratification in tidepools and
distribution of organisms.

2.
Temperature stratification in the ocean. The importance
of the thermocline in determining marine-life zones.

3.
The relationship of temperature of water to its ability
to absorb the gases oxygen and carbon dioxide. (An
inverse relationship which has significant implications
for where organisms can live.)

4.
Birds and mammals have adaptation for cold temperatures,
e.g. Insulation, activity levels and counter-current
arterial circulation


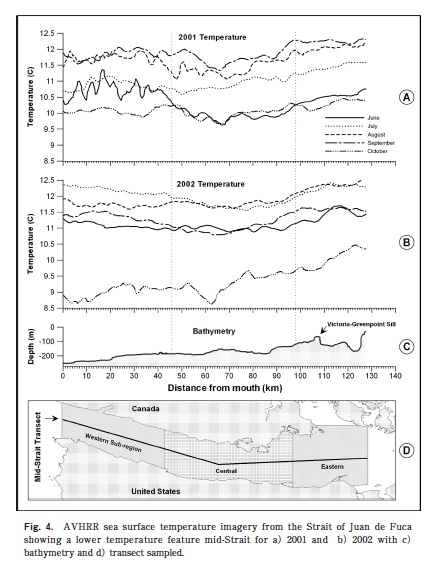
Dr.
Kate Edwards of the University of Washington School of
Oceanography is doing research on the sea temperatures
of the Strait of Juan de Fuca. (click on image to left).
She maintains web pages at:
Strait of Juan de Fuca page:
http://www.ocean.washington.edu/~kate
West Coast headlands page:
http://www-ccs.ucsd.edu/~kate
Jan Newton is at the Washington state Department of Ecology and is interested in how the Straits affect Puget Sound.
She has organized the “Joint Effort to Monitor the
Straits,” which regularly sample the three stations south
of San Juan Island in the map at http://www.ecy.wa.gov/apps/eap/marinewq/mwdataset.asp
.

Click on the Station Group Puget Sound, and the Selected
Station – Juan de Fuca.

This
paper references Strait of Juan de Fuca Temperatures


Educational Exercises Using Data From Race Rocks – Excel and
Statistics