Seawater Temperature and Salinity January, 2015

Station: Race Rocks Lightstation, Observer Lester B. Pearson College of the Pacific

Date Time Sea Jar Hydro- meter No. Observed Density YSI Salinity YSI Temp °C
Temp. Temp.
°C °C
1 10:40 8 8 10802 232 30.3 8.5
2 11:00         30.0 8.7
3 11:30         30.1 8.7
4 11:45         30.0 8.9
5 11:00         30.2 8.9
6 12:45         30.2 9.0
7 14:00         28.4 8.9
8 14:00         29.9 8.9
9 8:00         30.1 8.9
10 8:00         30.3 8.9
11 8:00            
12 8:00         30.3 8.8
13 9:00         30.0 8.8
14 8:50         30.2 8.6
15 9:10         29.8 8.5
16 10:00         29.7 8.8
17 10:00         29.8 8.8
18 10:30         30.0 8.7
19 11:20         30.3 8.8
20 13:00  8.6   8.75   238    
21 13:00         30.4 8.7
22 14:30         30.4 8.9
23 17:20         30.6 8.9
24 17:00         30.4 9.0
25 17:30 9.1 9.5   242    
26 7:30         29.8 8.9
27 10:00         28.5 8.8
28 9:00         29.8 9.0
29 9:30         30.4 8.8
30 10:00         30.4 8.7
31 11:00         30.6 8.8
mean
             
   
Recorded by Race Rocks Ecological Reserve Guardian for Lester B. Pearson College

Continue reading

Seawater Data for November 2014

Station: Race Rocks  Ecological Reserve —–November, 2014,
Recorded daily by the Race Rocks Ecological Reserve Ecoguardian on behalf of Pearson College UWC
Submitted monthly to: Peter Chandler, Institute of Ocean Sciences, Sidney, BC.
This file may be copied and pasted into a spreadsheet for further analysis. Find other monthly records here:

Date Time Sea Jar Hydro- meter No. Observed Density YSI Salinity YSI Temp °C
Temp. Temp.
°C °C
1 10:53         31.1 11.2
2 10:12         30.8 11.2
3 10:40         30.9 11.1
4 11:10         30.9 11.0
5 11:42         30.0 11.1
6 12:13         30.9 11.1
7 12:41         28.7 11.1
8 12:30         30.9 11.0
9 12:36         31.0 10.9
10 12:54         30.9 10.9
11 13:12         29.7 10.7
12 9:07         30.8 10.4
13 9:25         30.8 10.2
14 10:31         30.5 9.9
15 10:36         30.0 9.7
16 10:47         30.6 9.5
17 10:01 9.6 9.5 10802 236 30.6 9.7
18 10:20         30.4 9.7
19 10:40         29.5 9.7
20 11:01         29.9 9.8
21 11:12         30.2 9.7
22 11:04         30.2 9.7
23 11:23         30.5 9.5
24 11:57         30.8 9.5
25 12:37         30.1 9.5
26 13:21         31.0 9.5
27 8:28         31.1 9.5
28 8:26         31.0 9.4
29 8:25         31.1 9.0
30 8:49         31.1 8.9
Mean*           30.5 10.1

Harlequin Ducks

The barometer continued to drop from 1018 hPa overnight to 1009 hPa this evening.  Throughout the day the wind hovered around 14 knots from the northeast.  The sea was fairly calm.

There were two whale watching boats seen in the reserve today.

Four harlequin ducks were swimming near the end of the jetty this morning, when I was testing the salinity of the water.

October 2014 Seawater Data

Station: Race Rocks  Ecological Reserve —–October, 2014,
Recorded daily by the Race Rocks Ecological Reserve Ecoguardian on behalf of Pearson College UWC
Submitted monthly to: Peter Chandler, Institute of Ocean Sciences, Sidney, BC.
This file may be copied and pasted into a spreadsheet for further analysis. Find other monthly records here:

Date Time Sea Jar Hydro- meter No. Observed Density YSI Salinity YSI Temp °C
Temp. Temp.
°C °C
1 18:26         30.1 11.0
2 13:36         31.7 11.0
3 13:36         31.5 11.5
4 13:21         31.4 10.9
5 13:37         31.4 11.1
6 13:14         31.3 10.8
7 13:36         31.5 10.3
8 14:16         31.6 10.1
9 14:42         31.4 10.2
10 15:16         31.7 10.0
11 15:47         31.3 10.2
12 16:14         31.3 10.2
13 15:58         31.3 10.2
14 10:53         31.4 10.1
15 11:38         31.2 10.2
16 12:03         31.3 10.4
17 12:08         31.3 10.2
18 12:12         31.3 10.4
19 12:37 11.8 11.8 10802 240 31.2 11.3
20 12:38         31.3 11.1
21 12:55         31.0 10.7
22 13:24         31.2 10.4
23 13:39         31.0 10.7
24 14:01         30.4 12.7
25 14:07         30.9 11.8
26 13:37         31.2 10.6
27 14:04         31.2 10.7
28 14:44         31.9 10.9
29 15:31         31.2 10.9
30 10:50         31.2 11.2
31 10:55         31.1 11.3
Mean*           31.3 10.7

February 2014 Seawater Data

Recorded by Race Rocks Ecological Reserve Guardian on behalf of Lester B. Pearson College

Daily Seawater Temperature and Density Record Shore Station
Time Zone: PST
Station Race  Rocks  Light station
Month: February Year: 2014
Observer: Lester B. Pearson  College  of  the  Pacific
Date Time Sea
Temp.
°C
Jar
Temp.
°C
Hydro-  meter   No. Observed Density YSI Salinity YSI Temp °C
1 1400 31.8 7.7
2 700 7.6 7.7 1.0249 31.5 7.7
3 1430 32.4 7.1 Continue reading

Race Rocks Mean Monthly Sea Temperature 1921-present,

Seawater Temperature: Race Rocks
Decade Comparisons:Sea Surface Temperature at Race Rocks-
 

Year Jan Feb Mar Apr May Jun Jul Aug Sep Oct Nov Dec
1921 7.1 7.3 7.7 8.5 9.5 10.3 10.5 10.3 9.8 9.1 8.2
1922 6.4 6.1 6.6 7.5 8.3 9.5 10.5 10.3 10.2 9.3 8.4 7.1
1923 7.1 6.4 6.7 7.6 8.6 9.3 10.3 10.5 10.6 9.6 8.7 7.9
1924 7.1 7.3 7.7 7.9 9 9.8 10.5 10.3 10.2 9.2 8.8 7.3
1925 6.6 6.9 7.3 8 9.2 10.1 11.1 10.8 10.2 9.2 8.3 8.2
1926 7.8 8 8.6 9.2 10.1 10.7 11.1 10.9 10.5 9.8 9.1 8.5
1927 7.6 7.4 7.8 8 8.8 9.8 10.5 10.9 10.3 9.7 8.6 7.6
1928 6.9 7.3 7.8 8.6 9.7 10.2 10.8 10.9 10.3 9.2 8.6 7.9
1929 7.1 6.3 7.1 7.8 9 9.8 10.8 10.8 10.7 9.8 8.8 7.8
1930 6.5 6.6 7.1 8.2 9.3 10 10.6 10.8 10.6 9.4 8.6 8
1931 7.8 7.8 8.2 8.8 9.9 10.6 11.5 11.1 10.7 9.6 8.6 7.7
1932 7.1 6.8 7.3 8.2 9.3 10.4 10.8 10.9 10.7 9.6 8.9 7.7
1933 7.1 6.7 7.1 8 9.1 10.2 10.5 11.5 10.1 9.6 8.6 7.7
1934 7.8 7.9 8.3 9.2 10 10.8 10.9 11.6 10.7 9.7 9.2 8.4
1935 7.2 7.2 7.5 7.8 9.2 10.1 10.5 10.5 10.7 9.7 8.2 8.1
1936 7.9 6.7 7 7.8 9.3 10.4 11.3 11.3 10.5 10.1 8.6 7.9
1937 6.6 6.4 7.7 8.7 9.9 10.9 11.7 11.5 10.9 9.9 8.5 8.1
1938 7.4 7.2 8.1 9.4 10.6 12.3 12.7 11.9 11 9.9 8.6 7.5
1939 7.4 6.6 7.1 8.6 10.3 11.4 12.2 11.1 11.4 9.7 8.5
1940 7.9 8.2 9 10 11.4 11.6
1941 10 10.5 11.2 11 10.6 9.9 9 8.5
1942 7.9 7.9 7.8 8.5 9.6 9.8 10.5 11 10.3 9.5 8.4 7.9
1943 6.8 6.7 7.1 8.2 8.8 10 10.3 10.6 10.3 9.6 9 8.1
1944 7.7 7.5 7.3 8 9.2 10.5 11 10.9 10.5 9.6 9.2 8.1
1945 7.8 7.7 7.6 8 8.8 9.8 10.1 10.5 10 9.5 8.1 8.1
1946 7.7 7.3 7.7 8.1 9.4 10.2 10.7 10.8 10.3 9.4 8.1 7.7
1947 7.1 7 7.7 8.4 9.5 10.4 10.6 10.9 10.5 9.9 9.1 7.9
1948 7.5 6.9 7.2 7.9 9 10.2 10.8 10.7 10.4 9.5 8.2 7
1949 6.1 6.1 6.9 8.3 9.4 10.1 10.3 10.2 10.5 9.5 8.7 7.8
1950 6.2 5.8 6.6 7.7 8.7 9.4 10.1 10.4 10.3 9.3 8.5 8
1951 7.5 6.9 6.7 8.1 9.2 10.2 10.4 11.1 10.9 9.5 8.5 7.7
1952 6.9 7.1 7.6 8.2 9 9.6 10.4 10.5 10.2 9.8 8.6 7.9
1953 7.8 7.9 7.6 8.1 9.3 9.8 10.6 11 10.6 9.9 9.3 8.5
1954 7.1 7.3 7.5 7.9 8.7 9.3 9.9 10 10 9.4 9.1 8.4
1955 7.5 7.1 6.7 7.5 8.4 9.3 9.8 10.2 10 8.9 7.5 6.6
1956 6.7 6.4 6.3 7.6 8.7 9.6 10.2 10.4 10.1 9.2 8.1 7.1
1957 6.3 6.2 7.2 8.1 9.3 10 10.3 10.5 10.5 9.8 8.8 8.3
1958 8 8.3 8.6 9.3 10.3 10.7 11.5 11.5 11 9.9 8.7 8.1
1959 7.6 7.4 7.9 9.1 9.7 10.4 11.3 11 10.4 9.7 8.3 7.8
1960 7.1 7.5 7.5 8.6 9.6 10.3 11.4 10.8 10.1 9.5 8.6 7.9
1961 7.9 8.2 8.4 8.8 9.4 10.3 10.9 11.3 10.6 9.4 8.2 7.5
1962 7.2 7.3 7.3 8.4 9.3 10 10.4 10.5 10.5 10 9.3 8.7
1963 7.5 7.5 7.8 8.5 9.6 10.2 10.5 10.8 10.6 10.3 9.9 8.7
1964 8.2 7.9 7.7 8.2 8.8 9.6 10.3 10.5 10 9.4 8.3 7.4
1965 6.9 7.1 7.2 8 8.8 9.8 10 10.2 10.3 9.7 9.2 8.5
1966 7.7 7.6 7.7 8.5 9 9.1 99.9 10.7 10.1 9.5 8.7 8.6
1967 7.9 7.7 7.6 8.1 8.9 9.6 10.3 10.5 10.5 9.7 9.1 8
1968 7.3 7.3 8 8.3 8.7 9.5 10.2 10.2 10.4 9.3 8.8 7.8
1969 6.5 6.3 7.2 8.1 9.1 10.2 10.4 10.5 9.8 9.2 8.7 8.1
1970 7.5 7.7 7.9 8 8.7 9.6 10.2 10.2 10 9 8.3 7.5
1971 7 6.9 6.7 7.5 8.5 9.1 10 10.6 10.4 9.3 8.3 7.3
1972 6.4 6.2 6.9 7.6 8.8 9.5 10.5 10.6 10.2 9.1 8.4 7.3
1973 7 7.2 7.9 8.4 8.6 9.2 10.1 10.3 10 9.2 8.2 8
1974 7.2 7.2 7.3 8.1 8.5 9.7 10 10.9 10.6 9.7 8.6 8.2
1975 7.3 6.8 7.2 7.7 8.7 9.4 10.2 10.4 10.4 9.6 9.2 7.8
1976 7.2 7 7 7.8 8.7 9.3 10.1 10.1 10 9.4 8.6 8.1
1977 7.6 7.9 8 8.3 8.8 9.7 9.9 10.8 10.3 9.2 8.6 7.9
1978 7.6 7.9 8.3 8.9 9.4 10.3 10.4 10.9 10.5 9.8 8.2 7.3
1979 6.5 6.9 7.5 8.3 9.5 10 10.8 10.7 10.5 9.8 9 8.6
1980 7.7 7.6 7.9 8.6 9.5 9.5 10.6 10.9 10.5 9.9 9.2 8.6
1981 8.3 8.3 8.8 9.2 9.4 9.9 10.3 10.5 10.2 9.7 9.3 8.5
1982 7.2 7.5 8 8.8 9.9 10.7 11.4 11.8 11.4 10.3 8.8 8.3
1983 8.6 8.6 9.3 10 10.6 11.3 11.7 12.4 11.4 10.3 9.5 7.7
1984 7.5 7.8 8.4 9 9.7 10.3 11.4 11.6 10.6 9.7 8.5 6.9
1985 6.8 6.8 7.2 8.2 9.6 10.6 11.5 11.6 10.8 9.6 6.8 6.4
1986 7 6.6 8 8.4 9.4 11 10.9 11.8 10.8 9.8 8.4 7.8
1987 7.6 7.9 8.3 8.9 9.8 10.6 11.1 11.5 11.1 10 9 8.2
1988 7.4 7.5 7.5 8.6 9.6 10.4 11 11.4 10.6 9.6 8.7 7.9
1989 7 5.8 6.8 8.2 9.5 10.7 11.3 11.2 11 9.9 8.9 8.2
1990 8.1 7.7 8.2 9 9.9 10.8 11.8 12.1 12.1 10.7 9.9 8.2
1991 7.1 7.7 7.9 8.4 9.7 9.7 10.8 11 11.2 10.1 8.9 8.3
1992 7.9 8.1 9.5 9.5 10.2 10.7 11.1 11.4 11 10 9.1 7.8
1993 6.7 6.7 7.6 8.6 9.7 10.8 11 11.2 11 10.1 8.5 7.9
1994 8 7.4 8.6 9.3 10.1 10.6 11.6 11.5 11.3 10.7 9.3 8.4
1995 8.2 8.6 8.8 9.2 10.2 11.2 11.8 11.5 11.3 10.2 9.4 8.9
1996 8.2 7.8 8.4 9.2 10 10.4 11.5 11.5 10.5 9.9 8.7 7.6
1997 7.7 7.9 8.1 9 10.3 10.9 11.7 12.2 11.6 11.3 9.9 9.3
1998 8.7 9.2 9.7 9.9 10.4 11.4 11.7 12.3 12.1 10.7 9.8 9
1999 8 7.8 8.1 8.9 9.5 10.4 11.1 11.5 11.9 10.1 9 8.5
2000 7.5 7.7 8.1 9.1 10 11.1 11.3 11.7 11.4 10.3 9 8
2001 7.9 7.7 8.1 8.7 9.7 10.6 11.3 11.4 11.4 10.2 9.2 8.3
2002 8.1 7.9 7.7 8.7 9.4 10.5 11,2 11.7 11.3 10.0 9.0 8.8
2003 8.8 8.5 8.7 9.2 9.9 10.9 11.3 11.4 11.4 10.9 9.0 8.5
2004 7.8 7.9 8.3 9.1 10.4 11.0 11.8 11.9 11.2 10.6 9.4 8.6
2005 7.7 8.0 8.8 9.4 10.7 11.2 11.6 12.1 11.5 10.4 9.5 8.3
2006 8.61 8.49 8.41 8.75 10.08 10.86 11.66 12.09 11.49 10.55 9.29 8.5
2007 7.8 7.9 7.9 9.0 10.0 10.2 11.2 11.6 11.0 10.0 9.0 8.0
2008 7.46 7.33 7.68 8.06 9.36 9.77 10.84 11.30 11.16 10.14 9.39 7.87
2009 7.29 7.20 7.5 8.4 9.54 10.4 11.4 11.74 11.8 10.5 9.0 7.0
2010 8.11 8.68 9.12 8.96 9.54 10.36 11.16 11.93 11.08 10.37 8.98 8.5
2011 7.8
2012
2013
2014
2016
2017
2018
2019
2020
2021
2022
2023


Note, The blanks for the years 1940-41 are due to the Second World War. Apparently during that time, data was not collected by a lightkeeper.

Original data was sent by the Lightkeepers and now by the Marine Protected Area Guardian of Race Rocks to the Institute of Ocean Sciences where it is compiled and displayed at

http://www.pac.dfo-mpo.gc.ca/science/oceans/data-donnees/lighthouses-phares/index-eng.htm

Decade Average GraphDecade analysis by G. Fletcher.. NOTE probable evidence of climate change


Seawater Salinity and Temperature November 2008

Daily Seawater Temperature and Density Record Shore Station

Observer Lester B. Pearson College of the Pacific,
Month NOVEMBER 2008,Time Zone P.S.T

 Date:
November:
temp °C °tempC Jar Temp °C Hydro- meter No. Observer Reduced *Corrected *Salinity
1 11:57 9.6 9.4 10,802 1.0242 1.0233 1
2 11:17 9.6 9.5 10,802 1.0242 1.0233 1
3 10:50 9.6 9.5 10,802 1.0241 1.0232 1
4 10:41 9.7 9.5 10,802 1.024 1.0231 1
5 10:42 9.6 9.4 10,802 1.024 1.0231 1
6 10:48 9.8 9.5 10,802 1.0237 1.0228 1
7 10:44 9.8 9.4 10,802 1.0236 1.0227 1
8 19:31 9.8 9.4 10,802 1.024 1.0231 1
9 10:34 9.7 9.5 10,802 1.0242 1.0233 1
10 10:48 9.8 9.5 10,802 1.024 1.0231 1
11 11:05 9.7 9.5 10,802 1.024 1.0231 1
12 4:19 9.7 9.4 10,802 1.0241 1.0232 1
13 5:24 9.6 9.4 10,802 1.0241 1.0232 1
14 6:22 9.5 9.3 10,802 1.0239 1.023 1
15 7:18 9.2 9 10,802 1.0242 1.0232 1
16 8:13 9.4 9.2 10,802 1.0242 1.0232 1
17 8:49 9.5 9.1 10,802 1.0244 1.0234 1
18 9:21 9.2 9.1 10,802 1.0243 1.0233 1
19 9:47 9.1 8.9 10,802 1.0241 1.0231 1
20 9:58 9.2 9 10,802 1.0241 1.0231 1
21 9:44 9.1 8.9 10,802 1.0242 1.0232 1
22 9:50 9.1 8.9 10,802 1.0241 1.0231 1
23 10:07 9.2 8.9 10,802 1.0239 1.0229 1
24 3:23 8.9 8.7 10,802 1.0239 1.0229 1
25 4:18 8.8 8.7 10,802 1.0239 1.0229 1
26 5:11 8.7 8.6 10,802 1.0238 1.0228 1
27 10:23 9.1 8.9 10,802 1.024 1.023 1
28 10:41 9.2 9 10,802 1.0239 1.023 1
29 11:01 9.2 9 10,802 1.024 1.023 1
30 11:16 9.3 9.1 10,802 1.0239 1.0229 1
Mean

Recorded by Race Rocks Marine Protected Area Guardian, Mike Slater.. Lester B Pearson

Salinity as an Abiotic Factor

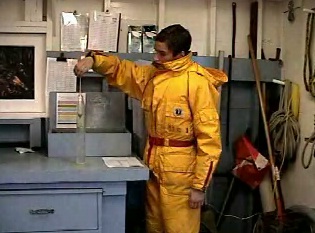
Jeremias tests the salinity using a hydrometer. This manual method has been used at Race Rocks from 1935 until more recent years when a digital salinometer has been used.


For monthly records of Salinity refer to :

https://www.racerocks.ca/?s=Salinity&submit=Search


“During our project week at Race Rocks, Mike Slater, the Race Rocks Marine Protected Area Guardian asked us if we could make a video explaining the daily duties necessary to maintain the facility. Students who are relieving on the island during Mike’s absence will be able to use this data as a guide for performing their duties, as well as providing a useful information resource for students visiting the island.

These duties include two daily engine checks, a salinity check one hour before high tide, and keeping a record of the days weather, as well as explaining the functions and instructions for testing machinery located on the island.”

ABIOTIC EFFECTS OF SALINITY ON ORGANISMS
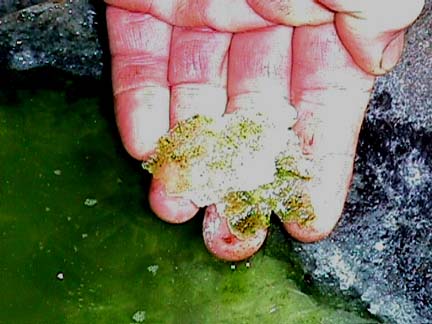
Organisms which live in Tidepools have to withstand changing salinities which may range from 0 parts per thousand to over 100 parts per thousand. Here is an example of an algae that in the summer lives in concentrated brine of the evaporated tidepool number 7.


Rob measures salinity with the salinometer in tidepool Number 4..This file shows the results that one class in environmental systems got when measuring the salinities of tidepools. Note there can be quite a variation in both temperature and salinity, depending on the elevation of the pool and therefore the frequency of flooding from the ocean.
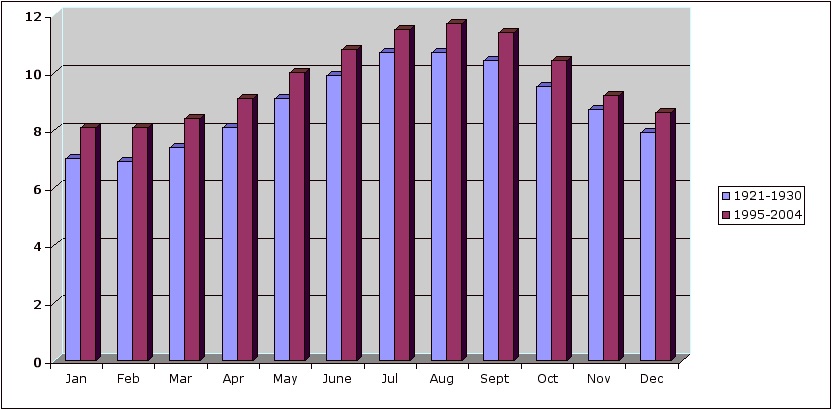
Mean Monthly Sea Surface Salinity at Race Rocks-1936 to present .

Two decades of mean monthly Salinity records are compared in the following investigation.

Salinity Comparisons for 2 Decades
There are a number of interesting features of the two decades almost 50 years apart.

Some open-ended questions that you may wish to pursue:

  1. How do the individual months compare?
  2. Is there any evidence of a trend that distinguishes the earlier decade from the most recent one?
  3. Is there any evidence of a trend that distinguishes one period of the year from another?
  4. What could be the cause of any observable trends?
  5. Does geographic location of Race Rocks provide an answer to any findings?
  6. See the work done on comparing sea temperature from two decades for some other ideas.
  7. What would the graphs look like if you took the means of each month from the two decades and plotted them ?

You may also see the the raw data used to make the graphs in the two tables below. It may be useful in this format to clip and paste into an EXCEL workbook for further analysis. If you come up with any other interesting analysis of the data from this exercise or from looking at the complete data archive. We would be interested in carrying it attached to this page.

Raw Data 1942 1943 1944 1945 1946 1947 1948 1949 1950 1951
Jan. 31.1 31.4 31.5 31.3 31.1 31.6 31 31.3 31.1 30.2
Feb. 30.9 31.3 31.5 31.2 31.2 31.2 31.4 31.5 31.1 30.2
Mar. 31.4 31.6 31.7 31.5 31.1 31.5 31.4 31.3 30.7 30.6
Apr. 31.5 31.2 31.9 31.5 31.4 31.7 31.5 31.5 31 31.3
May 31.5 31.5 31.7 31.7 31.3 31.6 31.3 31.3 31.3 31.5
June 31.6 31.5 32.1 31.6 31 31.2 30.8 31.2 31.3 31.1
July 31.2 31.3 31.8 31.5 30.7 31.4 30.4 31.8 30.9 31.3
Aug. 31.1 31.1 31.8 31.5 30.9 31 31.1 31.5 31 31.2
Sept. 31.3 31.1 31.7 31.6 31.4 31.4 31.1 31.4 31.1 31.5
Oct. 31.7 31.4 31.6 31.8 31.5 31.6 31.1 31.5 31 31.6
Nov 31.7 31.5 31.7 31.8 31.8 31.2 31.4 31.5 30.9 31.5
Dec 31.4 31.6 31.4 31.5 31.2 31.3 31 31 30.3 31.1
1998 1999 2000 2001 2002 2003 2004 2005 2006 2007
Jan. 30.6 30.5 30.8 31.3 30.8 31 30.9 30.9 30.79 30.6
Feb. 30.3 30.3 30.8 31.1 30.8 30 30.7 30.5 30.23 30.7
Mar. 30.4 30.5 30.9 31.6 31.1 30.9 30.9 31 31.19 30.8
Apr. 30.5 30.6 31.1 31.8 31.3 30.7 31.1 31.1 31.2 30.8
May 31 30.7 31 31.7 31.4 31.1 31.2 31.1 31.07 30.8
June 30.6 30.7 30.9 31.8 31.3 30.7 31.3 31.1 31.07 30.8
July 30.8 30.2 30.5 31.4 30.8 31.1 31.1 30.8 30.81 30.6
Aug. 30.9 30.2 30.7 31.3 30.7 31.2 31.3 30.8 31 30.4
Sept. 31 30 30.7 31.3 31.2 31.4 31.4 31.1 31.46 30.7
Oct. 31.3 30.7 30.9 31.6 31.3 31.6 31.1 31.4 31.54 31.2
Nov. 31.2 31.2 31.2 31.4 31.7 31 31.1 31.18 31.15 31
Dec. 30.7 30.7 31.3 31 31.4 31 31.1 31.22 30.9 31

LAB: Using Temperature and Salinity Data for an Excel exercise

Purpose:
To transfer Environmental Data being recorded at Race Rocks from a spread sheet presented on the internet to your own computer in order to be able to graph trends and analyze relationships.
Background:
Long term data bases are very important for a number of reasons. You may wish to write down in your assignment notes some of the applications you could use for such data. Certainly patterns of cyclic activity and even events such as Climate Change can be detected from the Race Rocks Data. Try to come up with a few other applications. We intend to make a complete range of environmental data from data sensors as these get installed.
See this file for the Data Recording IndexSee also IDEAS FOR STATISTCS ASSIGNMENTS
USING EXCEL DATA FROM racerocks.com
 

RACE ROCKS TEMPERATURE AND SALINITY EXERCISE
Since 1921 the Light keepers at Race Rocks have recorded some basic climatic data at Race Rocks. They started by taking daily sea water temperatures and in 1936 added daily salinity measurements to their measurements. The record is fairly complete except for a few years during the second world war, and so far we have not been able to determine why those records were not kept at that time.
1.This is a file with the daily sea temperatures and salinity and atmospheric data since the year 2000, as recorded by Mike Slater:2. We were able to get this complete monthly mean data base for Temperature….1921->present and this complete monthly mean data base…1936-present for Salinity from the Institute of Ocean Sciences.

3. Copy and Paste the data for the years you want to analyse from the web page directly into your blank EXCEL workbook.

4. You now have our original data on your computer and you can proceed to do any one of the many manipulations possible in the EXCEL program. You can also copy and paste in other month’s data in order to get a larger data set .

5. Take the opportunity to creative in the way you look at and interpret data, we would be interested in attaching your findings to this website. Send comments to: Garry Fletcher Just e-mail your analysis as an attachment.

6. You are welcome to use this data for educational purposes, you are just asked to reference the source as:
Lester B. Pearson College, racerocks.com

See this file for other ideas on Statistics from racerocks.com data.