Bald Eagles and Sea Lion Bones

The wind blew from the south, switching around to the east and north, by the mid afternoon.  The velocity of the wind hovered between 9 to 15 knots, during the daylight hours.  The barometer dropped from 1027 hPa to 1018 hPa.  The sky was overcast, with rain in the afternoon.  The temperature was 8oC for most of the day, dropping from 10oC yesterday.

There were no boats seen in the reserve today.

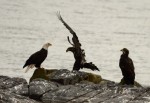
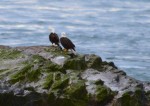
This morning, nine bald eagles were in reserve at one time:  four adults and five juvenile. They made at least one kill of a gull, just below the high point of the island, northwest of camera 5.

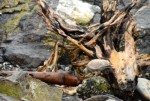
During a beachcombing exploration this afternoon, I found a partially decomposed sea lion carcass.  It appeared to be a steller sea lion, based on the appearance of the fur and flippers.  It was near where I had found other sea lion bones a few weeks ago.  The bones had been mostly cleaned by gulls and insects.  It looked fairly recent, because the fur was still intact and attached to several parts of the skeleton.

Sea Lion Thermoregulation

The barometer rose steadily throughout the day as a moderate westerly breeze whipped across the reserve. The clouds parted mid morning to bring an afternoon of sun and a high of 13.1 oC.

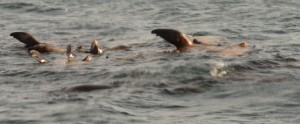
The solar panels weren’t the only things soaking up the sun’s rays. Sea lions were floating in small groups with one or all four flippers exposed to the air, using thermoregulation to their advantage. The sun warms the seal’s flippers, which are poorly insulated, then the warmed blood is pumped throughout their body.

One whale watching boat was seen in the reserve, after they spotted humpback whales surfacing a few kilometres to the east of the Race Rocks.

Courtney visited on the Second Nature to give a quick lesson on some of the mechanical systems on the island.

Maintenance tasks were performed today: running the generator, cleaning the solar panels, tracking down equipment and parts, figuring out how to use the equipment, vacuuming, flag care, and sweeping the paths.

Sea lions thermoregulating by sticking a fin out of the water.

Sea lions sticking flippers out of the water for thermoregulation.

October 2014 Seawater Data

Station: Race Rocks  Ecological Reserve —–October, 2014,
Recorded daily by the Race Rocks Ecological Reserve Ecoguardian on behalf of Pearson College UWC
Submitted monthly to: Peter Chandler, Institute of Ocean Sciences, Sidney, BC.
This file may be copied and pasted into a spreadsheet for further analysis. Find other monthly records here:

Date Time Sea Jar Hydro- meter No. Observed Density YSI Salinity YSI Temp °C
Temp. Temp.
°C °C
1 18:26         30.1 11.0
2 13:36         31.7 11.0
3 13:36         31.5 11.5
4 13:21         31.4 10.9
5 13:37         31.4 11.1
6 13:14         31.3 10.8
7 13:36         31.5 10.3
8 14:16         31.6 10.1
9 14:42         31.4 10.2
10 15:16         31.7 10.0
11 15:47         31.3 10.2
12 16:14         31.3 10.2
13 15:58         31.3 10.2
14 10:53         31.4 10.1
15 11:38         31.2 10.2
16 12:03         31.3 10.4
17 12:08         31.3 10.2
18 12:12         31.3 10.4
19 12:37 11.8 11.8 10802 240 31.2 11.3
20 12:38         31.3 11.1
21 12:55         31.0 10.7
22 13:24         31.2 10.4
23 13:39         31.0 10.7
24 14:01         30.4 12.7
25 14:07         30.9 11.8
26 13:37         31.2 10.6
27 14:04         31.2 10.7
28 14:44         31.9 10.9
29 15:31         31.2 10.9
30 10:50         31.2 11.2
31 10:55         31.1 11.3
Mean*           31.3 10.7

February 2014 Seawater Data

Recorded by Race Rocks Ecological Reserve Guardian on behalf of Lester B. Pearson College

Daily Seawater Temperature and Density Record Shore Station
Time Zone: PST
Station Race  Rocks  Light station
Month: February Year: 2014
Observer: Lester B. Pearson  College  of  the  Pacific
Date Time Sea
Temp.
°C
Jar
Temp.
°C
Hydro-  meter   No. Observed Density YSI Salinity YSI Temp °C
1 1400 31.8 7.7
2 700 7.6 7.7 1.0249 31.5 7.7
3 1430 32.4 7.1 Continue reading

Weather Data: Temperature (Env. Canada) April-August 2013

Recording of temperature was  started by Environment Canada  in April, 2013 on this website: Compare this data set with that produced by our Davis Instrument at Ground level.
You may copy and paste into an excel spreadsheet in order to do further analysis and graphs.
Other archived weather data is being made available in the “weather -archive category”

Continue reading

Temperature Graph for April, 2013

Whole Month Temperature Graph for April 2013

In April 2013, Environment Canada started recording temperature again at Race Rocks . This was discontinued with the automation of the station in 1997. Other Archived weather may be found  in the “Weather Archive Category”
The links for next month below take you to  graphs of the following months.

Race Rocks Mean Monthly Sea Temperature 1921-present,

Seawater Temperature: Race Rocks
Decade Comparisons:Sea Surface Temperature at Race Rocks-
 

Year Jan Feb Mar Apr May Jun Jul Aug Sep Oct Nov Dec
1921 7.1 7.3 7.7 8.5 9.5 10.3 10.5 10.3 9.8 9.1 8.2
1922 6.4 6.1 6.6 7.5 8.3 9.5 10.5 10.3 10.2 9.3 8.4 7.1
1923 7.1 6.4 6.7 7.6 8.6 9.3 10.3 10.5 10.6 9.6 8.7 7.9
1924 7.1 7.3 7.7 7.9 9 9.8 10.5 10.3 10.2 9.2 8.8 7.3
1925 6.6 6.9 7.3 8 9.2 10.1 11.1 10.8 10.2 9.2 8.3 8.2
1926 7.8 8 8.6 9.2 10.1 10.7 11.1 10.9 10.5 9.8 9.1 8.5
1927 7.6 7.4 7.8 8 8.8 9.8 10.5 10.9 10.3 9.7 8.6 7.6
1928 6.9 7.3 7.8 8.6 9.7 10.2 10.8 10.9 10.3 9.2 8.6 7.9
1929 7.1 6.3 7.1 7.8 9 9.8 10.8 10.8 10.7 9.8 8.8 7.8
1930 6.5 6.6 7.1 8.2 9.3 10 10.6 10.8 10.6 9.4 8.6 8
1931 7.8 7.8 8.2 8.8 9.9 10.6 11.5 11.1 10.7 9.6 8.6 7.7
1932 7.1 6.8 7.3 8.2 9.3 10.4 10.8 10.9 10.7 9.6 8.9 7.7
1933 7.1 6.7 7.1 8 9.1 10.2 10.5 11.5 10.1 9.6 8.6 7.7
1934 7.8 7.9 8.3 9.2 10 10.8 10.9 11.6 10.7 9.7 9.2 8.4
1935 7.2 7.2 7.5 7.8 9.2 10.1 10.5 10.5 10.7 9.7 8.2 8.1
1936 7.9 6.7 7 7.8 9.3 10.4 11.3 11.3 10.5 10.1 8.6 7.9
1937 6.6 6.4 7.7 8.7 9.9 10.9 11.7 11.5 10.9 9.9 8.5 8.1
1938 7.4 7.2 8.1 9.4 10.6 12.3 12.7 11.9 11 9.9 8.6 7.5
1939 7.4 6.6 7.1 8.6 10.3 11.4 12.2 11.1 11.4 9.7 8.5
1940 7.9 8.2 9 10 11.4 11.6
1941 10 10.5 11.2 11 10.6 9.9 9 8.5
1942 7.9 7.9 7.8 8.5 9.6 9.8 10.5 11 10.3 9.5 8.4 7.9
1943 6.8 6.7 7.1 8.2 8.8 10 10.3 10.6 10.3 9.6 9 8.1
1944 7.7 7.5 7.3 8 9.2 10.5 11 10.9 10.5 9.6 9.2 8.1
1945 7.8 7.7 7.6 8 8.8 9.8 10.1 10.5 10 9.5 8.1 8.1
1946 7.7 7.3 7.7 8.1 9.4 10.2 10.7 10.8 10.3 9.4 8.1 7.7
1947 7.1 7 7.7 8.4 9.5 10.4 10.6 10.9 10.5 9.9 9.1 7.9
1948 7.5 6.9 7.2 7.9 9 10.2 10.8 10.7 10.4 9.5 8.2 7
1949 6.1 6.1 6.9 8.3 9.4 10.1 10.3 10.2 10.5 9.5 8.7 7.8
1950 6.2 5.8 6.6 7.7 8.7 9.4 10.1 10.4 10.3 9.3 8.5 8
1951 7.5 6.9 6.7 8.1 9.2 10.2 10.4 11.1 10.9 9.5 8.5 7.7
1952 6.9 7.1 7.6 8.2 9 9.6 10.4 10.5 10.2 9.8 8.6 7.9
1953 7.8 7.9 7.6 8.1 9.3 9.8 10.6 11 10.6 9.9 9.3 8.5
1954 7.1 7.3 7.5 7.9 8.7 9.3 9.9 10 10 9.4 9.1 8.4
1955 7.5 7.1 6.7 7.5 8.4 9.3 9.8 10.2 10 8.9 7.5 6.6
1956 6.7 6.4 6.3 7.6 8.7 9.6 10.2 10.4 10.1 9.2 8.1 7.1
1957 6.3 6.2 7.2 8.1 9.3 10 10.3 10.5 10.5 9.8 8.8 8.3
1958 8 8.3 8.6 9.3 10.3 10.7 11.5 11.5 11 9.9 8.7 8.1
1959 7.6 7.4 7.9 9.1 9.7 10.4 11.3 11 10.4 9.7 8.3 7.8
1960 7.1 7.5 7.5 8.6 9.6 10.3 11.4 10.8 10.1 9.5 8.6 7.9
1961 7.9 8.2 8.4 8.8 9.4 10.3 10.9 11.3 10.6 9.4 8.2 7.5
1962 7.2 7.3 7.3 8.4 9.3 10 10.4 10.5 10.5 10 9.3 8.7
1963 7.5 7.5 7.8 8.5 9.6 10.2 10.5 10.8 10.6 10.3 9.9 8.7
1964 8.2 7.9 7.7 8.2 8.8 9.6 10.3 10.5 10 9.4 8.3 7.4
1965 6.9 7.1 7.2 8 8.8 9.8 10 10.2 10.3 9.7 9.2 8.5
1966 7.7 7.6 7.7 8.5 9 9.1 99.9 10.7 10.1 9.5 8.7 8.6
1967 7.9 7.7 7.6 8.1 8.9 9.6 10.3 10.5 10.5 9.7 9.1 8
1968 7.3 7.3 8 8.3 8.7 9.5 10.2 10.2 10.4 9.3 8.8 7.8
1969 6.5 6.3 7.2 8.1 9.1 10.2 10.4 10.5 9.8 9.2 8.7 8.1
1970 7.5 7.7 7.9 8 8.7 9.6 10.2 10.2 10 9 8.3 7.5
1971 7 6.9 6.7 7.5 8.5 9.1 10 10.6 10.4 9.3 8.3 7.3
1972 6.4 6.2 6.9 7.6 8.8 9.5 10.5 10.6 10.2 9.1 8.4 7.3
1973 7 7.2 7.9 8.4 8.6 9.2 10.1 10.3 10 9.2 8.2 8
1974 7.2 7.2 7.3 8.1 8.5 9.7 10 10.9 10.6 9.7 8.6 8.2
1975 7.3 6.8 7.2 7.7 8.7 9.4 10.2 10.4 10.4 9.6 9.2 7.8
1976 7.2 7 7 7.8 8.7 9.3 10.1 10.1 10 9.4 8.6 8.1
1977 7.6 7.9 8 8.3 8.8 9.7 9.9 10.8 10.3 9.2 8.6 7.9
1978 7.6 7.9 8.3 8.9 9.4 10.3 10.4 10.9 10.5 9.8 8.2 7.3
1979 6.5 6.9 7.5 8.3 9.5 10 10.8 10.7 10.5 9.8 9 8.6
1980 7.7 7.6 7.9 8.6 9.5 9.5 10.6 10.9 10.5 9.9 9.2 8.6
1981 8.3 8.3 8.8 9.2 9.4 9.9 10.3 10.5 10.2 9.7 9.3 8.5
1982 7.2 7.5 8 8.8 9.9 10.7 11.4 11.8 11.4 10.3 8.8 8.3
1983 8.6 8.6 9.3 10 10.6 11.3 11.7 12.4 11.4 10.3 9.5 7.7
1984 7.5 7.8 8.4 9 9.7 10.3 11.4 11.6 10.6 9.7 8.5 6.9
1985 6.8 6.8 7.2 8.2 9.6 10.6 11.5 11.6 10.8 9.6 6.8 6.4
1986 7 6.6 8 8.4 9.4 11 10.9 11.8 10.8 9.8 8.4 7.8
1987 7.6 7.9 8.3 8.9 9.8 10.6 11.1 11.5 11.1 10 9 8.2
1988 7.4 7.5 7.5 8.6 9.6 10.4 11 11.4 10.6 9.6 8.7 7.9
1989 7 5.8 6.8 8.2 9.5 10.7 11.3 11.2 11 9.9 8.9 8.2
1990 8.1 7.7 8.2 9 9.9 10.8 11.8 12.1 12.1 10.7 9.9 8.2
1991 7.1 7.7 7.9 8.4 9.7 9.7 10.8 11 11.2 10.1 8.9 8.3
1992 7.9 8.1 9.5 9.5 10.2 10.7 11.1 11.4 11 10 9.1 7.8
1993 6.7 6.7 7.6 8.6 9.7 10.8 11 11.2 11 10.1 8.5 7.9
1994 8 7.4 8.6 9.3 10.1 10.6 11.6 11.5 11.3 10.7 9.3 8.4
1995 8.2 8.6 8.8 9.2 10.2 11.2 11.8 11.5 11.3 10.2 9.4 8.9
1996 8.2 7.8 8.4 9.2 10 10.4 11.5 11.5 10.5 9.9 8.7 7.6
1997 7.7 7.9 8.1 9 10.3 10.9 11.7 12.2 11.6 11.3 9.9 9.3
1998 8.7 9.2 9.7 9.9 10.4 11.4 11.7 12.3 12.1 10.7 9.8 9
1999 8 7.8 8.1 8.9 9.5 10.4 11.1 11.5 11.9 10.1 9 8.5
2000 7.5 7.7 8.1 9.1 10 11.1 11.3 11.7 11.4 10.3 9 8
2001 7.9 7.7 8.1 8.7 9.7 10.6 11.3 11.4 11.4 10.2 9.2 8.3
2002 8.1 7.9 7.7 8.7 9.4 10.5 11,2 11.7 11.3 10.0 9.0 8.8
2003 8.8 8.5 8.7 9.2 9.9 10.9 11.3 11.4 11.4 10.9 9.0 8.5
2004 7.8 7.9 8.3 9.1 10.4 11.0 11.8 11.9 11.2 10.6 9.4 8.6
2005 7.7 8.0 8.8 9.4 10.7 11.2 11.6 12.1 11.5 10.4 9.5 8.3
2006 8.61 8.49 8.41 8.75 10.08 10.86 11.66 12.09 11.49 10.55 9.29 8.5
2007 7.8 7.9 7.9 9.0 10.0 10.2 11.2 11.6 11.0 10.0 9.0 8.0
2008 7.46 7.33 7.68 8.06 9.36 9.77 10.84 11.30 11.16 10.14 9.39 7.87
2009 7.29 7.20 7.5 8.4 9.54 10.4 11.4 11.74 11.8 10.5 9.0 7.0
2010 8.11 8.68 9.12 8.96 9.54 10.36 11.16 11.93 11.08 10.37 8.98 8.5
2011 7.8
2012
2013
2014
2016
2017
2018
2019
2020
2021
2022
2023


Note, The blanks for the years 1940-41 are due to the Second World War. Apparently during that time, data was not collected by a lightkeeper.

Original data was sent by the Lightkeepers and now by the Marine Protected Area Guardian of Race Rocks to the Institute of Ocean Sciences where it is compiled and displayed at

http://www.pac.dfo-mpo.gc.ca/science/oceans/data-donnees/lighthouses-phares/index-eng.htm

Decade Average GraphDecade analysis by G. Fletcher.. NOTE probable evidence of climate change


Seawater Salinity and Temperature November 2008

Daily Seawater Temperature and Density Record Shore Station

Observer Lester B. Pearson College of the Pacific,
Month NOVEMBER 2008,Time Zone P.S.T

 Date:
November:
temp °C °tempC Jar Temp °C Hydro- meter No. Observer Reduced *Corrected *Salinity
1 11:57 9.6 9.4 10,802 1.0242 1.0233 1
2 11:17 9.6 9.5 10,802 1.0242 1.0233 1
3 10:50 9.6 9.5 10,802 1.0241 1.0232 1
4 10:41 9.7 9.5 10,802 1.024 1.0231 1
5 10:42 9.6 9.4 10,802 1.024 1.0231 1
6 10:48 9.8 9.5 10,802 1.0237 1.0228 1
7 10:44 9.8 9.4 10,802 1.0236 1.0227 1
8 19:31 9.8 9.4 10,802 1.024 1.0231 1
9 10:34 9.7 9.5 10,802 1.0242 1.0233 1
10 10:48 9.8 9.5 10,802 1.024 1.0231 1
11 11:05 9.7 9.5 10,802 1.024 1.0231 1
12 4:19 9.7 9.4 10,802 1.0241 1.0232 1
13 5:24 9.6 9.4 10,802 1.0241 1.0232 1
14 6:22 9.5 9.3 10,802 1.0239 1.023 1
15 7:18 9.2 9 10,802 1.0242 1.0232 1
16 8:13 9.4 9.2 10,802 1.0242 1.0232 1
17 8:49 9.5 9.1 10,802 1.0244 1.0234 1
18 9:21 9.2 9.1 10,802 1.0243 1.0233 1
19 9:47 9.1 8.9 10,802 1.0241 1.0231 1
20 9:58 9.2 9 10,802 1.0241 1.0231 1
21 9:44 9.1 8.9 10,802 1.0242 1.0232 1
22 9:50 9.1 8.9 10,802 1.0241 1.0231 1
23 10:07 9.2 8.9 10,802 1.0239 1.0229 1
24 3:23 8.9 8.7 10,802 1.0239 1.0229 1
25 4:18 8.8 8.7 10,802 1.0239 1.0229 1
26 5:11 8.7 8.6 10,802 1.0238 1.0228 1
27 10:23 9.1 8.9 10,802 1.024 1.023 1
28 10:41 9.2 9 10,802 1.0239 1.023 1
29 11:01 9.2 9 10,802 1.024 1.023 1
30 11:16 9.3 9.1 10,802 1.0239 1.0229 1
Mean

Recorded by Race Rocks Marine Protected Area Guardian, Mike Slater.. Lester B Pearson