SCROLL DOWN FOR ABIOTIC EFFECTS:
Data showing the present conditions at Race Rocks and an explanation of the measurement are at the top of this page. Wind as an Abiotic Factor is referred to here near the bottom of the page. We are grateful to the University of Victoria’s School-based Weather Station website for some of the following live graphs and analytical statistics. Note the raw real-time measurements are in knots, and the historical records are in kilometres per hour.
 Wind Speed for the Last24 hours
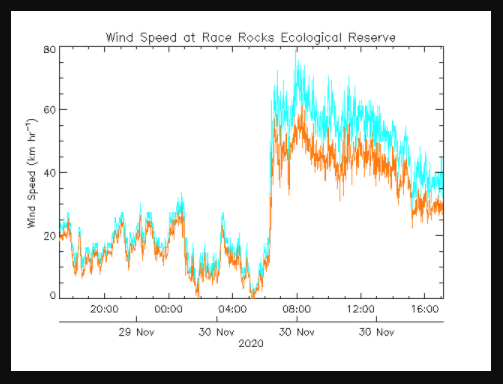
The wind Speed in km/hr over the past 24 hours is measured at t 6 meters elevation from the Race Rocks weather station at 6 metres elevation( 2 metres above ground level).
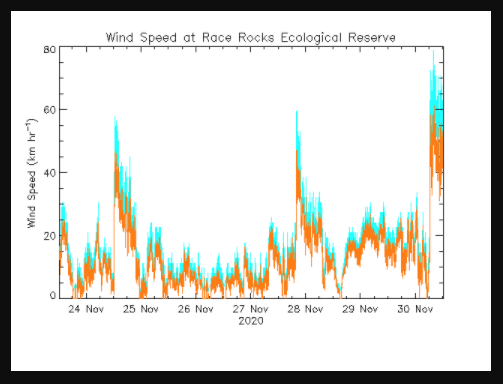 This graph represents the wind speed in km/hr over the past week
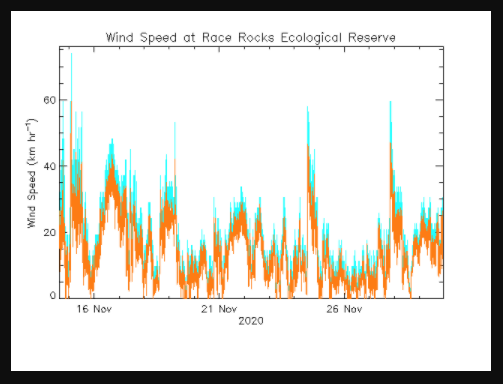 This graph represents the wind speed in km/hr over the past month from the Race Rocks weather station at 6 metres elevation.
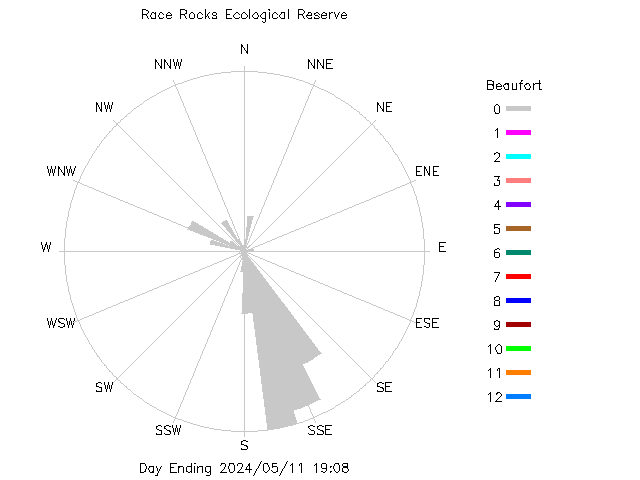 Click for the windrose for the last 24 hours showing speed and direction
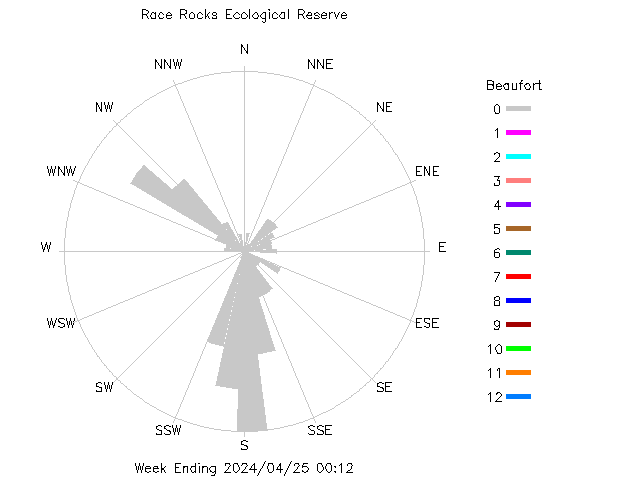 The windrose for the last week-showing speed and direction
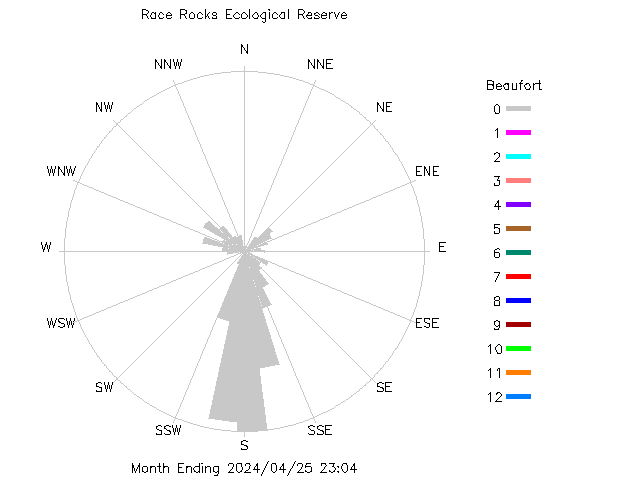 The windrose for the past month showing speed and direction
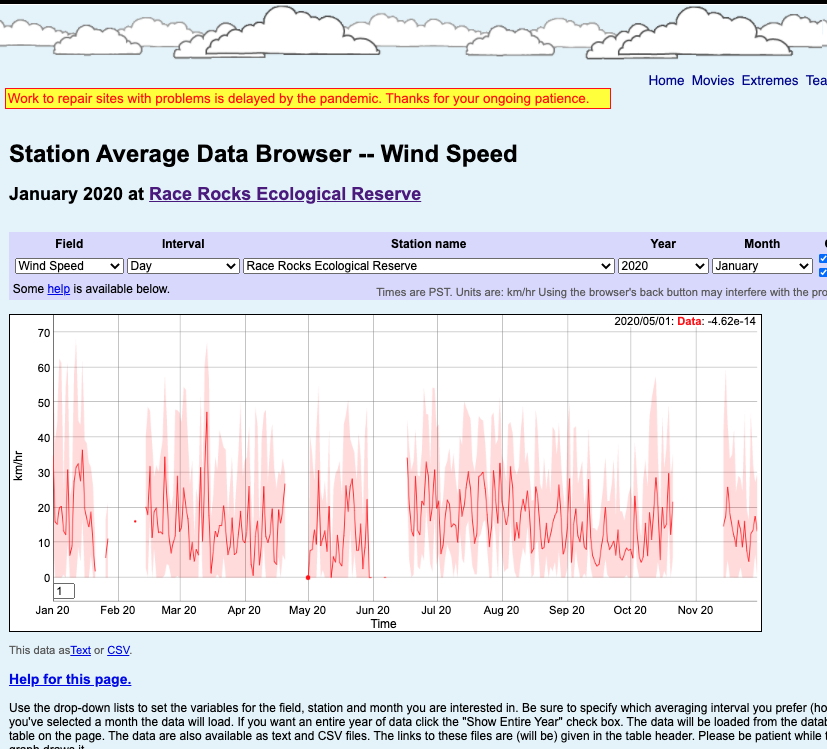
Race Rocks Station Average Data Browser: Yearly WindGraph
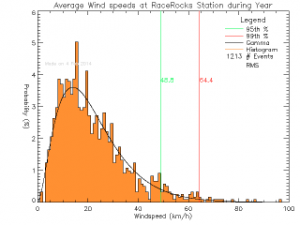
Click for Histograms of probability density functions(PDF) of Wind Speed.[/caption]
 Data: High Wind Speed The wind instrument software is constantly checking for a new high wind speed. The highest wind speed value recorded during the interval gets written into archive memory. See this link for past monthly maximum wind speeds from our Davis instrument since 2006 at the ground level at Race Rocks http://www.victoriaweather.ca/extreme.php?id=72
DOING STATISTICS ON WIND SPEED at Race Rocks: For data recorded by our Davis Weather Instrument at Race Rocks and made available by the website http://www.victoriaweather.ca/ , Click on one of the following and open in a text file.
Last 24 hr. Raw wind data: Day
Raw wind data: Week
From the Environment Canada website there are several methods you can use in order to get historical monthly WIND speed and direction data from previous years:
CSV METHOD:1.Following from # 4 above…In the panel “Navigation Options” Choose Bulk Data, CSV. Then import that .csv file into a Spreadsheet. This is an example of a chart made in EXCEL.
>OR: HTML METHOD: 1. Go to the Environment Canada website at http://www.climate.weatheroffice.ec.gc.ca/climateData/canada_e.htm 2. Choose Customized Search 3. Choose Search Station by name, enter Race Rocks 4. Choose Race Rocks CS, the data for direction and speed occurs in the two right hand columns. 5. Save the page to your computer. 6. Open it in an html browser 7. Now you can cut and paste the two columns and the day of the month column to a spreadsheet such as EXCEL and proceed to make graphs or do statistics on the data. Send us your results of data manipulation and we will link to them here!
The University of Victoria’s School-based Weather Station website has made available to us this URL for the Station Average Data Browser — Windspeed
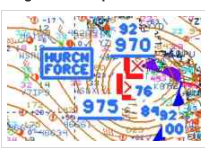 Hurricane Force Winds (158km) occurred on the night of December 15, 2006 This file shows the data related to that extreme event.
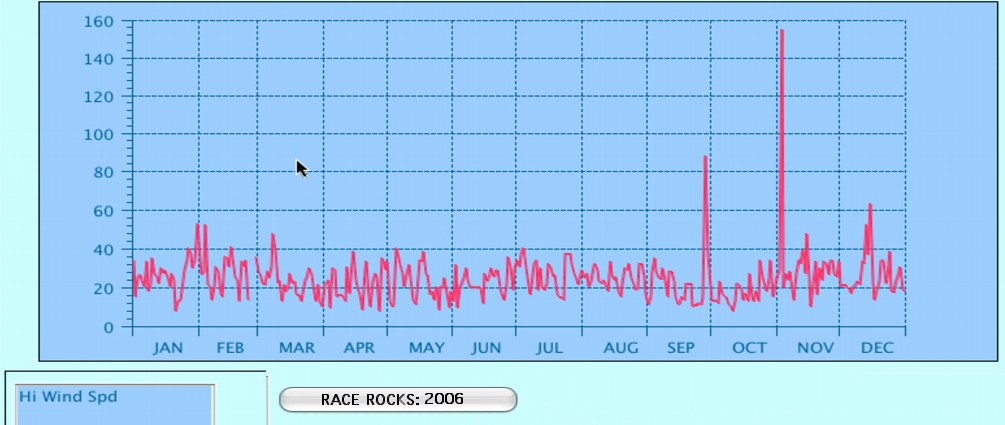
Wind speed for 2006 showing extreme for hurricane in December
Abiotic effects of the wind at Race Rocks:
 An impressive aspect of the beauty of the West Coast of British Columbia is the ever changing seascape under the influence of the wind. In the summer months, from May through September, the wind blows up the Strait of Juan de Fuca from open Pacific Ocean 100km to the west. Rarely do we get easterly winds at that time. From October through April, we can have winds originating from either direction. Wind of course is what we see from the movement of air from a high pressure center to an area of low pressure. Pressure difference are ultimately caused by the warming of the earth and the atmosphere from the sun. So in effect we can say that wind as a form of energy is a derivative of solar energy.
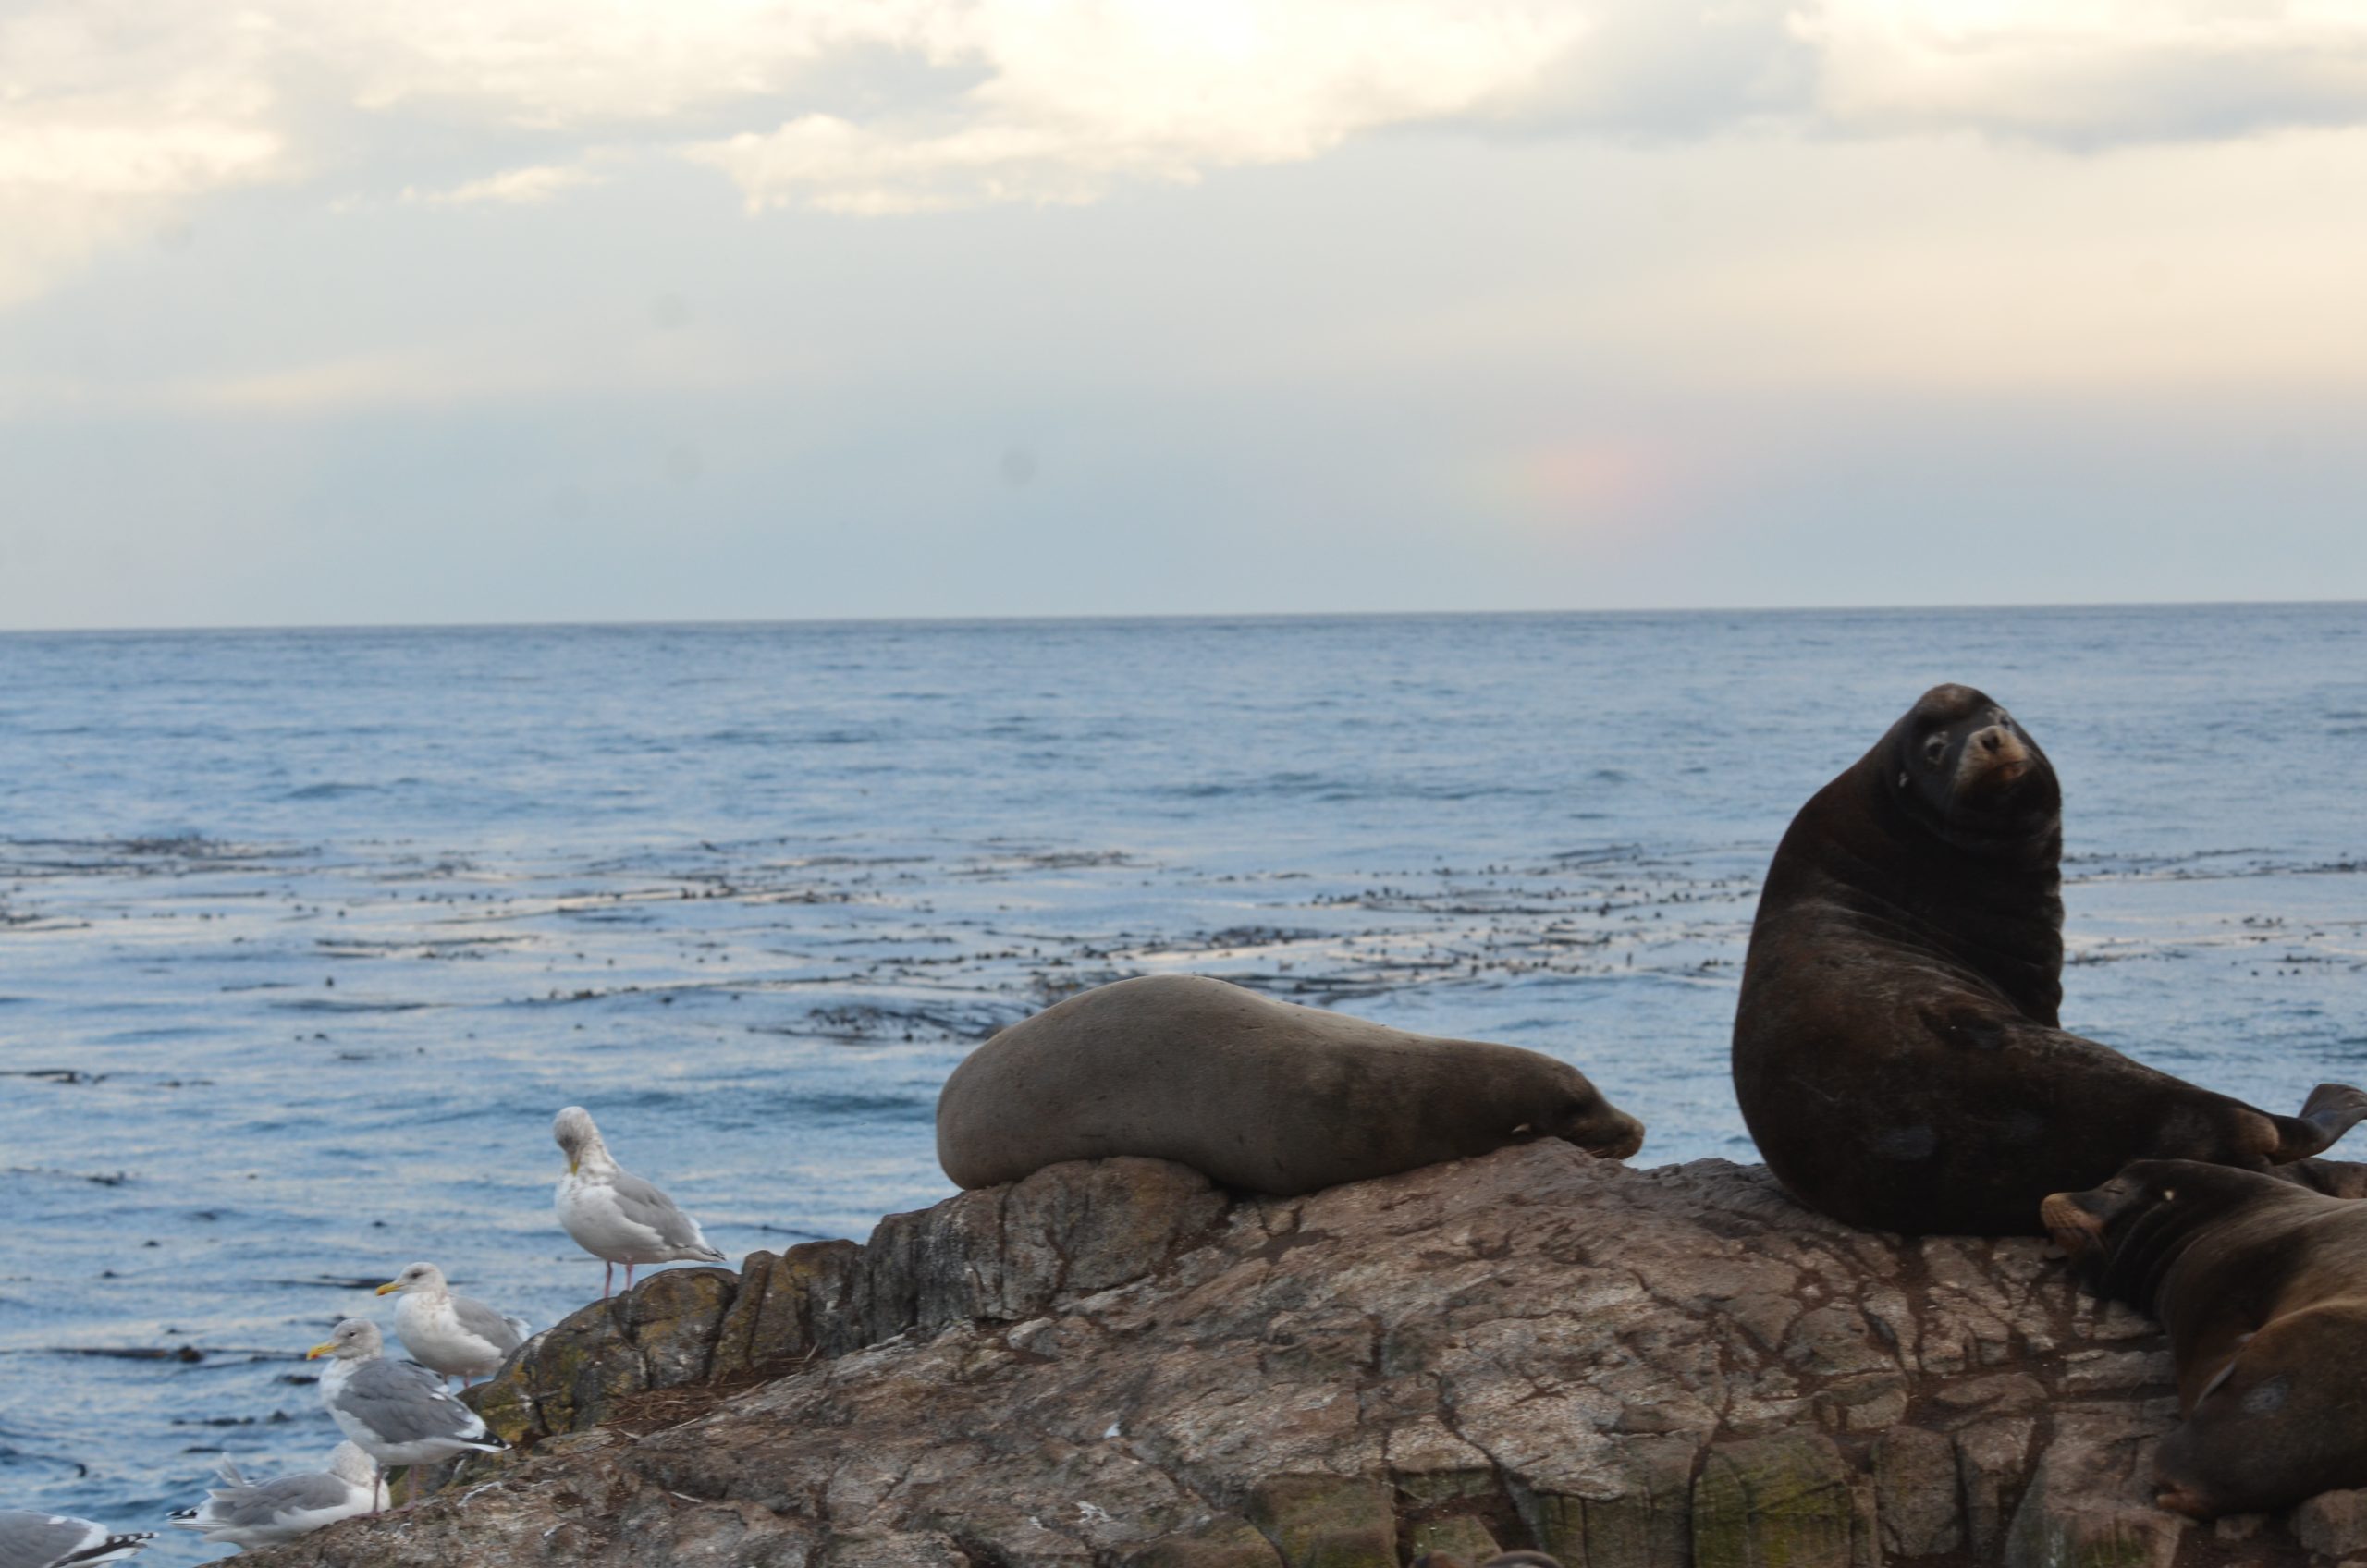
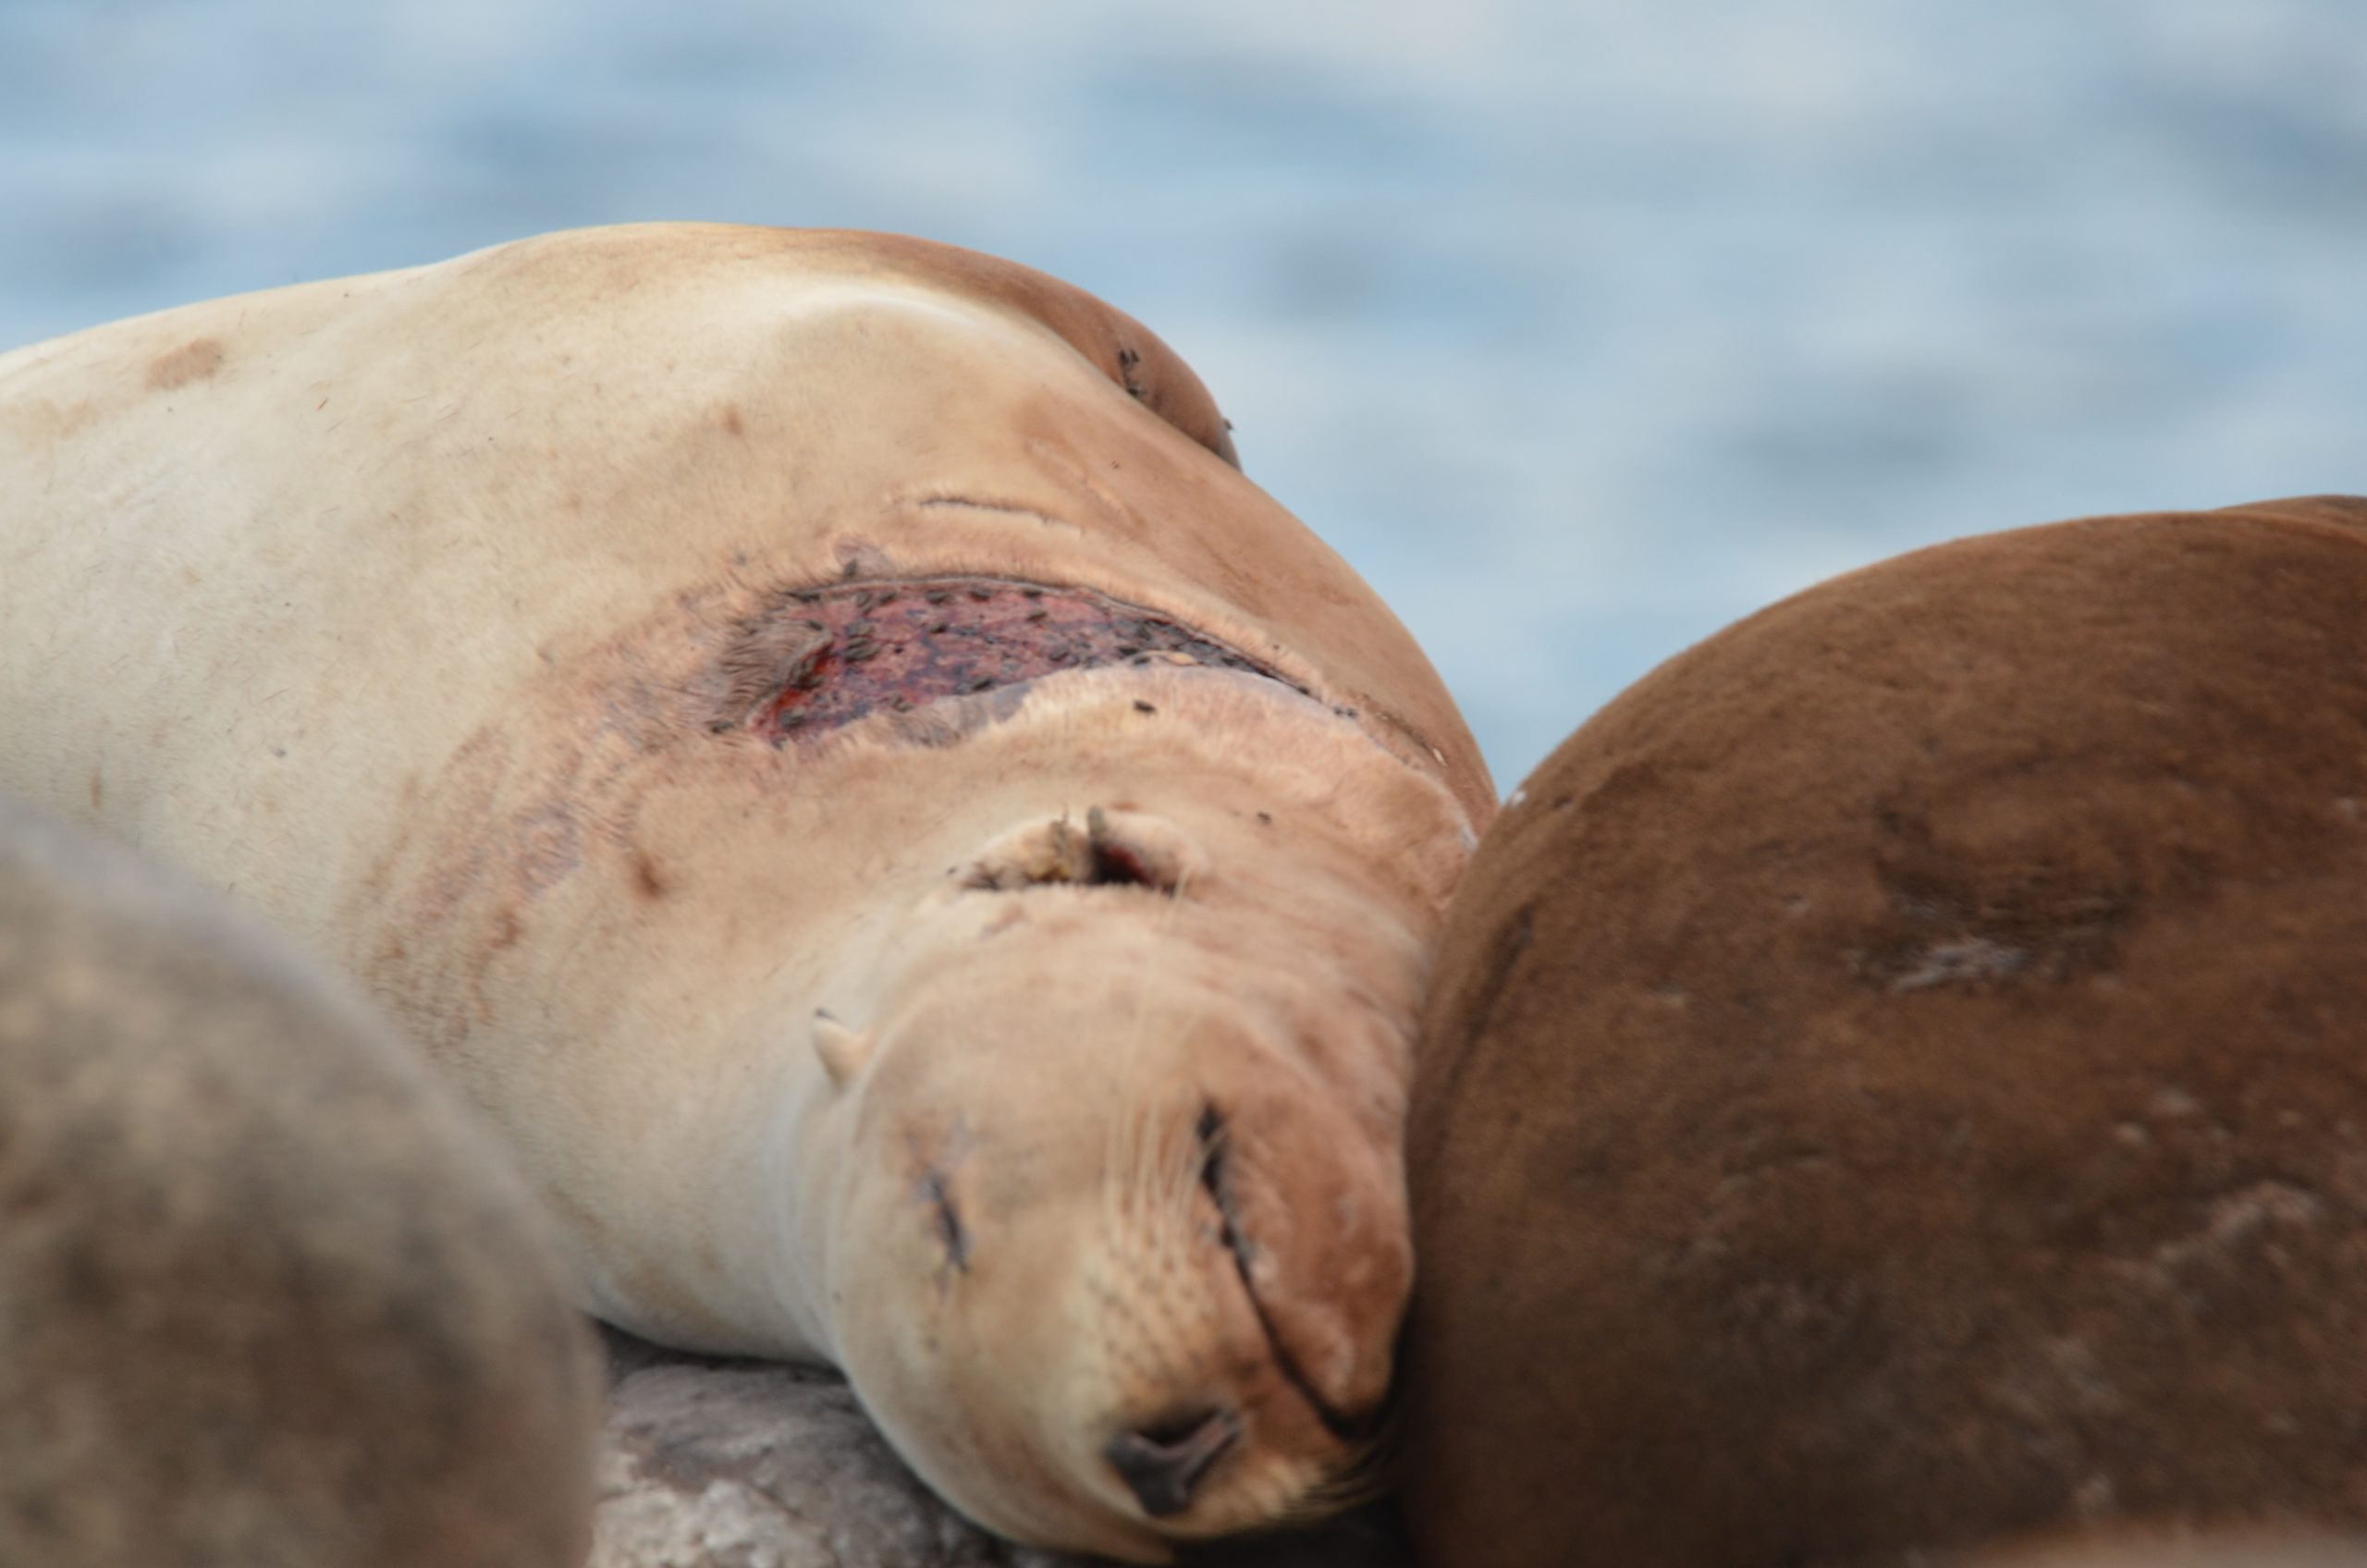
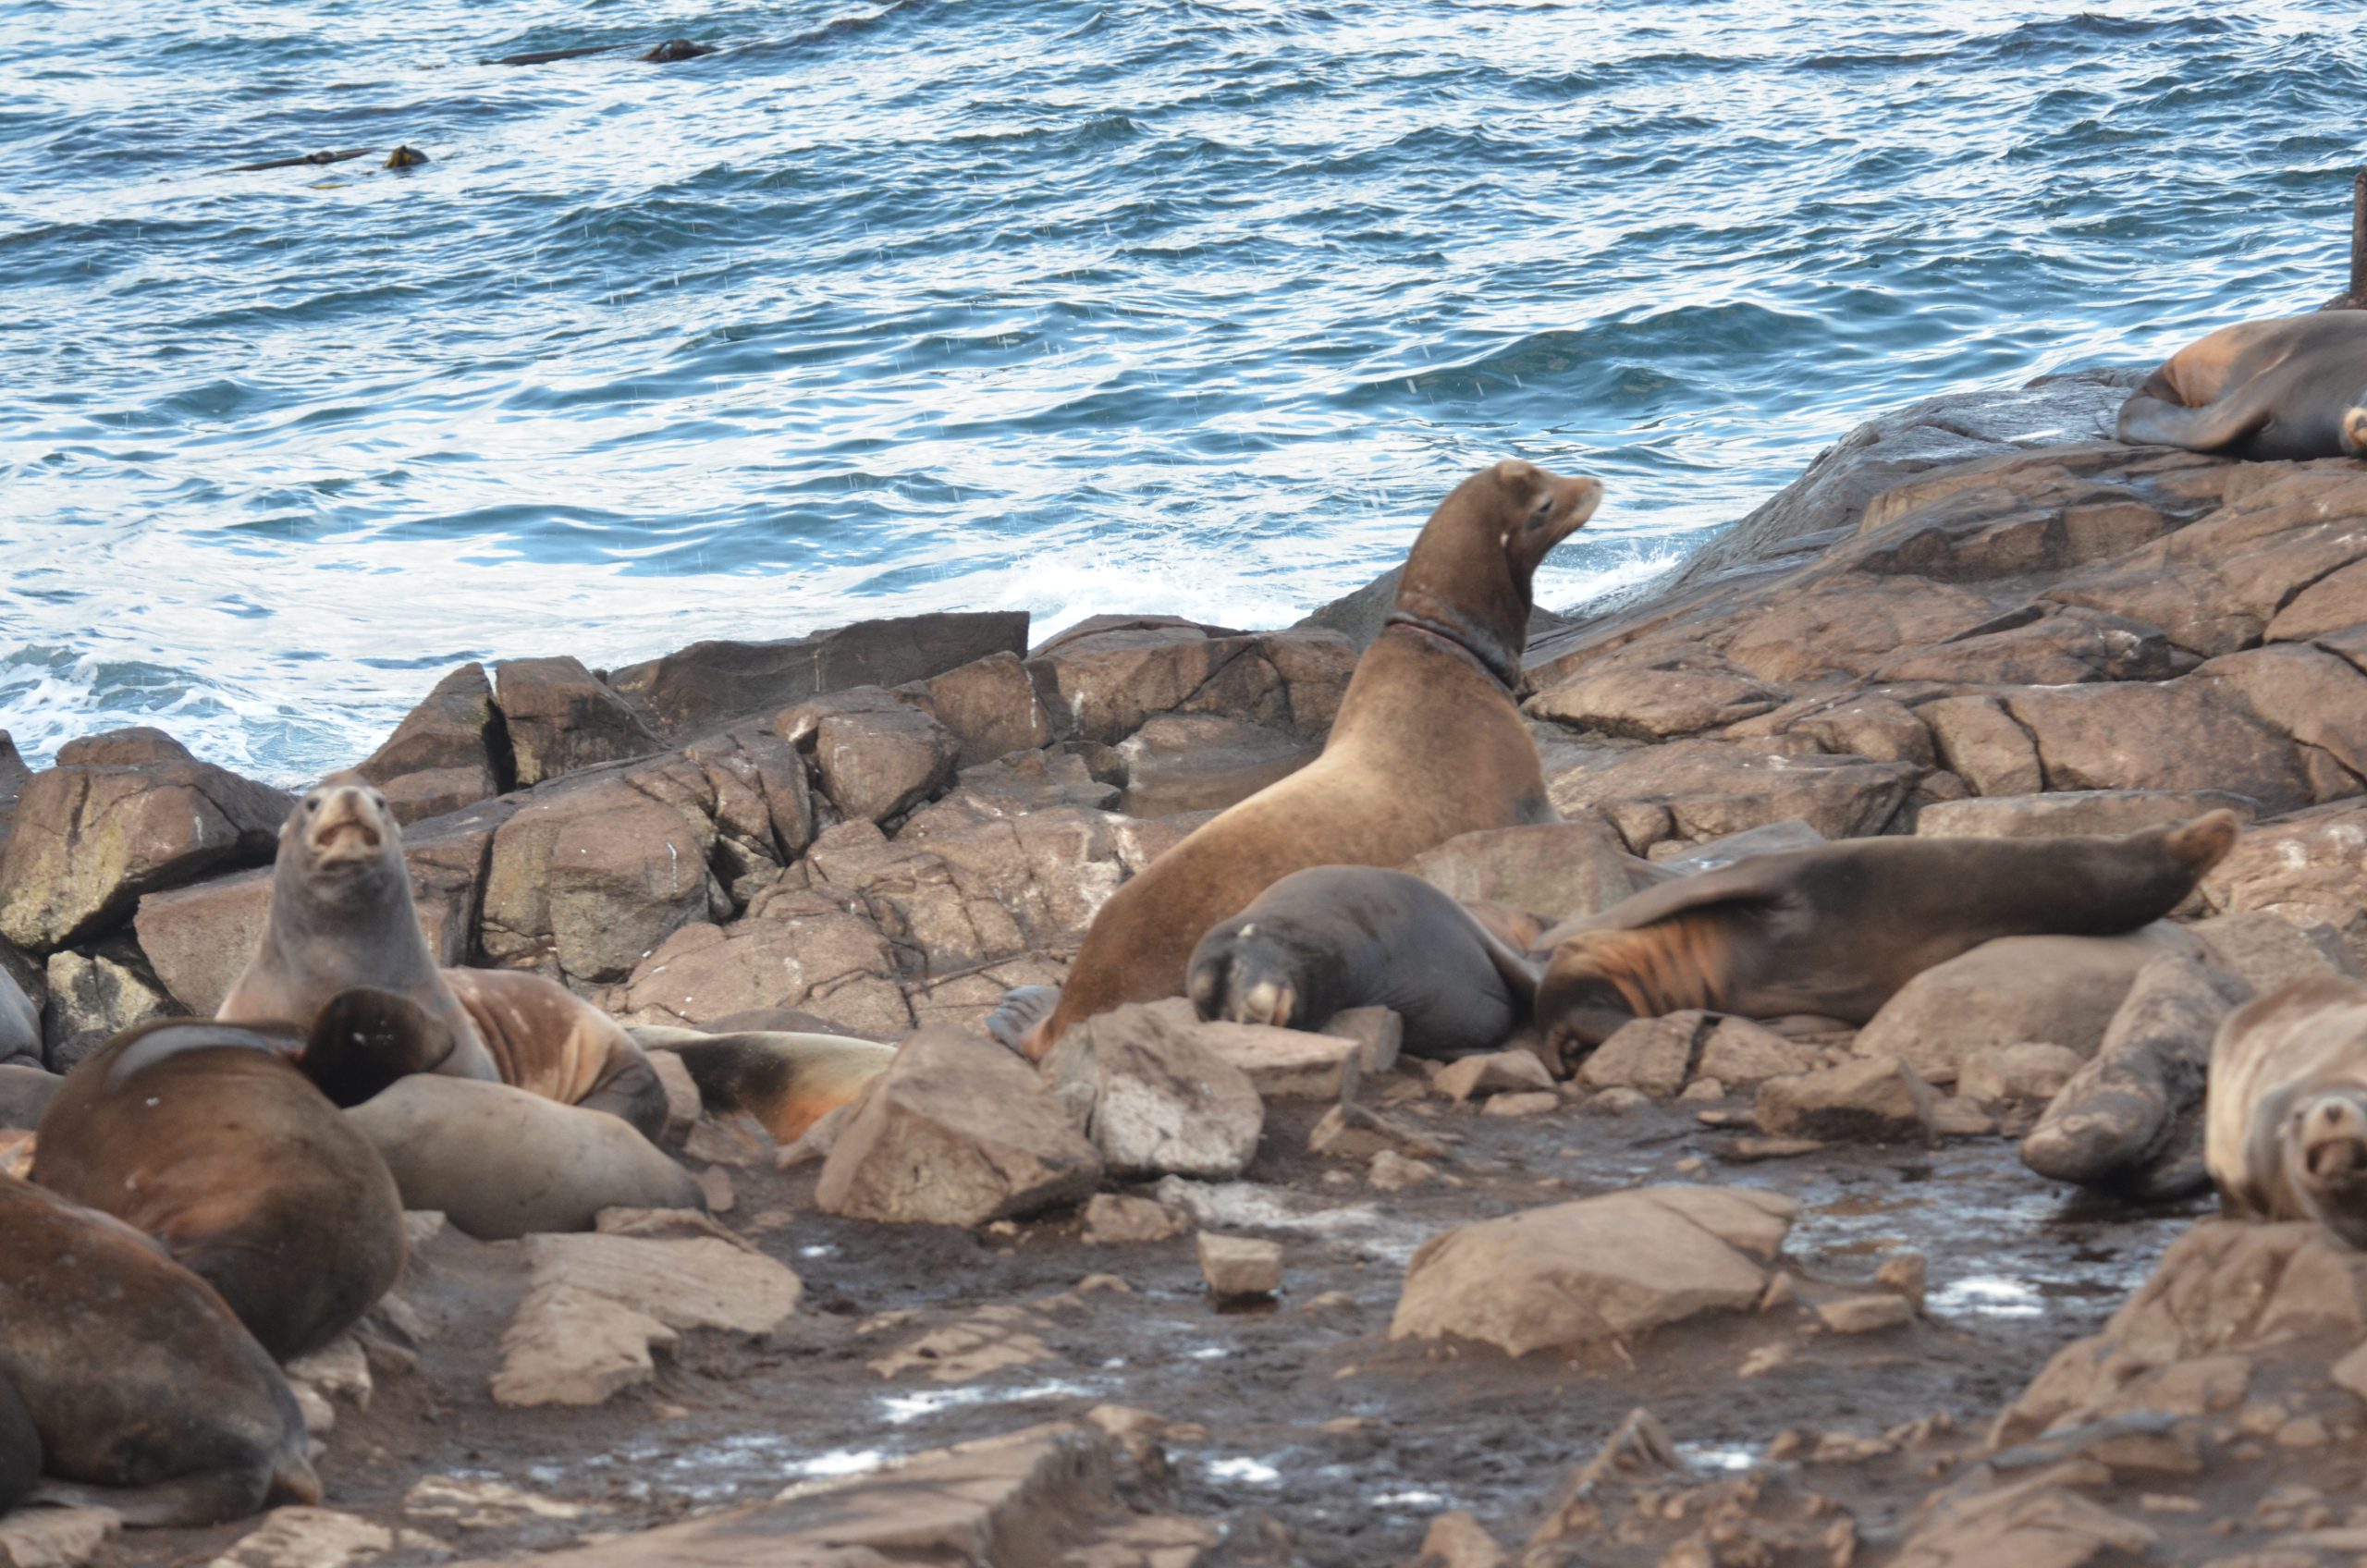
  The effect of wind on organisms in many different habitats on the islands is pronounced. Birds are impacted in their foraging, nesting and resting, Their behaviour often reflects an adaptation to wind. In November of each year we have a large overwintering population of Thayer’s gulls. This video shows them oriented along the axis of the wind when it was blowing from the north-east at 30 Knots. Their activity was certainly curtailed that day as they held out against the storm. The marine mammals are also sensitive to wind direction. Typically there are many sealions hauled out on the North East corner of the island in September, but with the first blows from the Northeast, they often disperse to more protected locations.Intertidal organisms are also affected. Macroalgae must have firmly attached holdfasts to resist the pounding waves, and the logs and other debris carried onshore by the wind. Goose Neck barnacles and californianus mussels also have their special strategies to hold on in this highly impacted zone.
The full e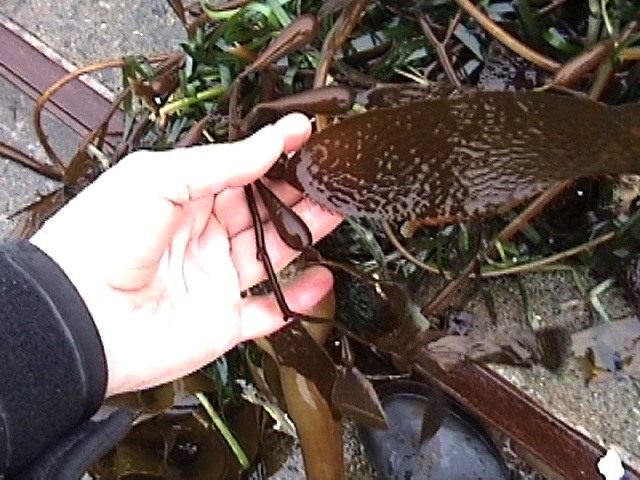 nergy transfer process involving macroalgae is often made possible by winds tearing up the algae and depositing them in drifts on the shore. Here decomposition can contribute to a whole web of organisms. In this photo, the giant kelps, Nereocystis and Macrocystis as well as sea grasses have ended up on the shore of Race Rocks.The Macrocystis grows miles from this area and so this represents a transfer of energy from another ecosystem. Further, the early winds of autumn often send shreds of algae to the benthic community where they are food for sea urchins and other invertebrates, an important part of the energy flow in the community.
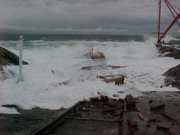
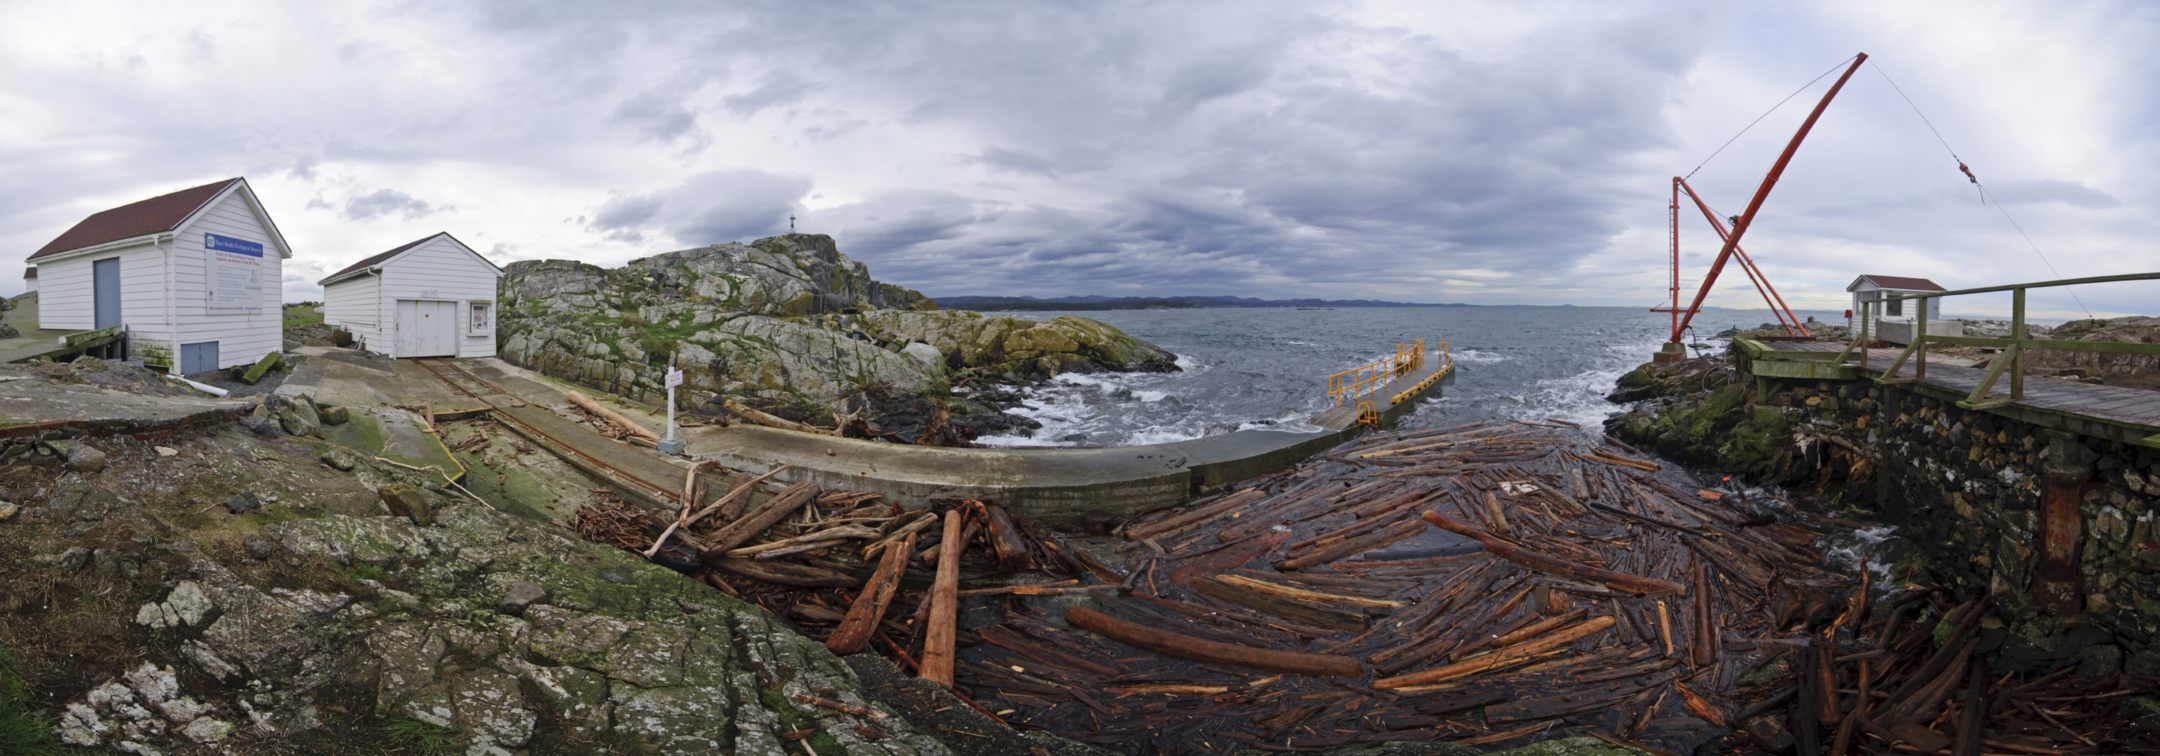 Ryan took this panoramic picture after one of the storms from the north east in the winter of 2009. The impact of logs striking an intertidal community can be considerable. Mussels and gooseneck barnacles are easily impacted if the shoreline is exposed in such a storm. In this area, large boulders even move in the deeper water out at the end of the Jetty.
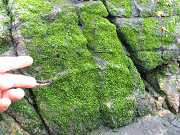 Some organisms like these Prasiola algae depend on the salt spray to keep them moistened as they are located above the high tide level. The distribution of lichen on the shore is often in direct relationship to the amount of salt spray from the wind that it receives.
See the file on the effects of salinity as an abiotic factor.
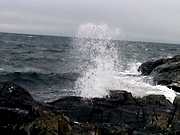
Wind also is one of the components causing swell and surge. Often the wind that causes this, is far out in the Pacific, and may not be directly felt at the islands. However, the delayed effect of the resulting ground-swell surge, sometimes days after a storm in the Pacific, is an important factor in determining habitats and ecological niches of organisms.
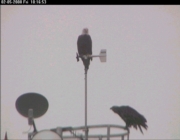
Here’s a rather unusual way in which eagles interact with the wind (anemometer)
ARCHIVED RECORDS OF YEARLY WIND DATA in KNOTS 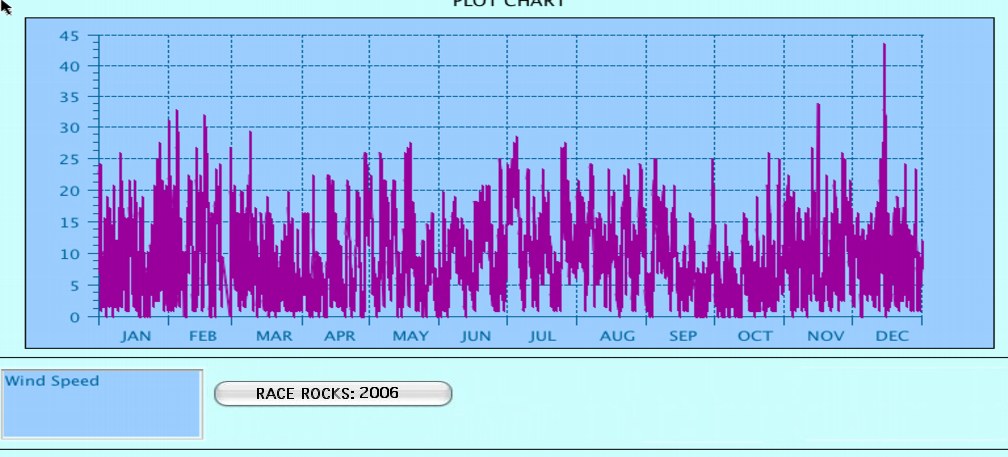
WInd DIRECTION DATA: The Davis Instrument samples the wind direction reading a number of times during the interval (the actual number depends on the archive interval. If wind speed is greater than 0 when the WeatherLink samples wind direction, it places a “marker” into one of sixteen “bins” that correspond to the sixteen compass points. At the time of the archive, the WeatherLink software determines which bin contains the most markers and writes the corresponding wind direction to the archive memory as the dominant wind direction.
Data: Wind Chill Wind chill is not stored in archive memory, rather it is calculated as the data gets written to the database file. The software calculates wind chill based on the temperature and wind speed readings for the archive period (that is, the temperature at the end of the archive interval and the average wind speed during the interval). WeatherLink uses the Osczevski (1995) equation to calculate wind chill. This is the method adopted by the US National Weather Service in September of 2001.
For examples of correlation of wind speed and pressure.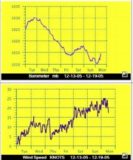 Go to this file where we keep records recorded in past months which may show this negative correlation .
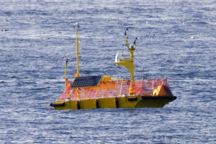 Wind Assessment Test in the Strait of Juan de Fuca by Race Rocks, : Axys Technologies, 2009
 THE PERFECT STORM: On Dec 10, 2006, a particularly heavy storm hit Race Rocks. This file shows some of the extreme weather events measured that day.
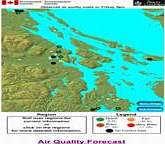 <–-Map of Greenhouse Gas emissions . Air Quality ratings of ‘Good’, ‘Fair’, ‘Poor’, and ‘Very Poor’ Correspond to air Quality Ranges of 0-25, 26-50, 51-100 and greater than 100 respectively. Forecasts are for outdoor locations and may not be valid for areas impacted by emissions from exceptional events such as wildfires or dust storms. Click on the southern Vancouver Island area for the forecasts from Royal Roads, the station closest to Race Rocks. This Link is from the Env.Canada Website.
Storm Videos Dec. 11 2006
de Fuca, 2001, IOS,Sidney, BC.
Additional Reference: Effects of local and global change on an inland sea: the Strait of Georgia, British Columbia, Canada, Johannessen and MacDonald, DFO
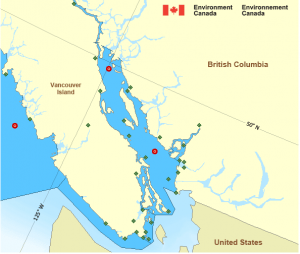
Current wind Data from other Coastal Stations around Southern Vancouver Island