Larus californicus: California Gull

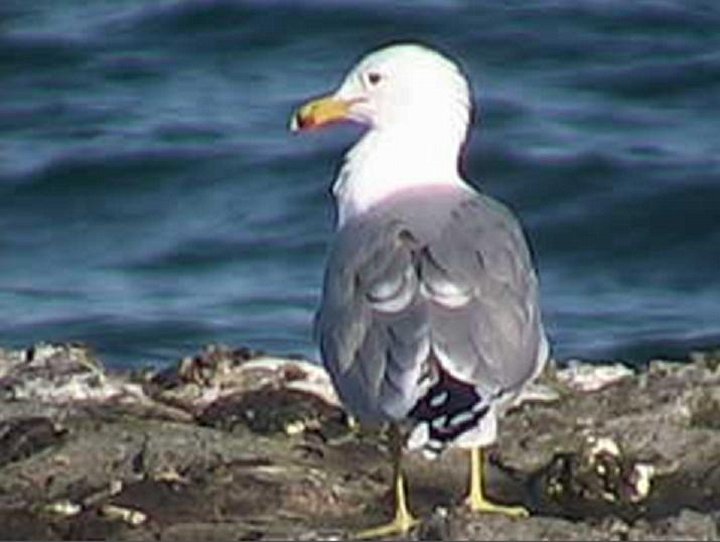
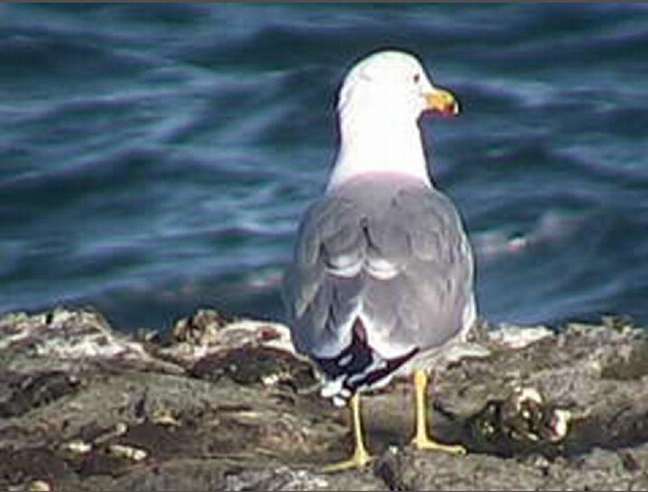
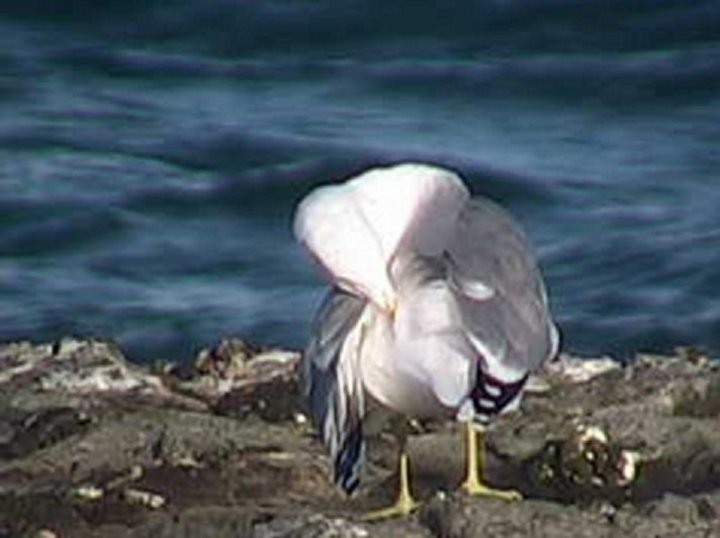
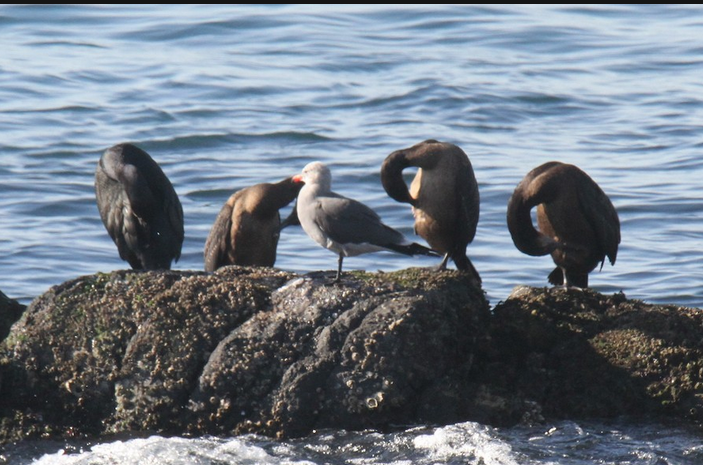
In March 2010 Pam Birley captured this gull with the remote camera. She wrote “I saw a California gull recently and attach pics.  You don’t seem to have any in the taxonomy pages.   It’s not a rare gull but this maybe the first I have seen at RR.” Indeed it is one of those gulls which has fallen through the cracks so this is a rather late addition to our taxonomy.

This adult plumage is reached after 4 years. Note the black tip on the bill and the yellow legs which distinguish it from the Western Gull.
Domain Eukarya
Kingdom Animalia
Phylum Chordata
Sub-Phylum Vertebrata
Class Aves
Order Charadriiformes
Family Laridae
Genus Larus
Species californicus
Common Name: California Gull

Other Members of the Class Aves at Race Rocks.
taxonomyiconReturn to the Race Rocks Taxonomy
and Image File
pearsonlogo2_f2The Race Rocks taxonomy is a collaborative venture originally started with the Biology and Environmental Systems students of Lester Pearson College UWC. It now also has contributions added by Faculty, Staff, Volunteers and Observers on the remote control webcams. March 10 2010- Pam Birley

Larus hyperboreus: Glaucous Gull — The Race Rocks Taxonomy

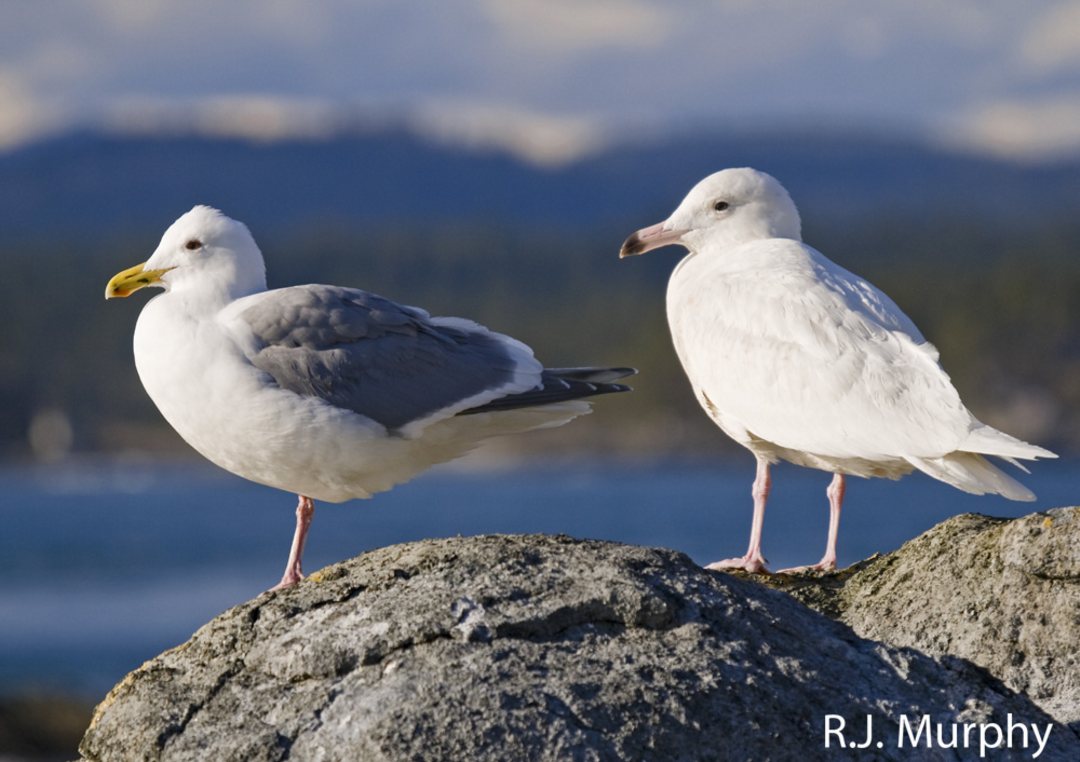
A photo of the rare second year Glaucous Gull on the right, Western Gull on the left. Photo March 8, 2009 by RyanThis is only the third record for this area in the Rocky Point Bird Observatory records.

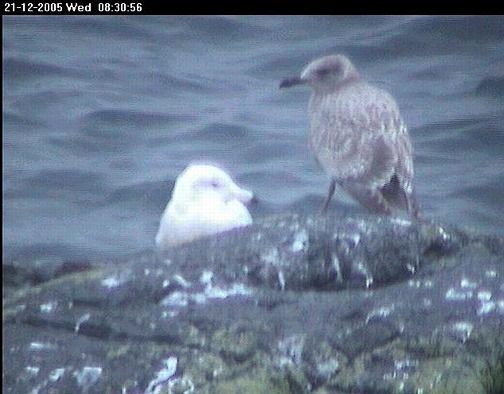
Probable identification of the white gull on the left is the immature Glaucous gull. The gull on the right is an immature Glaucous-winged gull (photo 21st Dec 2005..camera 5 by Pam Birley)

To the left: This is a tentative identification. If it is correct, according to David Allinson of the Rocky Point Bird Observatory, ” this probably represents only the second record for Glaucous Gull (a 1st winter bird) for Rocky Point’s checklist (and a first for Race Rocks too!). The big head, the large bubble-gum pink dark-tipped bill, and white head and body (at least what can be seen) seems to be diagnostic.
However, to be cautious I should only say probable as we cannot see all of the bird.”
This is one of the largest species of gull. It can be up to 66-81 cm. in length. It nests on the tundra, and the range is circumpolar.It moves South in winter but only small numbers reach as far as the Pacific Northwest.”

Domain Eukarya
Kingdom Animalia
Phylum Chordata
Sub-Phylum Vertebrata
Class Aves
Order Charadriiformes
Family Laridae
Genus Larus
Species hyperboreus
Common Name:
Glaucous Gull


Other Members of the Class Aves at Race Rocks.
taxonomyiconReturn to the Race Rocks Taxonomy
and Image File
pearsonlogo2_f2The Race Rocks taxonomy is a collaborative venture originally started with the Biology and Environmental Systems students of Lester Pearson College UWC. It now also has contributions added by Faculty, Staff, Volunteers and Observers on the remote control webcams.
October 2006 Pam Birley

Bird List and Census by D.Donnecke

Daniel Donnecke has contributed his images and counts from a visit to race Rocks on October 30 to ebird.org

https://ebird.org/checklist/S61055064


Archive of Salinity Recorded at Race Rocks 1926 to Present

Year   Jan  Feb March  April  May  June  July  Aug  Sept Oct Nov Dec

1936 ——- ——- ——— ——— ——— ——— ——- ——- ———– 31.36  31.65  31.54
1937  31.66  31.76  31.55  31.36  31.26  31.10  30.94  31.13  31.18  31.29  30.88  30.82
1938  30.60  30.70  30.80  31.21  31.11  31.18  30.87  31.34  31.24  31.65  31.54  31.41
1939  31.07  31.18  31.44  31.53  31.31  31.05  31.03  30.78  31.34  31.77 —— – 30.93
1940  30.76  30.78  30.60  30.92  30.65  30.60 —— —– —– ——- ——- ——- ——-
1941 —— —— —— —— —— 31.49  31.50  31.25  31.49  31.62  31.45  31.31  30.97
1942  31.18  31.00  31.44  31.58  31.56  31.62  31.25  31.11  31.32  31.80  31.73  31.46
1943  31.43  31.33  31.69  31.28  31.53  31.51  31.34  31.12  31.20  31.46  31.53  31.60
1944  31.60  31.57  31.80  31.91  31.80  32.10  31.81  31.89  31.77  31.68  31.70  31.49
1945  31.37  31.21  31.51  31.58  31.78  31.65  31.60  31.54  31.67  31.82  31.88  31.56
1946  31.12  31.30  31.19  31.43  31.39  31.06  30.76  30.95  31.44  31.54  31.80  31.26
1947  31.69  31.24  31.53  31.72  31.63  31.28  31.43  31.08  31.48  31.66  31.24  31.34
1948  31.07  31.42  31.40  31.53  31.32  30.83  30.46  31.13  31.12  31.19  31.45  31.03
1949  31.40  31.56  31.34  31.59  31.37  31.29  31.88  31.61  31.45  31.60  31.50  31.08
1950  31.14  31.12  30.79  31.01  31.34  31.31  30.95  31.06  31.20  31.05  30.91  30.34
1951  30.21  30.22  30.69  31.34  31.54  31.13  31.37  31.27  31.61  31.67  31.53  31.20
1952  31.39  31.00  31.33  31.60  31.65  31.30  31.12  31.47  31.48  31.44  31.79  31.58
1953  30.79  30.52  31.38  31.45  31.44  31.21  31.20  31.00  31.14  31.37  31.26  30.63
1954  30.47  30.56  30.76  31.06  31.41  31.41  30.74  30.76  30.67  30.87  30.73  30.49
1955  30.67  30.77  31.37  31.41  31.57  31.27  31.27  30.89  30.94  31.39  30.78  30.79
1956  30.50  31.10  31.02  31.21  31.27  30.85  30.56  31.15  31.33  31.28  31.14  31.01
1957  31.22  31.30  31.17  31.28  31.44  31.20  31.15  31.35  31.24  31.12  31.35  31.29
1958  31.05  30.82  30.89  31.01  31.01  30.78  30.53  31.04  31.22  31.05  30.96  30.86
1959  30.75  30.66  30.99  31.04  31.20  31.19  30.57  30.83  31.14  30.99  31.07  30.91
1960  30.99  30.85  31.16  31.14  31.13  31.06  30.66  31.02  31.04  31.21  31.15  30.84
1961  30.63  30.65  30.43  30.75  30.99  30.52  30.60  31.08  31.42  31.56  31.52  31.35
1962  31.22  31.29  31.49  31.66  31.44  31.52  31.28  31.31  31.07  31.48  31.13  30.74
1963  30.75  30.98  31.04  31.08  31.19  31.26  31.16  31.18  31.36  31.33  31.00  30.79
1964  30.67  30.70  31.15  31.42  31.68  31.49  30.85  30.75  31.14  31.22  31.31  31.16
1965  30.47  30.86  31.21  31.61  31.51  31.24  31.65  31.55  31.40  31.77  31.25  30.98
1966  30.83  30.87  31.03  31.13  31.35  31.45  31.35  31.14  31.42  31.50  31.62  31.07
1967  30.86  30.75  30.94  30.98  31.36  31.08  30.56  30.92  31.05  31.26  30.83  31.15
1968  30.93  30.64  30.69  30.85  31.28  31.02  30.64  30.96  31.09  31.23  31.01  30.67
1969  30.55  30.75  30.94  31.08  31.06  30.83  30.86  31.20  31.07  31.12  31.42  31.15
1970  31.00  30.74  31.05  31.50  31.71  31.24  31.19  31.65  31.79  32.10  31.84  31.42
1971  31.25  31.04  31.10  30.91  31.06  31.12  30.81  30.59  30.73  31.21  31.57  31.05
1972  30.94  30.89  30.05  30.27  30.69  30.33  29.82  30.40  30.84  31.37  31.80  31.53
1973  31.25  31.09  31.45  31.66  31.94  31.77  31.30  31.62  31.83  31.95  31.64  31.12
1974  31.14  30.92  30.97  31.21  31.55  31.06  30.92  30.53  31.32  31.75  32.11  31.81
1975  31.75  31.61  31.59  32.00  32.14  32.17  31.82  31.69  31.69  32.12  31.42  30.91
1976  30.85  31.07  31.08  31.34  31.56  31.65  31.51  31.34  30.72  30.72  31.13  31.26
1977  31.20  31.40  30.86  31.59  31.46  31.24  31.54  30.97  31.31  31.67  31.52  30.73
1978  30.75  30.67  30.73  30.91  31.29  31.29  31.15  31.53  31.20  31.18  31.25  31.69
1979  31.44  31.24  31.41  31.60  31.56  31.59  31.45  31.63  31.52  31.45  31.45  31.50
1980  31.07  31.48  31.38  31.71  31.71  32.01  31.92  31.78  31.93  31.94  32.06  31.75
1981  31.15  31.41  31.16  31.62  31.88  31.90  32.15  32.25  32.29  32.03  31.61  31.25
1982  31.20  31.08  30.77  31.07  31.55  31.71  31.57  31.29  31.33  31.42  31.21  30.85
1983  30.87  30.57  30.45  30.81  30.93  31.03  31.10  31.01  31.08  31.27  31.06  30.58
1984  30.46  30.54  30.46  30.87  31.35  31.34  31.11  31.46  31.35  31.27  31.02  31.08
1985  31.18  31.21  31.81  31.63  31.93  31.60  31.57  31.87  32.05  31.96  31.45  31.72
1986  31.54  31.16  30.94  31.27  31.64  31.25  31.36  31.17  31.67  31.80  31.82  31.50
1987  30.98  31.02  31.03  31.29  31.43  31.54  31.22  31.67  31.83  31.72  31.87  31.44
1988  31.34  31.40  31.61  31.77  31.70  31.67  31.73  31.83  31.78  31.90  31.59  31.41
1989  31.44  31.42  31.46  31.39  31.89  31.99  31.23  32.47  31.81  32.55  32.12  31.71
1990  31.80  31.54  31.37  31.57  31.76  31.37  31.81  31.21  31.29  31.84  31.43  30.56
1991  30.99  30.95  30.92  30.87  31.60  30.85  30.98  31.26  31.07  31.21  31.46  31.17
1992  30.96  30.51  30.75  31.12  30.90  31.00  30.92  30.56  30.88  31.12  30.91  30.52
1993  30.62  30.35  30.51  30.83  30.71  30.21  30.50  30.76  30.78  30.97  31.10  30.85
1994  30.84  30.64  30.73  31.78  31.53  31.85  31.04  31.34  31.22  31.44  31.57  31.29
1995  30.83  30.76  30.79  30.82  31.02  31.09  30.82  31.23  31.32  31.55  31.25  30.40
1996  30.26  30.20  30.36  30.71  30.84  31.04  30.44  30.88  31.18  31.33  31.27  30.76
1997  30.53  30.41  30.73  30.64  30.43  30.58  30.34  29.90  30.74  30.58  30.49  30.52
1998  30.62  30.39  30.50  30.57  31.08  30.66  30.89  30.92  31.04  31.34  31.20  30.79
1999  30.58  30.32  30.58  30.68  30.73  30.72  30.24  30.29  30.06  30.80  31.26  30.71
2000  30.82  30.80  30.91  31.17  31.07  30.90  30.55  30.70  30.78  30.96  31.25  31.40
2001  31.37  31.19  31.67  31.82  31.79  31.81  31.42  31.37  31.32  31.61  31.49  31.07
2002  30.84  30.81  31.17  31.35  31.41  31.31  30.82  30.76  31.28  31.38  31.75  31.43
2003  31.01  31.05  30.91  30.73  31.17  30.80  31.16  31.21  31.45  31.69  31.05  31.09
2004  30.92  30.71  30.99  31.15  31.25  31.38  31.15  31.38  31.48  31.15  31.17  31.11
2005  30.92  30.58  31.05  31.12  31.11  31.15  30.83  30.83  31.16  31.41  31.17  31.21
2006  30.80  30.23  31.19  31.21  31.08  31.09  30.81  31.00  31.48  31.54  31.15  30.98
2007  30.65  30.80  30.84  30.83  30.82  30.88  30.65  30.48  30.79  31.23  31.09  31.10
2008  30.76  30.86  31.06  31.20  31.50  31.19  31.31  31.30  31.13  31.53  31.23  31.53
2009  31.25  31.52  31.43  30.04  30.50  31.31  31.23  31.39  30.97  31.32  31.27  30.90
2010  30.95  30.84  31.04  30.98  31.32  31.00  30.62  31.01  31.23  31.26  31.47  31.28
2011  30.57  30.92  30.85  30.75  30.76  30.75  30.34  30.46  30.86  30.99  31.47  31.20
2012  31.30  31.31  31.06  30.84  30.69  31.12  30.56  30.39  30.59  31.10  30.92  30.54
2013  30.54  31.10  31.27  31.27  31.42  31.09  30.26  31.09  31.00  30.97  31.29  31.45
2014  31.49  31.43  31.01  30.89  31.06  30.54  30.47  30.42  31.00  31.25  30.53  30.39
2015  29.99  30.34  30.47  30.48  30.90  30.77  31.11  31.78  31.46  31.62  31.62  31.36
2016  31.31  30.91  30.74  30.82  30.94  30.88  30.91  30.88  31.66  31.87  31.45  31.62
2017  31.59  31.34  31.31  31.19  31.17  30.99  30.99  31.33  31.67  32.01  31.83  31.39
2018  31.35  31.14  31.30  30.96  31.22  30.72  29.93  30.37  30.93  31.10  31.12  30.96
2019  30.67 ——-  30.85  ——-  ——-   31.25  31.78  31.93 ——  – —— – —– —
Year   -Jan   — Feb    -Mar   -Apr    -May    -Jun  – Jul   -Aug  – Sep  – Oct  –  Nov  –  Dec

Archive of Sea Water Temperatures at Race Rocks 1921-Present

file created: 10-Oct-2019 14:51:44
Monthly Sea Surface Temperature
Race Rocks                       48.2996  123.5318
Year   Jan    Feb    Mar    Apr    May    Jun    Jul    Aug    Sep    Oct    Nov    Dec
1921 999.99   7.13   7.39   7.75   8.53   9.57  10.31  10.53  10.35   9.88   9.21   8.25
1922   6.49   6.20   6.61   7.55   8.35   9.54  10.53  10.34  10.25   9.37   8.42   7.15
1923   7.11   6.46   6.71   7.64   8.61   9.37  10.38  10.60  10.63   9.67   8.72   7.96
1924   7.13   7.39   7.72   7.97   9.05   9.83  10.51  10.37  10.28   9.28   8.83   7.36
1925   6.66   6.91   7.36   8.07   9.22  10.17  11.16  10.86  10.24   9.27   8.39   8.20
1926   7.90   8.04   8.64   9.25  10.10  10.72  11.18  10.90  10.57   9.82   9.15   8.55
1927   7.65   7.44   7.83   8.07   8.86   9.80  10.57  10.91  10.41   9.70   8.67   7.60
1928   6.93   7.33   7.90   8.62   9.79  10.29  10.82  11.00  10.39   9.20   8.62   7.92
1929   7.16   6.41   7.13   7.86   9.07   9.83  10.82  10.82  10.81   9.86   8.84   7.88
1930   6.58   6.66   7.15   8.30   9.38  10.06  10.66  10.89  10.61   9.50   8.65   8.08
1931   7.90   7.90   8.25   8.85   9.90  10.62  11.57  11.18  10.73   9.66   8.64   7.75
1932   7.12   6.83   7.33   8.24   9.33  10.44  10.82  10.98  10.74   9.65   8.92   7.74
1933   7.14   6.73   7.12   8.08   9.14  10.26  10.59  11.53  10.12   9.68   8.64   7.72
1934   7.87   7.99   8.39   9.23  10.04  10.88  10.97  11.70  10.71   9.72   9.25   8.41
1935   7.29   7.27   7.51   7.81   9.21  10.20  10.58  10.59  10.77   9.71   8.23   8.15
1936   7.90   6.76   7.05   7.89   9.32  10.47  11.30  11.32  10.52  10.13   8.62   7.99
1937   6.62   6.49   7.73   8.74   9.95  10.92  11.77  11.53  10.91   9.93   8.51   8.19
1938   7.44   7.29   8.19   9.41  10.63  12.34  12.74  11.91  11.10   9.93   8.64   7.51
1939   7.42   6.67   7.13   8.64  10.32  11.43  12.20  11.15  11.47   9.75 —-      8.58
1940   7.98   8.28   9.06  10.09  11.49  11.69 ——  ——  ——-   ——-  —–  ——
1941   —–   —–    —–    —–  10.07  10.54  11.29  11.05  10.66   9.97   9.07   8.60
1942   7.99   7.91   7.85   8.59   9.70   9.87  10.61  11.03  10.34   9.52   8.44   7.92
1943   6.83   6.71   7.16   8.25   8.89  10.03  10.35  10.68  10.39   9.62   9.06   8.13
1944   7.72   7.54   7.37   8.06   9.29  10.58  11.09  10.92  10.58   9.67   9.24   8.13
1945   7.87   7.79   7.64   8.02   8.87   9.86  10.16  10.58  10.09   9.52   8.18   8.10
1946   7.80   7.38   7.71   8.16   9.48  10.28  10.78  10.81  10.33   9.50   8.16   7.78
1947   7.13   7.08   7.77   8.47   9.53  10.48  10.67  11.00  10.57   9.92   9.12   7.96
1948   7.60   6.97   7.26   7.92   9.02  10.28  10.86  10.74  10.48   9.55   8.21   7.08
1949   6.15   6.13   6.97   8.31   9.45  10.20  10.37  10.30  10.52   9.54   8.77   7.88
1950   6.25   5.87   6.65   7.75   8.72   9.48  10.10  10.43  10.31   9.32   8.58   8.08
1951   7.53   6.95   6.72   8.12   9.25  10.31  10.45  11.09  10.93   9.58   8.53   7.76
1952   6.97   7.13   7.64   8.29   9.02   9.69  10.48  10.54  10.23   9.81   8.69   7.95
1953   7.85   7.96   7.69   8.16   9.33   9.82  10.64  11.07  10.62   9.94   9.35   8.56
1954   7.16   7.35   7.55   7.97   8.80   9.32   9.93  10.08  10.07   9.43   9.16   8.46
1955   7.53   7.20   6.78   7.52   8.42   9.38   9.81  10.26  10.00   9.00   7.58   6.70
1956   6.72   6.43   6.35   7.69   8.79   9.69  10.26  10.46  10.17   9.22   8.12   7.12
1957   6.39   6.24   7.25   8.13   9.38  10.10  10.35  10.51  10.59   9.82   8.90   8.35
1958   8.09   8.31   8.66   9.39  10.38  10.77  11.55  11.56  11.04   9.97   8.77   8.15
1959   7.63   7.45   7.93   9.12   9.77  10.50  11.32  11.08  10.51   9.73   8.37   7.82
1960   7.17   7.52   7.52   8.63   9.67  10.34  11.43  10.80  10.13   9.53   8.67   7.98
1961   7.99   8.21   8.41   8.86   9.41  10.36  11.00  11.32  10.67   9.45   8.30   7.51
1962   7.21   7.36   7.37   8.39   9.33  10.05  10.47  10.53  10.60  10.08   9.41   8.75
1963   7.53   7.55   7.87   8.50   9.68  10.25  10.50  10.85  10.62  10.32   9.99   8.76
1964   8.26   8.00   7.77   8.25   8.85   9.66  10.30  10.50  10.07   9.41   8.34   7.46
1965   6.92   7.11   7.28   8.00   8.90   9.83  10.07  10.21  10.32   9.70   9.21   8.52
1966   7.72   7.61   7.75   8.54   9.05   9.12  10.63  10.75  10.17   9.57   8.76   8.64
1967   7.95   7.75   7.62   8.15   8.91   9.64  10.34  10.59  10.53   9.78   9.15   8.04
1968   7.40   7.36   8.04   8.37   8.78   9.50  10.24  10.25  10.45   9.36   8.82   7.81
1969   6.53   6.39   7.23   8.12   9.13  10.21  10.47  10.51   9.88   9.28   8.73   8.16
1970   7.59   7.78   8.00   8.08   8.76   9.64  10.26  10.30  10.09   9.06   8.38   7.59
1971   7.10   6.94   6.72   7.57   8.58   9.16  10.07  10.67  10.43   9.34   8.30   7.37
1972   6.47   6.29   6.92   7.68   8.82   9.57  10.56  10.69  10.30   9.15   8.47   7.37
1973   7.05   7.27   7.98   8.45   8.70   9.29  10.14  10.40  10.09   9.25   8.25   8.04
1974   7.28   7.24   7.36   8.20   8.56   9.74  10.07  10.93  10.65   9.78   8.61   8.26
1975   7.33   6.81   7.23   7.73   8.73   9.48  10.20  10.42  10.41   9.62   9.28   7.85
1976   7.27   7.07   7.01   7.85   8.75   9.37  10.14  10.16  10.09   9.44   8.69   8.13
1977   7.63   7.98   8.09   8.35   8.83   9.79   9.97  10.89  10.31   9.29   8.62   7.97
1978   7.66   7.96   8.34   8.99   9.45  10.38  10.49  10.91  10.59   9.81   8.22   7.37
1979   6.58   6.90   7.57   8.38   9.54  10.01  10.90  10.77  10.51   9.87   9.08   8.61
1980   7.79   7.66   7.97   8.69   9.50   9.52  10.66  10.95  10.52   9.96   9.30   8.61
1981   8.31   8.39   8.87   9.24   9.47   9.91  10.35  10.59  10.21   9.73   9.38   8.60
1982   7.25   7.51   8.00   8.88   9.99  10.74  11.42  11.80  11.41  10.38   8.81   8.35
1983   8.63   8.67   9.36  10.07  10.65  11.33  11.79  12.46  11.49  10.30   9.54   7.77
1984   7.53   7.86   8.43   9.07   9.74  10.34  11.42  11.60  10.66   9.77   8.56   6.99
1985   6.82   6.88   7.25   8.20   9.63  10.62  11.56  11.64  10.83   9.63   6.89   6.44
1986   7.05   6.68   8.08   8.43   9.48  11.07  10.95  11.84  10.88   9.82   8.46   7.88
1987   7.61   7.99   8.39   8.98   9.82  10.68  11.15  11.57  11.14  10.07   9.08   8.25
1988   7.46   7.53   7.58   8.62   9.70  10.49  11.07  11.41  10.62   9.63   8.77   7.91
1989   7.01   5.87   6.83   8.27   9.51  10.80  11.31  11.24  11.09   9.96   8.96   8.23
1990   8.18   7.72   8.24   9.08   9.90  10.87  11.88  12.14  12.18  10.79   9.97   8.22
1991   7.13   7.80   7.98   8.43   9.79   9.78  10.83  11.09  11.24  10.14   8.93   8.31
1992   7.97   8.18   9.50   9.51  10.26  10.80  11.13  11.45  11.02  10.01   9.10   7.81
1993   6.71   6.79   7.68   8.70   9.78  10.85  11.07  11.20  11.00  10.19   8.58   7.92
1994   8.05   7.46   8.61   9.31  10.13  10.62  11.63  11.59  11.36  10.75   9.38   8.41
1995   8.27   8.63   8.86   9.22  10.21  11.21  11.88  11.53  11.38  10.26   9.42   8.91
1996   8.26   7.87   8.47   9.22  10.06  10.41  11.51  11.50  10.59   9.91   8.76   7.68
1997   7.75   7.95   8.10   9.02  10.35  10.98  11.77  12.26  11.66  11.39  10.00   9.31
1998   8.75   9.28   9.77  10.00  10.44  11.41  11.78  12.34  12.11  10.70   9.87   9.00
1999   8.07   7.80   8.17   8.91   9.58  10.48  11.12  11.57  11.91  10.14   9.01   8.52
2000   7.57   7.74   8.20   9.11  10.08  11.16  11.35  11.72  11.44  10.36   9.02   8.02
2001   7.93   7.73   8.10   8.80   9.75  10.68  11.33  11.41  11.40  10.23   9.25   8.36
2002   8.11   7.91   7.79   8.80   9.46  10.54  11.28  11.78  11.36  10.08   9.09   8.84
2003   8.87   8.54   8.74   9.29   9.96  10.98  11.39  11.49  11.41  10.93   8.99   8.47
2004   7.87   7.91   8.34   9.11  10.46  11.10  11.87  11.97  11.30  10.65   9.49   8.67
2005   7.75   8.01   8.84   9.48  10.71  11.22  11.69  12.17  11.50  10.40   9.53   8.40
2006   8.61   8.49   8.41   8.75  10.08  10.87  11.66  12.09  11.49  10.55   9.29   8.54
2007   7.84   7.78   7.86   8.95  10.03  10.19  11.23  11.66  11.03  10.01   8.97   8.03
2008   7.46   7.33   7.68   8.06   9.36   9.78  10.84  11.30  11.16  10.14   9.39   7.87
2009   7.29   7.20   7.46   8.35   9.54  10.39  11.44  11.74  11.80  10.62   9.35   7.70
2010   8.11   8.69   9.12   8.96   9.45  10.36  11.16  11.93  11.08  10.37   8.98   8.06
2011   7.77   7.49   7.77   8.53   9.32  10.35  10.76  11.38  11.17  10.14   8.66   8.01
2012   7.29   7.35   7.63   8.73   9.82   9.76  10.37  10.98  10.93   9.66   8.85   8.32
2013   7.64   7.44   7.48   8.27   9.05   9.72  10.96  10.76  10.65  10.10   8.69   7.68
2014   7.63   7.25   7.90   8.80   9.72  10.30  10.79  11.36  11.20  10.72  10.14   9.03
2015   8.75   9.00   8.96   9.40   9.88  11.17  11.97  12.23  11.30  10.55   9.61   9.01
2016   8.45   8.77   9.05   9.71  10.21  11.16  11.90  12.52  11.27  10.40  10.42   8.63
2017   6.96   7.03   7.94   9.08  10.24  11.21  11.70  11.87  11.29  10.15   9.10   8.45
2018   8.06   7.71   8.00   8.81  10.31  10.63  11.40  11.50  11.11  10.27   9.54   8.72
2019   8.45  —-    8.96  10.05  10.87  10.98  11.26   10.85   ——-    —–   —–  ——
Year   Jan       Feb     Mar      Apr    May    Jun    Jul     Aug     Sep    Oct      Nov     Dec

Article on Race Rocks and Garry Fletcher, October, 2019

 GARRY FLETCHER

Marine science teacher and Race Rocks champion

BY MARIANNE SCOTT

To visit Garry Fletcher at his home requires a drive through the countryside of south Vancouver Island that seems hundreds of miles from the cities that house most of us. His house in Metchosin, near his son’s organic market farm, looks out over sheep trimming the meadow bordering the Juan de Fuca Strait. An espaliered kiwi vine hugs the deck, nectarine and peach trees provide fresh fruit, rhubarb thrives and herbs enliven meals. Garry grew up on a small Saskatchewan farm; it mixed growing food with raising cattle. Farm life inspired his interest in biology, which he studied at the University of Saskatchewan in Saskatoon. After earning a master’s degree in science curriculum, he taught in Swift Current where he met his wife Helen, who taught English. He was then invited to teach biology at the United Nations International School in New York.“They offer an internationally recognized baccalaureate degree,” he said.“But in 1976, after being mugged in the city, we accepted an offer to come to Pearson College, in Metchosin, thinking we’d be here for, maybe, four years.” But Pearson, its students, curriculum and nautical location ensnared him and he and his family have never left.

PEARSON COLLEGE is a special place. Located on south Vancouver Island’s Pedder Bay, it’s one of 18 United World Colleges and offers a two-year pre-university baccalaureate diploma that covers grade 12 and a gap year for up to 200 students.These students, who represent more than 150 countries, live, study and grow together. Pearson’s mission is to “make education a force to unite people, nations and cultures for peace and a sustainable future.”

At Pearson, Garry began teaching biology, marine science and scuba diving. Jack Matthews, the then College head, gave teachers great freedom to develop their own sphere.“I was able to build an interdisciplinary marine science course that included chemistry, physics and biology,” Garry recalls.“We have this unique situation here at Pearson. Fresh and saltwater, marine ecosystems, forests. I took the class diving, 15 on a boat. We had substantial blocks of time.”
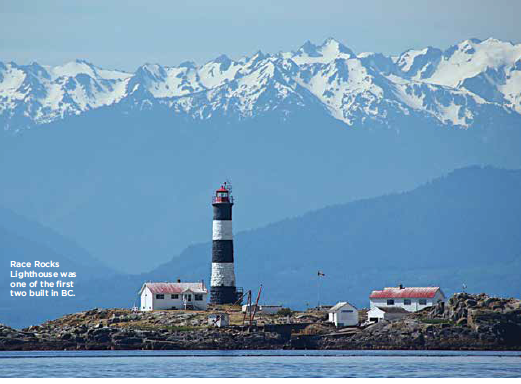
Meeting Trevor and Flo Anderson, lighthouse keepers at Race Rocks, further revolutionized his teaching and interests. Race Rocks, an archipelago of nine jagged islets lying eight miles from Victoria, is the southernmost point of Pacific Canada.The islands are the pinnacles of a large underwater mountain. The lighthouse was the second to operate in BC and was constructed of Scottish granite brought as ballast aboard British sailing ships.The Rocks are named after the passage separating it from Vancouver Island and has a tidal race reaching seven knots. When strong tides and winds oppose each other, standing waves can grow to 10 feet.The upwelling from the currents provides an exceptionally abundant environment for animal and plant life. Some of the islets are favourite perches for Steller and California sea lions, and elephant seals and harbour seals sunbathe here.

“My philosophy of teaching is to instill the concept of ecosystems’ integrity and sustainability,” Garry says.“I explain we’re not on a chain, we’re in a life web. I ask students to  assess their project’s sustainability. Does it have biological integrity? Does it impact the food web or energy flows? What services do ecosystems provide? We must weigh what things will look like in 100 years, not just next year.”

THE LIGHTHOUSE KEEPERS welcomed Garry and students to Race Rocks.“The Andersons knew the uniqueness of the region,”he says.“We dived near the rocks, although with the currents, it could be dangerous. We surveyed and created maps of underwater marine life and collected data on birds and marine wildlife.”

In 1980, this work led to connections with the predecessor to the Ministry of Environment. That ministry managed the “Ecological Reserves” program—areas set aside because of their exceptional natural features, and for their scientific and educational significance. Garry and his students asked the Ministry to add Race Rocks to the list of protected areas.

“Remarkably,”says Garry, grinning,“Prince Charles, the United World Colleges’ chair, came here for a board meeting. We told the ministry the Prince might announce that Race Rocks had become an ecological reserve. Our proposal was approved in record time.”Garry began serving as the Race Rocks Ecological Reserve warden and reported on the Pearson team’s ongoing research. He urges others to propose ecological reserves and has developed an“adopt an ecosystem”template to develop proposals, which can be found online.

MEANWHILE, A MICROWAVE tower delivering live video of island life was built.Two cameras still run today.

Race Rocks Lighthouse was one of the first two built in BC. Race Rocks Lighthouse was one of the first two built in BC. islands are too small for visitors,” says Garry.“So Pearson grad Ken Dunham developed the network that allowed live- streaming internet video—one of the first such projects in North America. During an Apple conference in New York, I was in a boat off Race Rocks live webcasting with a diver filming underwater (Apple later provided access to live streaming on their network). Our students were very hands-on and we delivered other live webcasts of Race Rocks’ intertidal and subtidal zones to schools. It was new and exciting at the time.”

IN THE ‘90S, David Scott (disclosure—my husband) and Ged McLean and grad students from the University of Victoria’s Institute for Integrated Energy Systems took on separate research studies on the feasibility of obtaining electricity from solar, wind and tidal energy at Race Rocks.“These were tests to determine if any of these alternative energy sources were feasible in this natural laboratory,” says Garry.

A BC ministry funded the solar panels and, with an array of batteries, provided the electricity to help power the islands, thereby reducing the diesel needed to run generators. With additional collectors, they still function today. “The 40 solar panels generate enough power in the summer to make the islands energy self-sufficient,” explains Garry. Solar was judged to be more practical than wind and no windmills were built.

THE CLEAN Current Tidal Power Demonstration Project at Race Rocks was the first such project in Canada and the sponsor, EnCana, wanted to assess if the turbine placed in Race Passage could produce electricity during both ebb and flood currents. UVic and Pearson students collaborated on the project.“This was a case study,” says Garry. “Our students dove often to apply coatings that might prevent fouling of the turbine’s blades.”

Alas, the experiment was discontinued after six years. Photos show that giant barnacles and other ocean life had colonized the turbine. “It was just too expensive to maintain,” says Garry.

Pearson continues its protection of Race Rocks. After the federal government destaffed the lighthouse, the College signed a long-term lease and pays for an eco-guardian to provide a constant human presence on the island.

GARRY, now retired, has been recognized for his imaginative and enthusiastic use of technology in the classroom. He’s active in environmental issues. He condemns the doubling of the Trans Mountain Pipeline and has been an intervenor at the National Energy Board hearings. He cultivates and sells mason bees to augment the population of pollinating insects. He’s analyzed the Race Rocks’ water temperature and salinity data collected since 1921.

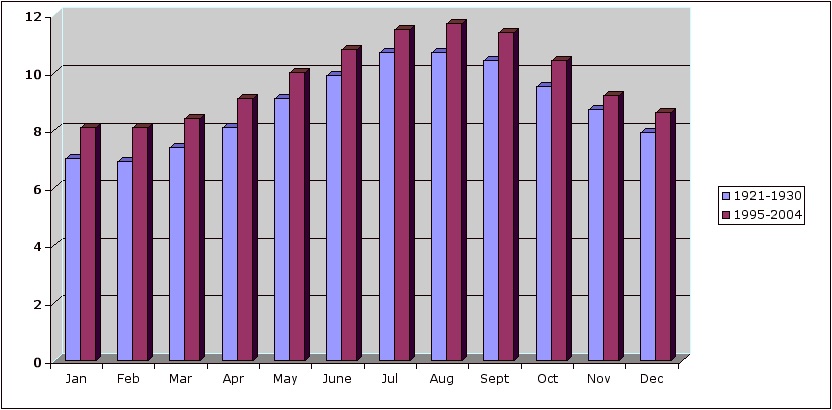
“Every month, the median temperature is at least one degree Celsius higher than in 1921,” he warns. As a part of a UVic research program, he’s installed malaise traps on his property to help establish baseline data on insect biomass.

Further reading:
metchosinmarine.ca
ecoreserves.bc.ca
racerocks.ca
gfletcher.ca

Decade Comparisons:Sea Surface Temperature at Race Rocks-

Link to Race Rocks Mean Monthly Sea Temperature 1921-present,

Monthly temperature averages in degrees Celsius for Race Rocks
1921 1922 1923 1924 1925 1926 1927 1928 1929 1930 Average Month
Jan 6.4 7.1 7.1 6.6 7.8 7.6 6.9 7.1 6.5 7.0 Jan
Feb 7.1 6.1 6.4 7.3 6.9 8 7.4 7.3 6.3 6.6 6.9 Feb
Mar 7.3 6.6 6.7 7.7 7.3 8.6 7.8 7.8 7.1 7.1 7.4 Mar
Apr 7.7 7.5 7.6 7.9 8 9.2 8 8.6 7.8 8.2 8.1 Apr
May 8.5 8.3 8.6 9 9.2 10.1 8.8 9.7 9 9.3 9.1 May
June 9.5 9.5 9.3 9.8 10.1 10.7 9.8 10.2 9.8 10 9.9 June
Jul 10.3 10.5 10.3 10.5 11.1 11.1 10.5 10.8 10.8 10.6 10.7 Jul
Aug 10.5 10.3 10.5 10.3 10.8 10.9 10.9 10.9 10.8 10.8 10.7 Aug
Sept 10.3 10.2 10.6 10.2 10.2 10.5 10.3 10.3 10.7 10.6 10.4 Sept
Oct 9.8 9.3 9.6 9.2 9.2 9.8 9.7 9.2 9.8 9.4 9.5 Oct
Nov 9.1 8.4 8.7 8.8 8.3 9.1 8.6 8.6 8.8 8.6 8.7 Nov
Dec 8.2 7.1 7.9 7.3 8.2 8.5 7.6 7.9 7.8 8 7.9 Dec
8.8 Decade
average
Average
1995 1996 1997 1998 1999 2000 2001 2002 2003 2004
Jan 8.2 8.2 7.7 8.7 8 7.5 7.9 8.1 8.8 7.8 8.1 Jan
Feb 8.6 7.8 7.9 9.2 7.8 7.7 7.7 7.9 8.5 7.9 8.1 Feb
Mar 8.8 8.4 8.1 9.7 8.1 8.1 8.1 7.7 8.7 8.3 8.4 Feb
Apr 9.2 9.2 9 9.9 8.9 9.1 8.7 8.7 9.2 9.1 9.1 Apr
May 10.2 10 10.3 10.4 9.5 10 9.7 9.4 9.9 10.4 10.0 May
June 11.2 10.4 10.9 11.4 10.4 11.1 10.6 10.5 10.9 11 10.8 June
Jul 11.8 11.5 11.7 11.7 11.1 11.3 11.3 11.2 11.3 11.8 11.5 Jul
Aug 11.5 11.5 12.2 12.3 11.5 11.7 11.4 11.7 11.4 11.9 11.7 Aug
Sept 11.3 10.5 11.6 12.1 11.9 11.4 11.4 11.3 11.4 11.2 11.4 Sept
Oct 10.2 9.9 11.3 10.7 10.1 10.3 10.2 10 10.9 10.6 10.4 Oct
Nov 9.4 8.7 9.9 9.8 9 9 9.2 9 9 9.4 9.2 Nov
Dec 8.9 7.6 9.3 9 8.5 8 8.3 8.8 8.5 8.6 8.6 Dec
9.8 Decade
Average
This analysis has been done by Garry Fletcher using the monthly averages of the daily temperatures.
See this file for the complete set of monthly data1921 to present
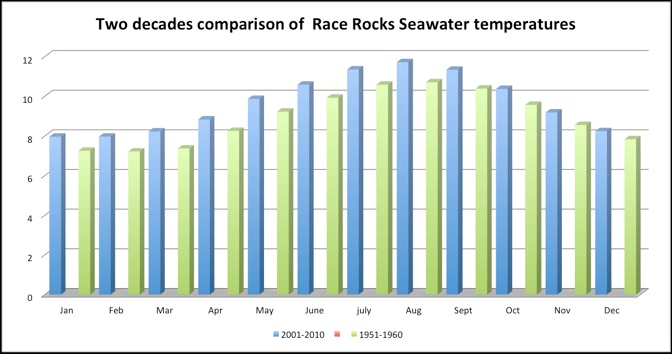
The following is a comparison between 1951-1960 and 2001-2010

Jan Feb Mar Apr May Jun Jul Aug Sept Oct Nov Dec
1951 7.5 6.9 6.7 8.1 9.2 10.2 10.4 11.1 10.9 9.5 8.5 7.7
1952 6.9 7.1 7.6 8.2 9 9.6 10.4 10.5 10.2 9.8 8.6 7.9
1953 7.8 7.9 7.6 8.1 9.3 9.8 10.6 11 10.6 9.9 9.3 8.5
1954 7.1 7.3 7.5 7.9 8.7 9.3 9.9 10 10 9.4 9.1 8.4
1955 7.5 7.1 6.7 7.5 8.4 9.3 9.8 10.2 10 8.9 7.5 6.6
1956 6.7 6.4 6.3 7.6 8.7 9.6 10.2 10.4 10.1 9.2 8.1 7.1
1957 6.3 6.2 7.2 8.1 9.3 10 10.3 10.5 10.5 9.8 8.8 8.3
1958 8 8.3 8.6 9.3 10.3 10.7 11.5 11.5 11 9.9 8.7 8.1
1959 7.6 7.4 7.9 9.1 9.7 10.4 11.3 11 10.4 9.7 8.3 7.8
1960 7.1 7.5 7.5 8.6 9.6 10.3 11.4 10.8 10.1 9.5 8.6 7.9
Mean 7.25 7.21 7.36 8.25 9.22 9.92 10.58 10.7 10.38 9.56 8.55 7.83

2001 7.9 7.7 8.1 8.7 9.7 10.6 11.3 11.4 11.4 10.2 9.2 8.3
2002 8.1 7.9 7.7 8.7 9.4 10.5 11.2 11.7 11.3 10 9 8.8
2003 8.8 8.5 8.7 9.2 9.9 10.9 11.3 11.4 11.4 10.9 9 8.5
2004 7.8 7.9 8.3 9.1 10.4 11 11.8 11.9 11.2 10.6 9.4 8.6
2005 7.7 8 8.8 9.4 10.7 11.2 11.6 12.1 11.5 10.4 9.5 8.3
2006 8.61 8.49 8.41 8.75 10.08 10.86 11.66 12.09 11.49 10.55 9.29 8.5
2007 7.8 7.9 7.9 9 10 10.2 11.2 11.6 11 10 9 8
2008 7.46 7.33 7.68 8.06 9.36 9.77 10.84 11.3 11.16 10.14 9.39 7.87
2009 7.29 7.2 7.5 8.4 9.54 10.4 11.4 11.74 11.8 10.5 9 7
2010 8.11 8.68 9.12 8.96 9.54 10.36 11.16 11.93 11.08 10.37 8.98 8.5
Mean 7.95 7.96 8.22 8.82 9.862 10.58 11.34 11.71 11.33 10.36 9.17 8.24

Monthly Means
2001-2010 1951-1960
Jan 7.96 7.25
Feb 7.96 7.21
Mar 8.22 7.36
Apr 8.83 8.25
May 9.86 9.22
June 10.58 9.92
july 11.34 10.58
Aug 11.71 10.7
Sept 11.33 10.38
Oct 10.36 9.56
Nov 9.17 8.55
Dec 8.24 7.83

See also https://www.env.gov.bc.ca/soe/indicators/climate-change/sea-surface-temperature.html

Archive of Seawater Temperature Data 1921 to present

Note, The blanks for the years 1940-41 are due to the Second World War. Apparently during that time, data was not collected by a lightkeeper.Original data was sent by the Lightkeepers and now by the Marine Protected Area Guardian of Race Rocks to the Institute of Ocean Sciences where it is compiled and displayed at
http://www.pac.dfo-mpo.gc.ca/science/oceans/data-donnees/lighthouses-phares/index-eng.htm
Decade analysis by G. Fletcher.. NOTE probable evidence of climate change
Race Rocks Light Station: 48.2996 123.5318


Year Jan Feb Mar Apr May Jun Jul Aug Sep Oct Nov Dec
1921  — 7.13 7.39 7.75 8.53 9.57 10.31 10.53 10.35 9.88 9.21 8.25
1922 6.4 6.1 6.6 7.5 8.3 9.5 10.5 10.3 10.2 9.3 8.4 7.1
1923 7.1 6.4 6.7 7.6 8.6 9.3 10.3 10.5 10.6 9.6 8.7 7.9
1924 7.1 7.3 7.7 7.9 9 9.8 10.5 10.3 10.2 9.2 8.8 7.3
1925 6.6 6.9 7.3 8 9.2 10.1 11.1 10.8 10.2 9.2 8.3 8.2
1926 7.8 8 8.6 9.2 10.1 10.7 11.1 10.9 10.5 9.8 9.1 8.5
1927 7.6 7.4 7.8 8 8.8 9.8 10.5 10.9 10.3 9.7 8.6 7.6
1928 6.9 7.3 7.8 8.6 9.7 10.2 10.8 10.9 10.3 9.2 8.6 7.9
1929 7.1 6.3 7.1 7.8 9 9.8 10.8 10.8 10.7 9.8 8.8 7.8
1930 6.5 6.6 7.1 8.2 9.3 10 10.6 10.8 10.6 9.4 8.6 8
1931 7.8 7.8 8.2 8.8 9.9 10.6 11.5 11.1 10.7 9.6 8.6 7.7
1932 7.1 6.8 7.3 8.2 9.3 10.4 10.8 10.9 10.7 9.6 8.9 7.7
1933 7.1 6.7 7.1 8 9.1 10.2 10.5 11.5 10.1 9.6 8.6 7.7
1934 7.8 7.9 8.3 9.2 10 10.8 10.9 11.6 10.7 9.7 9.2 8.4
1935 7.2 7.2 7.5 7.8 9.2 10.1 10.5 10.5 10.7 9.7 8.2 8.1
1936 7.9 6.7 7 7.8 9.3 10.4 11.3 11.3 10.5 10.1 8.6 7.9
1937 6.6 6.4 7.7 8.7 9.9 10.9 11.7 11.5 10.9 9.9 8.5 8.1
1938 7.4 7.2 8.1 9.4 10.6 12.3 12.7 11.9 11 9.9 8.6 7.5
1939 7.4 6.6 7.1 8.6 10.3 11.4 12.2 11.1 11.4 9.7  –< 8.5
1940 7.98 8.28 9.06 10.09 11.49 11.69
1941 10.87 10.54 11.29 11-05 10.66 9.97 9.07 8.60
1942 7.9 7.9 7.8 8.5 9.6 9.8 10.5 11 10.3 9.5 8.4 7.9
1943 6.8 6.7 7.1 8.2 8.8 10 10.3 10.6 10.3 9.6 9 8.1
1944 7.7 7.5 7.3 8 9.2 10.5 11 10.9 10.5 9.6 9.2 8.1
1945 7.8 7.7 7.6 8 8.8 9.8 10.1 10.5 10 9.5 8.1 8.1
1946 7.7 7.3 7.7 8.1 9.4 10.2 10.7 10.8 10.3 9.4 8.1 7.7
1947 7.1 7 7.7 8.4 9.5 10.4 10.6 10.9 10.5 9.9 9.1 7.9
1948 7.5 6.9 7.2 7.9 9 10.2 10.8 10.7 10.4 9.5 8.2 7
1949 6.1 6.1 6.9 8.3 9.4 10.1 10.3 10.2 10.5 9.5 8.7 7.8
1950 6.2 5.8 6.6 7.7 8.7 9.4 10.1 10.4 10.3 9.3 8.5 8
1951 7.5 6.9 6.7 8.1 9.2 10.2 10.4 11.1 10.9 9.5 8.5 7.7
1952 6.9 7.1 7.6 8.2 9 9.6 10.4 10.5 10.2 9.8 8.6 7.9
1953 7.8 7.9 7.6 8.1 9.3 9.8 10.6 11 10.6 9.9 9.3 8.5
1954 7.1 7.3 7.5 7.9 8.7 9.3 9.9 10 10 9.4 9.1 8.4
1955 7.5 7.1 6.7 7.5 8.4 9.3 9.8 10.2 10 8.9 7.5 6.6
1956 6.7 6.4 6.3 7.6 8.7 9.6 10.2 10.4 10.1 9.2 8.1 7.1
1957 6.3 6.2 7.2 8.1 9.3 10 10.3 10.5 10.5 9.8 8.8 8.3
1958 8 8.3 8.6 9.3 10.3 10.7 11.5 11.5 11 9.9 8.7 8.1
1959 7.6 7.4 7.9 9.1 9.7 10.4 11.3 11 10.4 9.7 8.3 7.8
1960 7.1 7.5 7.5 8.6 9.6 10.3 11.4 10.8 10.1 9.5 8.6 7.9
1961 7.9 8.2 8.4 8.8 9.4 10.3 10.9 11.3 10.6 9.4 8.2 7.5
1962 7.2 7.3 7.3 8.4 9.3 10 10.4 10.5 10.5 10 9.3 8.7
1963 7.5 7.5 7.8 8.5 9.6 10.2 10.5 10.8 10.6 10.3 9.9 8.7
1964 8.2 7.9 7.7 8.2 8.8 9.6 10.3 10.5 10 9.4 8.3 7.4
1965 6.9 7.1 7.2 8 8.8 9.8 10 10.2 10.3 9.7 9.2 8.5
1966 7.7 7.6 7.7 8.5 9 9.1 99.9 10.7 10.1 9.5 8.7 8.6
1967 7.9 7.7 7.6 8.1 8.9 9.6 10.3 10.5 10.5 9.7 9.1 8
1968 7.3 7.3 8 8.3 8.7 9.5 10.2 10.2 10.4 9.3 8.8 7.8
1969 6.5 6.3 7.2 8.1 9.1 10.2 10.4 10.5 9.8 9.2 8.7 8.1
1970 7.5 7.7 7.9 8 8.7 9.6 10.2 10.2 10 9 8.3 7.5
1971 7 6.9 6.7 7.5 8.5 9.1 10 10.6 10.4 9.3 8.3 7.3
1972 6.4 6.2 6.9 7.6 8.8 9.5 10.5 10.6 10.2 9.1 8.4 7.3
1973 7 7.2 7.9 8.4 8.6 9.2 10.1 10.3 10 9.2 8.2 8
1974 7.2 7.2 7.3 8.1 8.5 9.7 10 10.9 10.6 9.7 8.6 8.2
1975 7.3 6.8 7.2 7.7 8.7 9.4 10.2 10.4 10.4 9.6 9.2 7.8
1976 7.2 7 7 7.8 8.7 9.3 10.1 10.1 10 9.4 8.6 8.1
1977 7.6 7.9 8 8.3 8.8 9.7 9.9 10.8 10.3 9.2 8.6 7.9
1978 7.6 7.9 8.3 8.9 9.4 10.3 10.4 10.9 10.5 9.8 8.2 7.3
1979 6.5 6.9 7.5 8.3 9.5 10 10.8 10.7 10.5 9.8 9 8.6
1980 7.7 7.6 7.9 8.6 9.5 9.5 10.6 10.9 10.5 9.9 9.2 8.6
1981 8.3 8.3 8.8 9.2 9.4 9.9 10.3 10.5 10.2 9.7 9.3 8.5
1982 7.2 7.5 8 8.8 9.9 10.7 11.4 11.8 11.4 10.3 8.8 8.3
1983 8.6 8.6 9.3 10 10.6 11.3 11.7 12.4 11.4 10.3 9.5 7.7
1984 7.5 7.8 8.4 9 9.7 10.3 11.4 11.6 10.6 9.7 8.5 6.9
1985 6.8 6.8 7.2 8.2 9.6 10.6 11.5 11.6 10.8 9.6 6.8 6.4
1986 7 6.6 8 8.4 9.4 11 10.9 11.8 10.8 9.8 8.4 7.8
1987 7.6 7.9 8.3 8.9 9.8 10.6 11.1 11.5 11.1 10 9 8.2
1988 7.4 7.5 7.5 8.6 9.6 10.4 11 11.4 10.6 9.6 8.7 7.9
1989 7 5.8 6.8 8.2 9.5 10.7 11.3 11.2 11 9.9 8.9 8.2
1990 8.1 7.7 8.2 9 9.9 10.8 11.8 12.1 12.1 10.7 9.9 8.2
1991 7.1 7.7 7.9 8.4 9.7 9.7 10.8 11 11.2 10.1 8.9 8.3
1992 7.9 8.1 9.5 9.5 10.2 10.7 11.1 11.4 11 10 9.1 7.8
1993 6.7 6.7 7.6 8.6 9.7 10.8 11 11.2 11 10.1 8.5 7.9
1994 8 7.4 8.6 9.3 10.1 10.6 11.6 11.5 11.3 10.7 9.3 8.4
1995 8.2 8.6 8.8 9.2 10.2 11.2 11.8 11.5 11.3 10.2 9.4 8.9
1996 8.2 7.8 8.4 9.2 10 10.4 11.5 11.5 10.5 9.9 8.7 7.6
1997 7.7 7.9 8.1 9 10.3 10.9 11.7 12.2 11.6 11.3 9.9 9.3
1998 8.7 9.2 9.7 9.9 10.4 11.4 11.7 12.3 12.1 10.7 9.8 9
1999 8 7.8 8.1 8.9 9.5 10.4 11.1 11.5 11.9 10.1 9 8.5
2000 7.5 7.7 8.1 9.1 10 11.1 11.3 11.7 11.4 10.3 9 8
2001 7.9 7.7 8.1 8.7 9.7 10.6 11.3 11.4 11.4 10.2 9.2 8.3
2002 8.1 7.9 7.7 8.7 9.4 10.5 11,2 11.7 11.3 10.0 9.0 8.8
2003 8.8 8.5 8.7 9.2 9.9 10.9 11.3 11.4 11.4 10.9 9.0 8.5
2004 7.8 7.9 8.3 9.1 10.4 11.0 11.8 11.9 11.2 10.6 9.4 8.6
2005 7.7 8.0 8.8 9.4 10.7 11.2 11.6 12.1 11.5 10.4 9.5 8.3
2006 8.61 8.49 8.41 8.75 10.08 10.86 11.66 12.09 11.49 10.55 9.29 8.5
2007 7.8 7.9 7.9 9.0 10.0 10.2 11.2 11.6 11.0 10.0 9.0 8.0
2008 7.46 7.33 7.68 8.06 9.36 9.77 10.84 11.30 11.16 10.14 9.39 7.87
2009 7.29 7.20 7.5 8.4 9.54 10.4 11.4 11.74 11.8 10.5 9.0 7.0
2010 8.11 8.68 9.12 8.96 9.54 10.36 11.16 11.93 11.08 10.37 8.98 8.5
2011 7.77 7.49 7.77 8.53 9.32 10.35 10.76 11.38 11.17 10.14< 8.66< 8.01
2012 7.29 7.35 7.63 8.73 9.82 9.76 10.37 10.98 10.92 9.66< 8.85 8.32
2013 7.64 7.44 7.48 8.27 9.05 9.72 10.96 10.76 10.65 10,10 8.69 7.68
2014 7.63 7.25 7.90 8.80 9.72 10.30 10.79 11.36 11.20 10.72 10.14 9.03
2015 8.75 9.00 8.96 9.40 9.88 11.17 11.97 12.23 11.30 10.55 9.61 9.01
2016 8.45 8.77 9.05 9.71 10.21 11.16 11.90 12.52 11.27 10.40 10.42 8.63
2018 8.06 7.71 8.00 8.81 10.31 10.63 11.40 11.50 11.11 `0.27 9,54 8.72
2019 8.45 8.96 10.05 10.87 10.98 11.26 10.85
2020
2021
2022
Year/span> Jan Feb Mar Apr/span> May Jun/span> Jul/span> Aug/span> Sep Oct Nov Dec

Oil cleanup near Island impossible much of the year TC May 2019

I was involved as an intervenor  in the NEB reconsideration Hearings in the fall of 2018. We presented the wind data from Race Rocks which confirms much of the information in this newspaper article. Note Race Rocks is also  mentioned below:

From The Times Colonist -Island Voices: May 26 2017 

Oil cleanup near Island impossible much of the year

If an oil spill occurred in the Juan de Fuca Strait, a cleanup would be impossible or severely limited 198 days of the year, according to Christianne Wilhelmson, executive director of the Georgia Strait Alliance

If you are wondering whether our coast is ready for an oil spill, you might like to know that responding to one at the mouth of the Juan de Fuca Strait, near Port Renfrew, would be impossible or severely limited 198 days of the year.
As part of the National Energy Board’s re-review of the Trans Mountain pipeline expansion, Georgia Strait Alliance examined the physical limits of booms, which are foundational pieces of equipment to contain and deflect spilled oil. We compared their limits to wind, wave and currents along the tanker route, and found that responding to a spill on our coast is likely to result in a significant amount of oil being left in our marine environment.

Most of the booms used to respond to spills along the tanker route are meant for protected water areas, such as harbours. They aren’t built to withstand the currents we find along the route, with 87 per cent of them failing at about 1.5 knots (2.8 km/h). Even the most effective high-current booms on our coast fail at four knots. Meanwhile, in some locations, such as Race Rocks on the southern tip of Vancouver Island, currents can exceed seven knots.
Strong wind and waves carry oil over or under booms, sometimes even breaking them. In the heaviest weather, booms can’t be deployed. Wind and waves surpass boom capabilities for days, sometimes weeks, at a time during the fall and winter at the mouth of the Juan de Fuca Strait. If an oil spill were to happen during one of these periods, our coast would likely be awash in oil.
When the tug Nathan E. Stewart sank in Heiltsuk Nation territory in the northern part of the province in 2016, weather conditions suspended spill cleanup for 11 of 40 days of recovery efforts recovered 1,400 litres of oily water and waste, leaving 110,000 litres of fuel and lubricant in the surrounding waters. The spill contaminated shellfish harvesting areas, forcing the Heiltsuk to halt food and commercial harvests, as well as cultural practices.
Unfortunately, this level of failure is common. The International Tanker Owners Pollution Federation estimates that 10 to 15 per cent of spilled oil is recovered, with the weather limits of spill equipment being a major factor. Spills are complex and difficult to manage — and their repercussions last for decades. We’re 30 years on from the Exxon Valdez disaster in Alaska, which saw the loss of thousands of local jobs and the functional extinction of a pod of orcas, and oil is still being found on beaches in Prince William Sound.
An outcome such as this isn’t one that the people who live and work in the Salish Sea area should have to navigate. The federal government can say no to the expansion of the Trans Mountain pipeline and protect our coast from the risk of a future spill.
The government’s rationale for the pipeline expansion is unravelling: The NEB acknowledges there would be devastating impacts to southern resident orcas; Alberta’s carbon tax and oil-production cap are on the chopping block with the election of Premier Jason Kenney; and oil-spill response is nowhere near being “world-class.” The NEB recommends reviewing nearly every aspect of how we respond to spills — from response resources to the methods we use for spill response to including Indigenous and municipal governments in planning.
The federal government continues to claim that this project is in the national interest, while evidence and research suggest otherwise. The economic case for fossil fuels is unravelling, as the benefits of government revenues and jobs decline, while the impacts of their production on climate change and the natural world continues to climb.
It is time for Prime Minister Justin Trudeau to acknowledge that the government’s case for Trans Mountain is crumbling and move on from this project that puts our coast at risk.

Christianne Wilhelmson is the executive director of Georgia Strait Alliance, a regional marine conservation organization and intervener in the National Energy Board process.