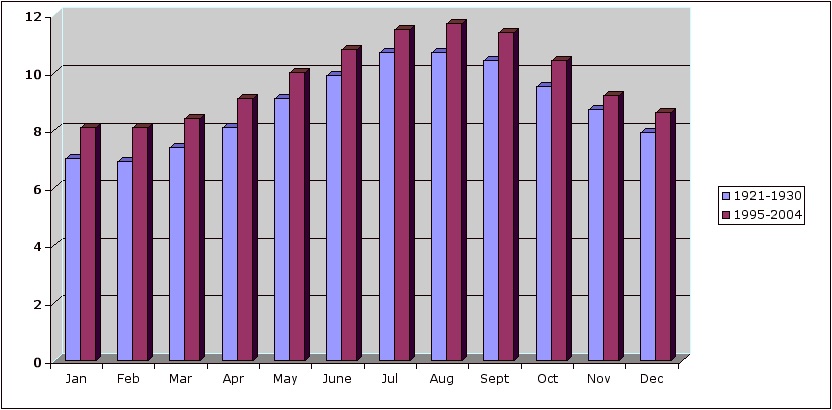
Decade Comparisons:Sea Surface Temperature at Race Rocks-

Link to Race Rocks Mean Monthly Sea Temperature 1921-present,

Monthly temperature averages in degrees Celsius for Race Rocks
1921 1922 1923 1924 1925 1926 1927 1928 1929 1930 Average Month
Jan 6.4 7.1 7.1 6.6 7.8 7.6 6.9 7.1 6.5 7.0 Jan
Feb 7.1 6.1 6.4 7.3 6.9 8 7.4 7.3 6.3 6.6 6.9 Feb
Mar 7.3 6.6 6.7 7.7 7.3 8.6 7.8 7.8 7.1 7.1 7.4 Mar
Apr 7.7 7.5 7.6 7.9 8 9.2 8 8.6 7.8 8.2 8.1 Apr
May 8.5 8.3 8.6 9 9.2 10.1 8.8 9.7 9 9.3 9.1 May
June 9.5 9.5 9.3 9.8 10.1 10.7 9.8 10.2 9.8 10 9.9 June
Jul 10.3 10.5 10.3 10.5 11.1 11.1 10.5 10.8 10.8 10.6 10.7 Jul
Aug 10.5 10.3 10.5 10.3 10.8 10.9 10.9 10.9 10.8 10.8 10.7 Aug
Sept 10.3 10.2 10.6 10.2 10.2 10.5 10.3 10.3 10.7 10.6 10.4 Sept
Oct 9.8 9.3 9.6 9.2 9.2 9.8 9.7 9.2 9.8 9.4 9.5 Oct
Nov 9.1 8.4 8.7 8.8 8.3 9.1 8.6 8.6 8.8 8.6 8.7 Nov
Dec 8.2 7.1 7.9 7.3 8.2 8.5 7.6 7.9 7.8 8 7.9 Dec
8.8 Decade
average
Average
1995 1996 1997 1998 1999 2000 2001 2002 2003 2004
Jan 8.2 8.2 7.7 8.7 8 7.5 7.9 8.1 8.8 7.8 8.1 Jan
Feb 8.6 7.8 7.9 9.2 7.8 7.7 7.7 7.9 8.5 7.9 8.1 Feb
Mar 8.8 8.4 8.1 9.7 8.1 8.1 8.1 7.7 8.7 8.3 8.4 Feb
Apr 9.2 9.2 9 9.9 8.9 9.1 8.7 8.7 9.2 9.1 9.1 Apr
May 10.2 10 10.3 10.4 9.5 10 9.7 9.4 9.9 10.4 10.0 May
June 11.2 10.4 10.9 11.4 10.4 11.1 10.6 10.5 10.9 11 10.8 June
Jul 11.8 11.5 11.7 11.7 11.1 11.3 11.3 11.2 11.3 11.8 11.5 Jul
Aug 11.5 11.5 12.2 12.3 11.5 11.7 11.4 11.7 11.4 11.9 11.7 Aug
Sept 11.3 10.5 11.6 12.1 11.9 11.4 11.4 11.3 11.4 11.2 11.4 Sept
Oct 10.2 9.9 11.3 10.7 10.1 10.3 10.2 10 10.9 10.6 10.4 Oct
Nov 9.4 8.7 9.9 9.8 9 9 9.2 9 9 9.4 9.2 Nov
Dec 8.9 7.6 9.3 9 8.5 8 8.3 8.8 8.5 8.6 8.6 Dec
9.8 Decade
Average
This analysis has been done by Garry Fletcher using the monthly averages of the daily temperatures.
See this file for the complete set of monthly data1921 to present
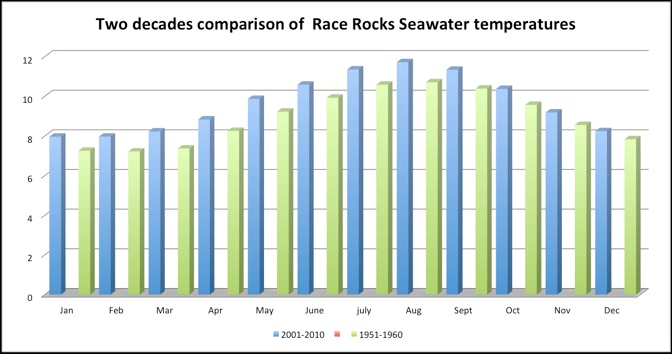
The following is a comparison between 1951-1960 and 2001-2010

Jan Feb Mar Apr May Jun Jul Aug Sept Oct Nov Dec
1951 7.5 6.9 6.7 8.1 9.2 10.2 10.4 11.1 10.9 9.5 8.5 7.7
1952 6.9 7.1 7.6 8.2 9 9.6 10.4 10.5 10.2 9.8 8.6 7.9
1953 7.8 7.9 7.6 8.1 9.3 9.8 10.6 11 10.6 9.9 9.3 8.5
1954 7.1 7.3 7.5 7.9 8.7 9.3 9.9 10 10 9.4 9.1 8.4
1955 7.5 7.1 6.7 7.5 8.4 9.3 9.8 10.2 10 8.9 7.5 6.6
1956 6.7 6.4 6.3 7.6 8.7 9.6 10.2 10.4 10.1 9.2 8.1 7.1
1957 6.3 6.2 7.2 8.1 9.3 10 10.3 10.5 10.5 9.8 8.8 8.3
1958 8 8.3 8.6 9.3 10.3 10.7 11.5 11.5 11 9.9 8.7 8.1
1959 7.6 7.4 7.9 9.1 9.7 10.4 11.3 11 10.4 9.7 8.3 7.8
1960 7.1 7.5 7.5 8.6 9.6 10.3 11.4 10.8 10.1 9.5 8.6 7.9
Mean 7.25 7.21 7.36 8.25 9.22 9.92 10.58 10.7 10.38 9.56 8.55 7.83

2001 7.9 7.7 8.1 8.7 9.7 10.6 11.3 11.4 11.4 10.2 9.2 8.3
2002 8.1 7.9 7.7 8.7 9.4 10.5 11.2 11.7 11.3 10 9 8.8
2003 8.8 8.5 8.7 9.2 9.9 10.9 11.3 11.4 11.4 10.9 9 8.5
2004 7.8 7.9 8.3 9.1 10.4 11 11.8 11.9 11.2 10.6 9.4 8.6
2005 7.7 8 8.8 9.4 10.7 11.2 11.6 12.1 11.5 10.4 9.5 8.3
2006 8.61 8.49 8.41 8.75 10.08 10.86 11.66 12.09 11.49 10.55 9.29 8.5
2007 7.8 7.9 7.9 9 10 10.2 11.2 11.6 11 10 9 8
2008 7.46 7.33 7.68 8.06 9.36 9.77 10.84 11.3 11.16 10.14 9.39 7.87
2009 7.29 7.2 7.5 8.4 9.54 10.4 11.4 11.74 11.8 10.5 9 7
2010 8.11 8.68 9.12 8.96 9.54 10.36 11.16 11.93 11.08 10.37 8.98 8.5
Mean 7.95 7.96 8.22 8.82 9.862 10.58 11.34 11.71 11.33 10.36 9.17 8.24

Monthly Means
2001-2010 1951-1960
Jan 7.96 7.25
Feb 7.96 7.21
Mar 8.22 7.36
Apr 8.83 8.25
May 9.86 9.22
June 10.58 9.92
july 11.34 10.58
Aug 11.71 10.7
Sept 11.33 10.38
Oct 10.36 9.56
Nov 9.17 8.55
Dec 8.24 7.83

See also https://www.env.gov.bc.ca/soe/indicators/climate-change/sea-surface-temperature.html

Archive of Seawater Temperature Data 1921 to present

Note, The blanks for the years 1940-41 are due to the Second World War. Apparently during that time, data was not collected by a lightkeeper.Original data was sent by the Lightkeepers and now by the Marine Protected Area Guardian of Race Rocks to the Institute of Ocean Sciences where it is compiled and displayed at
http://www.pac.dfo-mpo.gc.ca/science/oceans/data-donnees/lighthouses-phares/index-eng.htm
Decade analysis by G. Fletcher.. NOTE probable evidence of climate change
Race Rocks Light Station: 48.2996 123.5318


Year Jan Feb Mar Apr May Jun Jul Aug Sep Oct Nov Dec
1921  — 7.13 7.39 7.75 8.53 9.57 10.31 10.53 10.35 9.88 9.21 8.25
1922 6.4 6.1 6.6 7.5 8.3 9.5 10.5 10.3 10.2 9.3 8.4 7.1
1923 7.1 6.4 6.7 7.6 8.6 9.3 10.3 10.5 10.6 9.6 8.7 7.9
1924 7.1 7.3 7.7 7.9 9 9.8 10.5 10.3 10.2 9.2 8.8 7.3
1925 6.6 6.9 7.3 8 9.2 10.1 11.1 10.8 10.2 9.2 8.3 8.2
1926 7.8 8 8.6 9.2 10.1 10.7 11.1 10.9 10.5 9.8 9.1 8.5
1927 7.6 7.4 7.8 8 8.8 9.8 10.5 10.9 10.3 9.7 8.6 7.6
1928 6.9 7.3 7.8 8.6 9.7 10.2 10.8 10.9 10.3 9.2 8.6 7.9
1929 7.1 6.3 7.1 7.8 9 9.8 10.8 10.8 10.7 9.8 8.8 7.8
1930 6.5 6.6 7.1 8.2 9.3 10 10.6 10.8 10.6 9.4 8.6 8
1931 7.8 7.8 8.2 8.8 9.9 10.6 11.5 11.1 10.7 9.6 8.6 7.7
1932 7.1 6.8 7.3 8.2 9.3 10.4 10.8 10.9 10.7 9.6 8.9 7.7
1933 7.1 6.7 7.1 8 9.1 10.2 10.5 11.5 10.1 9.6 8.6 7.7
1934 7.8 7.9 8.3 9.2 10 10.8 10.9 11.6 10.7 9.7 9.2 8.4
1935 7.2 7.2 7.5 7.8 9.2 10.1 10.5 10.5 10.7 9.7 8.2 8.1
1936 7.9 6.7 7 7.8 9.3 10.4 11.3 11.3 10.5 10.1 8.6 7.9
1937 6.6 6.4 7.7 8.7 9.9 10.9 11.7 11.5 10.9 9.9 8.5 8.1
1938 7.4 7.2 8.1 9.4 10.6 12.3 12.7 11.9 11 9.9 8.6 7.5
1939 7.4 6.6 7.1 8.6 10.3 11.4 12.2 11.1 11.4 9.7  –< 8.5
1940 7.98 8.28 9.06 10.09 11.49 11.69
1941 10.87 10.54 11.29 11-05 10.66 9.97 9.07 8.60
1942 7.9 7.9 7.8 8.5 9.6 9.8 10.5 11 10.3 9.5 8.4 7.9
1943 6.8 6.7 7.1 8.2 8.8 10 10.3 10.6 10.3 9.6 9 8.1
1944 7.7 7.5 7.3 8 9.2 10.5 11 10.9 10.5 9.6 9.2 8.1
1945 7.8 7.7 7.6 8 8.8 9.8 10.1 10.5 10 9.5 8.1 8.1
1946 7.7 7.3 7.7 8.1 9.4 10.2 10.7 10.8 10.3 9.4 8.1 7.7
1947 7.1 7 7.7 8.4 9.5 10.4 10.6 10.9 10.5 9.9 9.1 7.9
1948 7.5 6.9 7.2 7.9 9 10.2 10.8 10.7 10.4 9.5 8.2 7
1949 6.1 6.1 6.9 8.3 9.4 10.1 10.3 10.2 10.5 9.5 8.7 7.8
1950 6.2 5.8 6.6 7.7 8.7 9.4 10.1 10.4 10.3 9.3 8.5 8
1951 7.5 6.9 6.7 8.1 9.2 10.2 10.4 11.1 10.9 9.5 8.5 7.7
1952 6.9 7.1 7.6 8.2 9 9.6 10.4 10.5 10.2 9.8 8.6 7.9
1953 7.8 7.9 7.6 8.1 9.3 9.8 10.6 11 10.6 9.9 9.3 8.5
1954 7.1 7.3 7.5 7.9 8.7 9.3 9.9 10 10 9.4 9.1 8.4
1955 7.5 7.1 6.7 7.5 8.4 9.3 9.8 10.2 10 8.9 7.5 6.6
1956 6.7 6.4 6.3 7.6 8.7 9.6 10.2 10.4 10.1 9.2 8.1 7.1
1957 6.3 6.2 7.2 8.1 9.3 10 10.3 10.5 10.5 9.8 8.8 8.3
1958 8 8.3 8.6 9.3 10.3 10.7 11.5 11.5 11 9.9 8.7 8.1
1959 7.6 7.4 7.9 9.1 9.7 10.4 11.3 11 10.4 9.7 8.3 7.8
1960 7.1 7.5 7.5 8.6 9.6 10.3 11.4 10.8 10.1 9.5 8.6 7.9
1961 7.9 8.2 8.4 8.8 9.4 10.3 10.9 11.3 10.6 9.4 8.2 7.5
1962 7.2 7.3 7.3 8.4 9.3 10 10.4 10.5 10.5 10 9.3 8.7
1963 7.5 7.5 7.8 8.5 9.6 10.2 10.5 10.8 10.6 10.3 9.9 8.7
1964 8.2 7.9 7.7 8.2 8.8 9.6 10.3 10.5 10 9.4 8.3 7.4
1965 6.9 7.1 7.2 8 8.8 9.8 10 10.2 10.3 9.7 9.2 8.5
1966 7.7 7.6 7.7 8.5 9 9.1 99.9 10.7 10.1 9.5 8.7 8.6
1967 7.9 7.7 7.6 8.1 8.9 9.6 10.3 10.5 10.5 9.7 9.1 8
1968 7.3 7.3 8 8.3 8.7 9.5 10.2 10.2 10.4 9.3 8.8 7.8
1969 6.5 6.3 7.2 8.1 9.1 10.2 10.4 10.5 9.8 9.2 8.7 8.1
1970 7.5 7.7 7.9 8 8.7 9.6 10.2 10.2 10 9 8.3 7.5
1971 7 6.9 6.7 7.5 8.5 9.1 10 10.6 10.4 9.3 8.3 7.3
1972 6.4 6.2 6.9 7.6 8.8 9.5 10.5 10.6 10.2 9.1 8.4 7.3
1973 7 7.2 7.9 8.4 8.6 9.2 10.1 10.3 10 9.2 8.2 8
1974 7.2 7.2 7.3 8.1 8.5 9.7 10 10.9 10.6 9.7 8.6 8.2
1975 7.3 6.8 7.2 7.7 8.7 9.4 10.2 10.4 10.4 9.6 9.2 7.8
1976 7.2 7 7 7.8 8.7 9.3 10.1 10.1 10 9.4 8.6 8.1
1977 7.6 7.9 8 8.3 8.8 9.7 9.9 10.8 10.3 9.2 8.6 7.9
1978 7.6 7.9 8.3 8.9 9.4 10.3 10.4 10.9 10.5 9.8 8.2 7.3
1979 6.5 6.9 7.5 8.3 9.5 10 10.8 10.7 10.5 9.8 9 8.6
1980 7.7 7.6 7.9 8.6 9.5 9.5 10.6 10.9 10.5 9.9 9.2 8.6
1981 8.3 8.3 8.8 9.2 9.4 9.9 10.3 10.5 10.2 9.7 9.3 8.5
1982 7.2 7.5 8 8.8 9.9 10.7 11.4 11.8 11.4 10.3 8.8 8.3
1983 8.6 8.6 9.3 10 10.6 11.3 11.7 12.4 11.4 10.3 9.5 7.7
1984 7.5 7.8 8.4 9 9.7 10.3 11.4 11.6 10.6 9.7 8.5 6.9
1985 6.8 6.8 7.2 8.2 9.6 10.6 11.5 11.6 10.8 9.6 6.8 6.4
1986 7 6.6 8 8.4 9.4 11 10.9 11.8 10.8 9.8 8.4 7.8
1987 7.6 7.9 8.3 8.9 9.8 10.6 11.1 11.5 11.1 10 9 8.2
1988 7.4 7.5 7.5 8.6 9.6 10.4 11 11.4 10.6 9.6 8.7 7.9
1989 7 5.8 6.8 8.2 9.5 10.7 11.3 11.2 11 9.9 8.9 8.2
1990 8.1 7.7 8.2 9 9.9 10.8 11.8 12.1 12.1 10.7 9.9 8.2
1991 7.1 7.7 7.9 8.4 9.7 9.7 10.8 11 11.2 10.1 8.9 8.3
1992 7.9 8.1 9.5 9.5 10.2 10.7 11.1 11.4 11 10 9.1 7.8
1993 6.7 6.7 7.6 8.6 9.7 10.8 11 11.2 11 10.1 8.5 7.9
1994 8 7.4 8.6 9.3 10.1 10.6 11.6 11.5 11.3 10.7 9.3 8.4
1995 8.2 8.6 8.8 9.2 10.2 11.2 11.8 11.5 11.3 10.2 9.4 8.9
1996 8.2 7.8 8.4 9.2 10 10.4 11.5 11.5 10.5 9.9 8.7 7.6
1997 7.7 7.9 8.1 9 10.3 10.9 11.7 12.2 11.6 11.3 9.9 9.3
1998 8.7 9.2 9.7 9.9 10.4 11.4 11.7 12.3 12.1 10.7 9.8 9
1999 8 7.8 8.1 8.9 9.5 10.4 11.1 11.5 11.9 10.1 9 8.5
2000 7.5 7.7 8.1 9.1 10 11.1 11.3 11.7 11.4 10.3 9 8
2001 7.9 7.7 8.1 8.7 9.7 10.6 11.3 11.4 11.4 10.2 9.2 8.3
2002 8.1 7.9 7.7 8.7 9.4 10.5 11,2 11.7 11.3 10.0 9.0 8.8
2003 8.8 8.5 8.7 9.2 9.9 10.9 11.3 11.4 11.4 10.9 9.0 8.5
2004 7.8 7.9 8.3 9.1 10.4 11.0 11.8 11.9 11.2 10.6 9.4 8.6
2005 7.7 8.0 8.8 9.4 10.7 11.2 11.6 12.1 11.5 10.4 9.5 8.3
2006 8.61 8.49 8.41 8.75 10.08 10.86 11.66 12.09 11.49 10.55 9.29 8.5
2007 7.8 7.9 7.9 9.0 10.0 10.2 11.2 11.6 11.0 10.0 9.0 8.0
2008 7.46 7.33 7.68 8.06 9.36 9.77 10.84 11.30 11.16 10.14 9.39 7.87
2009 7.29 7.20 7.5 8.4 9.54 10.4 11.4 11.74 11.8 10.5 9.0 7.0
2010 8.11 8.68 9.12 8.96 9.54 10.36 11.16 11.93 11.08 10.37 8.98 8.5
2011 7.77 7.49 7.77 8.53 9.32 10.35 10.76 11.38 11.17 10.14< 8.66< 8.01
2012 7.29 7.35 7.63 8.73 9.82 9.76 10.37 10.98 10.92 9.66< 8.85 8.32
2013 7.64 7.44 7.48 8.27 9.05 9.72 10.96 10.76 10.65 10,10 8.69 7.68
2014 7.63 7.25 7.90 8.80 9.72 10.30 10.79 11.36 11.20 10.72 10.14 9.03
2015 8.75 9.00 8.96 9.40 9.88 11.17 11.97 12.23 11.30 10.55 9.61 9.01
2016 8.45 8.77 9.05 9.71 10.21 11.16 11.90 12.52 11.27 10.40 10.42 8.63
2018 8.06 7.71 8.00 8.81 10.31 10.63 11.40 11.50 11.11 `0.27 9,54 8.72
2019 8.45 8.96 10.05 10.87 10.98 11.26 10.85
2020
2021
2022
Year/span> Jan Feb Mar Apr/span> May Jun/span> Jul/span> Aug/span> Sep Oct Nov Dec

December Sea Water

Temp Temp Sal
Day Time ºC ºC ppt
1
2 13:00 10.0 31.2
3 14:00 10.0 31.2
4 8:00 9.8 31.5
5 8:15 9.7 31.2
6 8:00 9.0 31.3
7 9:00 8.7 31.5
8 9:30 8.9 31.4
9 9:30 8.7 30.9
10 10:30 8.8 31.2
11 9:20 8.9 31.9
12 11:30 8.5 31.5
13 11:45 8.5 31.7
14 12:00 8.4 31.9
15 13:00 8.6 31.9
16
17 16:30 8.3 31.9
18 9:00 8.4 32.1
19 8:30 8.6 8.5 32.4
20 16:15 8.6 8.6 31.8
21 9:30 8.5 8.4 32.1
22 10:00 8.5 8.4 32
23 11:00 8.4 8.3 31.6
24 10:30 8.0 31.4
25 10:15 8.1 31.4
26 12:30 8.1 31.3
27 10:30 8.1 31.5
28 11:00 8.2 31.8
29 12:00 8.2 31.9
30 11:05 8.2 31.8
31 12:30 8.1 31.8

November seawater data

YSI YSI
Temp Sal
Day Time ºC ppt
1 13:50 31.7 10.4
2 13:50 31.8 10.3
3 13:50 31.7 10.4
4 13:50 31.6 10.3
5 12:08 31.3 10.6
6 10:10 31.6 10.6
7 10:03 31.3 11
8 10:00 31.5 10.7
9 10:03 31.4 10.7
10 10:25 31.3 10.9
11 10:45 31.5 10.7
12 11:15 31.4 10.7
13 11:48 31.5 10.5
14 12:06 31.5 10.7
15 16:00 31.4 10.3
16 15:00 31.2 10.2
17 13:00 31.2 10.2
18 x x x
19 14:00 31.2 10.2
20 13:00 31.4 10.2
21 x x x
22 12:00 31.6 10.2
23 11:00 31.4 10.3
24 12:00 31.3 10.4
25 13:00 31.6 10.2
26 12:00 31.4 10.3
27 12:00 31.5 10.1
28 13:00 31.4 10.1
29 14:00 31.5 10.3
30 12:00 31.4 10.2

Seawater Data, October 2016

Station Race Rocks Lightstation
Month: October Year: 2016
Observer Lester B. Pearson College   of the Pacific
Date Time YSI Salinity YSI Temp °C
1 14:25 31.9 10.4
2 15:45 32.0 10.5
3 15:40 31.4 10.4
4 15:52 31.6 10.8
5 16:07 31.4 11.1
6 16:04 31.6 10.7
7 15:50 31.8 10.6
8 11:56 31.8 10.2
9 12:20 31.9 10.6
10 12:35 31.8 10.6
11 12:36 31.6 10.6
12 12:36 31.8 10.5
13 13:15 31.7 10.5
14 13:17 32.1 9.9
15 N/A TOO STORMY
16 14:15 31.7 10.6
17 14:47 32.2 10.0
18 15:20 32.1 10.5
19 15:51 31.7 9.9
20 16:18 32.2 10.1
21 16:30 32.1 10.1
22 11:07 32.3 10.0
23 11:35 32.2 10.2
24 11:55 32.0 10.3
25 12:07 32.0 10.5
26 12:20 32.0 10.1
27 12:39 32.1 10.2
28 13:07 31.9 10.5
29 13:25 31.7 10.6
30 14:00 31.8 10.4
31 13:50 31.7 10.6
Submitted to: Inst. Ocean Science, P.O. Box 6000, Sidney, B.C. V8L 4B2
Peter Chandler   Peter.Chandler@dfo-mpo.gc.ca
Recorded by Race Rocks Ecological Reserve Guardian on behalf of Lester B. Pearson College

Seawater Data, September 2016

Station Race Rocks Lightstation
Month: September Year: 2016
Observer Lester B. Pearson College of the Pacific
Date Time Sea Jar Hydro-   meter   No. Observed Density YSI Salinity YSI Temp °C
Temp. Temp.
°C °C
1 15:10 30.9 12.0
2 18:45 31.9 11.3
3 16:40 31.6 12.3
4 18:45 32.0 11.2
5 17:30 31.7 11.4
6 19:30 31.6 11.3
7 19:00 31.4 11.4
8 19:10 31.4 12.2
9 19:15 31.1 12.3
10 19:15 31.1 12.5
11 20:04 30.8 12.8
12 19:30 30.7 12.7
13 18:30 30.7 12.3
14 Not Done Not Done Not Done
15 16:15 31.6 11.4
16 14:35 10.8 10.7 10802 242 31.5 10.8
17 15:15 31.7 11.0
18 15:48 32.2 10.5
19 15:50 32.5 9.9
20 16:55 32.1 10.6
21 17:47 32.0 10.5
22 10:38 32.5 9.9
23 10:51 32.2 10.2
24 11:45 32.1 10.6
25 13:30 31.9 10.8
26 13:45 31.9 10.8
27 13:45 31.3 11.4
28 13:42 31.9 11.0
29 14:05 31.9 10.8
30 14:27 31.9 10.9
31
Submitted to: Inst. Ocean Science, P.O. Box 6000, Sidney, B.C. V8L 4B2
Peter Chandler
Recorded by Race Rocks Ecological Reserve Guardian on behalf of Lester B. Pearson College

Seawater Data, August 2016

Station Race Rocks Lightstation
Month: August Year: 2016
Observer Lester B. Pearson College   of the Pacific
I had to enter the values in myself (there was no spreadsheet on the computer) so I am hopeful that I was able to read all of Guy et Christine’s vague handwritten numbers.
Date Time Sea Jar Hydro-   meter   No. Observed Density YSI Salinity YSI Temp °C
Temp. Temp.
°C °C
1  21:00 30.3 12.4
2  20:00 30.7 12.0
3  19:00 30.1 12.2
4  19:30 30.5 12.6
5  17:39 31.2 12.1
6  18:15 31.1 12.0
7  18:20 30.9 11.9
8  19:10 31.2 12.0
9  19:45 30.7 12.7
10  20:00 30.9 12.4
11  20:10 30.6 12.8
12  21:20 30.3 13.3
13  20:00 29.6 13.1
14  20:45 29.2 13.3
15  21:00 30.1 13.0
16  20:30 30.1 12.9
17  19:30 30.3 12.7
18  18:50 30.5 13.3
19  18:30 30.7 13.3
20  17:30 11.8 12.4 10,802 1.0230 31.5 12.5
21  17:30 31.6 12.1
22  19:00 31.4 12.3
23  18:30 31.2 12.4
24  19:20 31.2 12.4
25  20:05 31.2 12.6
26  20:15 30.9 12.5
27  20:40 30.7 12.4
28  20:15 30.9 12.3
29  17:10 31.1 12.4
30  17:00 31.1 12.3
31  15:05 31.6 11.9
Submitted monthly to: Inst. Ocean Science, P.O. Box 6000, Sidney, B.C. V8L 4B2
Recorded by Race Rocks Ecological Reserve Guardian for Lester B. Pearson College

Seawater Data, July 2016

Time Zone: PDT
Station Race Rocks Lightstation
2016 July
Observer Lester B. Pearson College   of the Pacific
Date Time YSI Salinity YSI Temp celsius Hydro- meter     No. Observed Density
1 20:50 30.6 11.7 10,802
2 20:55 31.4 11.0 10,802
3 20:45 31.4 10.9 10,802
4 21:05 31.2 11.5 10,802
5 20:00 31.3 11.2 10,802
6 20:15 31.0 11.6 10,802
7 20:30 31.2 11.0 10,802
8 20:30 30.9 11.2 10,802
9 19:30 31.1 11.7 10,802
10 20:30 30.8 12.5 10,802
11 20:30 30.8 12.0 10,802
12 20:35 31.2 11.8 10,802
13 21:15 30.6 12.3 10,802
14 21:30 30.4 12.2 10,802
15 21:30 30.4 12.1 10,802
16 21:45 30.4 12.7 10,802
17 20:50 30.5 12.2 10,802
Sea temp:11.8 jar temp:12.2
obsv.density
1.023
18 21:00 30.3 12.4 10,802
19 21:00 30.7 12.2 10,802
20 21:10 30.6 11.8 10,802
21 20:00 31.2 11.9 10,802
22 19:30 30.6 11.8 10,802
23 19:00 31.4 11.6 10,802
24 19:15 31.4 11.6 10,802
25 19:00 31.4 12.2 10,802
26 20:00 31.3 12.1 10,802
27 20:15 30.8 12.0 10,802
28 21:15 30.7 12.3 10,802
29 20:20 30.6 12.3 10,802
30 21:00 30.5 12.4 10,802
31 21:30 30.5 12.3 10,802
Mean*                * 30.9 11.9 #DIV/0!
Submitted to: Inst. Ocean Science, P.O. Box 6000, Sidney, B.C. V8L 4B2
Peter Chandler
Recorded by Race Rocks Marine Protected Area Guardian
Lester B. Pearson College of the Pacific

Seawater Data, June 2016

Station Race Rocks Lightstation
Month: June Year: 2016
Observer Lester B. Pearson College   of the Pacific
Date Time Sea Jar Hydro-   meter   No. Observed Density YSI Salinity YSI Temp °C
Temp. Temp.
°C °C
1  14:10 32.2 10.9
2  13:19 32.1 11.0
3  17:15 32.1 11.4
4  18:15 31.9 11.2
5  18:45 32.3 11.1
6  20:30 32.3 10.2
7  19:00 32.8 10.2
8  20:00 33.1 9.8
9  21:00 32.5 10.4
10  20:30 32.4 10.5
11  21:00 32.2 10.7
12  21:00 32.2 10.9
13  21:00 32.0 10.7
14  21:20 29.6 11.4
15  21:10 30.2 11.6
16  20:50 29.8 11.5
17  21:00 30.2 11.8
18  20:45 30.7 11.2
19  21:50 30.7 11.4
20  20:40  11.6 11.8 10,802 1.023 30.8 11.3
21  21:00 30.6 11.7
22  20:45 31.2 11.1
23  20:45 31.0 11.6
24  20:00 31.5 10.9
25  20:45 31.0 10.9
26  21:00 30.8 12.3
27  20:30 30.7 12.5
28  20:45 31.1 11.7
29  21:00 31.2 11.3
30  21:20 30.6 11.5
31
Submitted monthly to: Inst. Ocean Science, P.O. Box 6000, Sidney, B.C. V8L 4B2
Recorded by Race Rocks Ecological Reserve Guardian for Lester B. Pearson College

Meeting with Peter Chandler : Exchange of instrument for Seawater sampling datas

Weather

Wind: At 5H00 coming from West 5 knots. Will be 15 to 25 knots late afternoon                  Sky: Cloudy; Visibility :!0 miles;Sea:calm and flat. After a pretty good day the sky clouded over and rains lashed against the windows

Ecological

For the first time this year the eagles were steady around the Rocks today .We saw them 3 times and 2 at the same time once.So the gulls were pretty excited and maybe also because of the stormy and heavy weather. Yesterday for the census there were not so many pigeons-guillemots but today I could count at least 50 of them.Same thing for gulls Guy counted 120 gulls on North Rock in the evening

So we went to meet Peter Chandler from UVIC for an exchange of the instrument. We got exactly the same instrument but they need to be recalibrate once a year. Lately Peter found that the salinity record that we took were too high ( Probably because of the instrument).

He explained us that an important factor is if there is not enough wind for a season the water become saltier and the salt concentration stays on the surface.

Also actually the weather cycles are still there but we can’t predict them like we used to do it 40 years ago.

We spoke also about the amount of fish in an area :he explained that the phytoplankton grows better in the colder water so the fish follow .We could think because of the warming of the ocean that salmons have disappeared like in 1974 in the South of Vancouver Island but in fact they mainly have changed their migration path to get food and all the species  that get fed on them did too.

Race Rocks station is very important because of its unique situation not in a bay but in the open ocean with a lot of currents all the time . The datas we got (and have been for so many years) are really useful. They give informations that don’t concern a specific area only.