| Day | Time | Temp ºC | Salinity ppt |
| 1 | 13:30 | 11.1 | 30.8 |
| 2 | 14:15 | 10.7 | 31.3 |
| 3 | 14:30 | 10.5 | 30.5 |
| 4 | 15:00 | 10.1 | 31.8 |
| 5 | 15:40 | 10.4 | 31.8 |
| 6 | 16:50 | 11.6 | 31.1 |
| 7 | 17:00 | 11.2 | 31.3 |
| 8 | 17:55 | 11.1 | 31.5 |
| 9 | 18:30 | 11.5 | 31.3 |
| 10 | 18:45 | 11.7 | 30.9 |
| 11 | 20:00 | 11.6 | 31.4 |
| 12 | 8:30 | 11.8 | 31.1 |
| 13 | 9:45 | 12.2 | 29.6 |
| 14 | 10:15 | 12.5 | 29.2 |
| 15 | 12:00 | 12.5 | 29.6 |
| 16 | 11:35 | 12.5 | 29.5 |
| 17 | 12:14 | 11.3 | 30.6 |
| 18 | 12:53 | 10.8 | 31.2 |
| 19 | 13:37 | 10.9 | 31.3 |
| 20 | 14:29 | 10.6 | 31.6 |
| 21 | 15:34 | 10.3 | 31.8 |
| 22 | 16:14 | 10.6 | 31.8 |
| 23 | 17:02 | 10.5 | 31.9 |
| 24 | 18:34 | 11.1 | 31.6 |
| 25 | 6:56 | 10.2 | 31.8 |
| 26 | 7:41 | 9.9 | 32.0 |
| 27 | 9:20 | 10.8 | 31.4 |
| 28 | 10:42 | 10.6 | 31.7 |
| 29 | 11:40 | 10.9 | 31.2 |
| 30 | 12:30 | 10.9 | 31.3 |
| 31 | 13:04 | 11.0 | 31.3 |
Tag Archives: salinity
Seawater Data: Temperature and Salinity July 2020
Also available from DFO here, along with data from other sites on the West Coast.
July -2020:
| Date | Salinity ppt. | deg C | LAT. | LONG. |
| 2020-07-01 | 30.6 | 11.2 | 48.2979 | -123.5316 |
| 2020-07-02 | 30.8 | 10.9 | 48.2979 | -123.5316 |
| 2020-07-03 | 31.1 | 10.6 | 48.2979 | -123.5316 |
| 2020-07-04 | 31.3 | 10.4 | 48.2979 | -123.5316 |
| 2020-07-05 | 31 | 10.2 | 48.2979 | -123.5316 |
| 2020-07-06 | 30.7 | 10 | 48.2979 | -123.5316 |
| 2020-07-07 | 31.6 | 10.6 | 48.2979 | -123.5316 |
| 2020-07-08 | 31.6 | 10.4 | 48.2979 | -123.5316 |
| 2020-07-09 | 31.7 | 10.2 | 48.2979 | -123.5316 |
| 2020-07-10 | 31.7 | 10.1 | 48.2979 | -123.5316 |
| 2020-07-11 | 31.5 | 10.5 | 48.2979 | -123.5316 |
| 2020-07-12 | 31.5 | 10.8 | 48.2979 | -123.5316 |
| 2020-07-13 | 31.5 | 10.6 | 48.2979 | -123.5316 |
| 2020-07-14 | 30.9 | 11.6 | 48.2979 | -123.5316 |
| 2020-07-15 | 31 | 11.6 | 48.2979 | -123.5316 |
| 2020-07-16 | 30.8 | 11.8 | 48.2979 | -123.5316 |
| 2020-07-17 | 30.9 | 12 | 48.2979 | -123.5316 |
| 2020-07-18 | 31.8 | 11.7 | 48.2979 | -123.5316 |
| 2020-07-19 | 30.1 | 11.2 | 48.2979 | -123.5316 |
| 2020-07-20 | 29.9 | 10.7 | 48.2979 | -123.5316 |
| 2020-07-21 | 30.1 | 12.1 | 48.2979 | -123.5316 |
| 2020-07-22 | 30 | 11.8 | 48.2979 | -123.5316 |
| 2020-07-23 | 30.4 | 11.5 | 48.2979 | -123.5316 |
| 2020-07-24 | 31 | 11.3 | 48.2979 | -123.5316 |
| 2020-07-25 | 31.1 | 11.1 | 48.2979 | -123.5316 |
| 2020-07-26 | 31.8 | 12 | 48.2979 | -123.5316 |
| 2020-07-27 | 30.4 | 10.8 | 48.2979 | -123.5316 |
| 2020-07-28 | 31 | 11.8 | 48.2979 | -123.5316 |
| 2020-07-29 | 30.6 | 11.5 | 48.2979 | -123.5316 |
| 2020-07-30 | 30.6 | 11.3 | 48.2979 | -123.5316 |
| 2020-07-31 | 30.8 | 11.3 | 48.2979 | -123.5316 |
Seawater data, June 2020
Also available from DFO here, along with data from other sites on the West Coast.
June -2020:
| Date | Salinity ppt. | deg C | LAT. | LONG. |
| 2020-06-01 | 31.5 | 10.4 | 48.2979 | -123.5316 |
| 2020-06-02 | 31.4 | 10.2 | 48.2979 | -123.5316 |
| 2020-06-03 | 31.5 | 10.5 | 48.2979 | -123.5316 |
| 2020-06-04 | 32 | 9.8 | 48.2979 | -123.5316 |
| 2020-06-05 | 31.7 | 10 | 48.2979 | -123.5316 |
| 2020-06-06 | 31.7 | 9.8 | 48.2979 | -123.5316 |
| 2020-06-07 | 32.1 | 9.6 | 48.2979 | -123.5316 |
| 2020-06-08 | 32.1 | 9.8 | 48.2979 | -123.5316 |
| 2020-06-09 | 31.9 | 9.9 | 48.2979 | -123.5316 |
| 2020-06-10 | 31.4 | 10.7 | 48.2979 | -123.5316 |
| 2020-06-11 | 31.6 | 10 | 48.2979 | -123.5316 |
| 2020-06-12 | 31.5 | 10.2 | 48.2979 | -123.5316 |
| 2020-06-13 | 31.3 | 10.6 | 48.2979 | -123.5316 |
| 2020-06-14 | 31.3 | 10.5 | 48.2979 | -123.5316 |
| 2020-06-15 | 31.2 | 10.5 | 48.2979 | -123.5316 |
| 2020-06-16 | 31.2 | 10.8 | 48.2979 | -123.5316 |
| 2020-06-17 | 31 | 11.3 | 48.2979 | -123.5316 |
| 2020-06-18 | 31.2 | 10.8 | 48.2979 | -123.5316 |
| 2020-06-19 | 31.6 | 10.4 | 48.2979 | -123.5316 |
| 2020-06-20 | 31.7 | 10.1 | 48.2979 | -123.5316 |
| 2020-06-21 | 31.9 | 9.9 | 48.2979 | -123.5316 |
| 2020-06-22 | 31.8 | 10.2 | 48.2979 | -123.5316 |
| 2020-06-23 | 31.9 | 10.2 | 48.2979 | -123.5316 |
| 2020-06-24 | 31.8 | 10.1 | 48.2979 | -123.5316 |
| 2020-06-25 | 31.9 | 10.1 | 48.2979 | -123.5316 |
| 2020-06-26 | 31.7 | 10.2 | 48.2979 | -123.5316 |
| 2020-06-27 | 31.5 | 10.4 | 48.2979 | -123.5316 |
| 2020-06-28 | 31.4 | 10.6 | 48.2979 | -123.5316 |
| 2020-06-29 | 31.9 | 10.4 | 48.2979 | -123.5316 |
| 2020-06-30 | 31.6 | 10.6 | 48.2979 | -123.5316 |
Seawater Data, Temperature and Salinity May 2020
Also available from DFO here, along with data from other sites on the West Coast.
May -2020:
| Date | Salinity ppt. | deg C | LAT. | LONG. |
| 2020-05-01 | 32 | 9.1 | 48.2979 | -123.5316 |
| 2020-05-02 | 31.9 | 9.1 | 48.2979 | -123.5316 |
| 2020-05-03 | 31.8 | 9.1 | 48.2979 | -123.5316 |
| 2020-05-04 | 32.2 | 8.8 | 48.2979 | -123.5316 |
| 2020-05-05 | 32.2 | 9.3 | 48.2979 | -123.5316 |
| 2020-05-06 | 32.2 | 9.4 | 48.2979 | -123.5316 |
| 2020-05-07 | 32.4 | 9.4 | 48.2979 | -123.5316 |
| 2020-05-08 | 32.3 | 9.2 | 48.2979 | -123.5316 |
| 2020-05-09 | 32.4 | 9.4 | 48.2979 | -123.5316 |
| 2020-05-10 | 32.3 | 9.8 | 48.2979 | -123.5316 |
| 2020-05-11 | 31.9 | 9.6 | 48.2979 | -123.5316 |
| 2020-05-12 | 31.7 | 10 | 48.2979 | -123.5316 |
| 2020-05-13 | 31.7 | 9.7 | 48.2979 | -123.5316 |
| 2020-05-14 | 31.6 | 9.9 | 48.2979 | -123.5316 |
| 2020-05-15 | 31.4 | 10 | 48.2979 | -123.5316 |
| 2020-05-16 | 31.4 | 9.9 | 48.2979 | -123.5316 |
| 2020-05-17 | 31.2 | 10.1 | 48.2979 | -123.5316 |
| 2020-05-18 | 31.3 | 10.4 | 48.2979 | -123.5316 |
| 2020-05-19 | 31.4 | 10.2 | 48.2979 | -123.5316 |
| 2020-05-20 | 31.3 | 10.1 | 48.2979 | -123.5316 |
| 2020-05-21 | 31.7 | 9.8 | 48.2979 | -123.5316 |
| 2020-05-22 | 31.3 | 10 | 48.2979 | -123.5316 |
| 2020-05-23 | 31.4 | 10.6 | 48.2979 | -123.5316 |
| 2020-05-24 | 31.8 | 10.2 | 48.2979 | -123.5316 |
| 2020-05-25 | 31.3 | 10.3 | 48.2979 | -123.5316 |
| 2020-05-26 | 31.1 | 10.5 | 48.2979 | -123.5316 |
| 2020-05-27 | 31 | 10.6 | 48.2979 | -123.5316 |
| 2020-05-28 | 31.6 | 10.1 | 48.2979 | -123.5316 |
| 2020-05-29 | 31.4 | 10.2 | 48.2979 | -123.5316 |
| 2020-05-30 | 31.3 | 10 | 48.2979 | -123.5316 |
| 2020-05-31 | 31.5 | 10 | 48.2979 | -123.5316 |
Seawater Data April 2020
Also available from DFO here, along with data from other sites on the West Coast.
April -2020:
| Date | Salinity ppt. | deg C | LAT. | LONG. |
| 2020-04-01 | 31.8 | 7.7 | 48.2979 | -123.5316 |
| 2020-04-02 | 31.7 | 7.8 | 48.2979 | -123.5316 |
| 2020-04-03 | 31.9 | 7.7 | 48.2979 | -123.5316 |
| 2020-04-04 | 32 | 7.7 | 48.2979 | -123.5316 |
| 2020-04-05 | 31.7 | 8 | 48.2979 | -123.5316 |
| 2020-04-06 | 32 | 8.3 | 48.2979 | -123.5316 |
| 2020-04-07 | 32.6 | 8 | 48.2979 | -123.5316 |
| 2020-04-08 | 32.3 | 8.5 | 48.2979 | -123.5316 |
| 2020-04-09 | 32.2 | 8.3 | 48.2979 | -123.5316 |
| 2020-04-10 | 32.3 | 8.3 | 48.2979 | -123.5316 |
| 2020-04-11 | 32.2 | 8.3 | 48.2979 | -123.5316 |
| 2020-04-12 | 32 | 8.4 | 48.2979 | -123.5316 |
| 2020-04-13 | 32 | 8.3 | 48.2979 | -123.5316 |
| 2020-04-14 | 31.7 | 8.3 | 48.2979 | -123.5316 |
| 2020-04-15 | 31.5 | 9.2 | 48.2979 | -123.5316 |
| 2020-04-16 | 31.4 | 8.9 | 48.2979 | -123.5316 |
| 2020-04-17 | 31.5 | 8.8 | 48.2979 | -123.5316 |
| 2020-04-18 | 31.4 | 8.9 | 48.2979 | -123.5316 |
| 2020-04-19 | 31.6 | 9.1 | 48.2979 | -123.5316 |
| 2020-04-20 | 31.7 | 9 | 48.2979 | -123.5316 |
| 2020-04-21 | 31.7 | 9.1 | 48.2979 | -123.5316 |
| 2020-04-22 | 31.7 | 8.8 | 48.2979 | -123.5316 |
| 2020-04-23 | 31.8 | 9.1 | 48.2979 | -123.5316 |
| 2020-04-24 | 31.9 | 9 | 48.2979 | -123.5316 |
| 2020-04-25 | 31.8 | 9.3 | 48.2979 | -123.5316 |
| 2020-04-26 | 32.2 | 9.1 | 48.2979 | -123.5316 |
| 2020-04-27 | 32.1 | 9.1 | 48.2979 | -123.5316 |
| 2020-04-28 | 32.3 | 8.8 | 48.2979 | -123.5316 |
| 2020-04-29 | 32.1 | 8.9 | 48.2979 | -123.5316 |
| 2020-04-30 | 32.2 | 9.2 | 48.2979 | -123.5316 |
Seawater Salinity and Temperature Observations for March
| Day | Time | Temp. ºC | Salinity ppt |
| 1 | 8:24 | 7.7 | 31.7 |
| 2 | 8:55 | 7.8 | 31.6 |
| 3 | 7:14 | 7.8 | 31.4 |
| 4 | 6:53 | 7.7 | 31.6 |
| 5 | 7:59 | 7.8 | 31.4 |
| 6 | 9:15 | 7.8 | 31.5 |
| 7 | 10:32 | 7.9 | 31.5 |
| 8 | 11:12 | 7.9 | 31.7 |
| 9 | 14:00 | 7.8 | 32.4 |
| 10 | 15:47 | 7.9 | 32.0 |
| 11 | 16:53 | 7.9 | 32.8 |
| 12 | 17:06 | 7.9 | 32.6 |
| 13 | 19:33 | 7.7 | 32.2 |
| 14 | |||
| 15 | |||
| 16 | 7:18 | 7.3 | 31.6 |
| 17 | 8:14 | 7.4 | 31.5 |
| 18 | 7:55 | 7.5 | 31.5 |
| 19 | 9:10 | 7.7 | 31.4 |
| 20 | 10:49 | 7.8 | 31.6 |
| 21 | 13:02 | 8.0 | 31.7 |
| 22 | 16:19 | 8.1 | 31.6 |
| 23 | 14:56 | 7.9 | 31.9 |
| 24 | 15:44 | 7.9 | 31.9 |
| 25 | 16:31 | 8.0 | 31.8 |
| 26 | 17:23 | 7.9 | 31.8 |
| 27 | 18:25 | 8.0 | 31.8 |
| 28 | 8:16 | 7.9 | 31.7 |
| 29 | 8:10 | 7.9 | 31.5 |
| 30 | 6:35 | 7.8 | 31.8 |
| 31 | 6:44 | 7.7 | 31.7 |
February Daily Sea Surface Temperature and Salinity Observations
Day Time Temp ºC Salinity ppt
1 8:03 8.1 31.3
2 8:21 7.7 31.4
3 8:37 7.7 31.2
4 8:49 7.6 30.9
5 9:06 7.8 31.1
6 10:08 7.9 31.2
7 10:37 7.9 31.0
8 11:34 8.1 31.1
9 12:35 8.1 31.1
10 13:58 8.2 31.3
11 15:16 8.2 31.2
12 16:59 8.1 31.5
13 17:45 8.0 31.6
14 7:57 7.9 32.0
15 8:15 7.9 31.4
16 7:49 7.9 31.5
17 8:16 7.8 31.5
18 8:37 7.7 31.3
19 9:12 7.8 31.3
20 10:03 7.8 31.2
21 11:47 7.9 31.1
22 12:04 8.0 31.2
23 13:21 7.9 31.6
24 14:15 7.9 32.0
25 15:03 7.9 31.9
26 16:22 8.1 31.8
27 16:44 8.0 31.5
28 17:49 7.9 31.3
29 7:27 7.8 31.7
Seawater Observations for January
| Day | Time | Temp ºC | Salinity ppt |
| 1 | 9:15 | 8.3 | 32.3 |
| 2 | 9:18 | 8.2 | 32.1 |
| 3 | 9:39 | 8.3 | 32.0 |
| 4 | 9:43 | 8.1 | 32.0 |
| 5 | 10:00 | 8.2 | 31.8 |
| 6 | 10:16 | 8.2 | 31.7 |
| 7 | 10:27 | 8.3 | 31.6 |
| 8 | 10:31 | 8.2 | 31.9 |
| 9 | 10:57 | 8.2 | 31.9 |
| 10 | 14:44 | 8.2 | 31.4 |
| 11 | 12:28 | 8.2 | 31.9 |
| 12 | |||
| 13 | 14:24 | 7.7 | 31.9 |
| 14 | 14:42 | 7.6 | 31.9 |
| 15 | |||
| 16 | 8:13 | 7.6 | 32.1 |
| 17 | 8:33 | 7.5 | 32.1 |
| 18 | 8:55 | 7.9 | 32.0 |
| 19 | 10:33 | 7.9 | 31.7 |
| 20 | 9:55 | 8.0 | 31.6 |
| 21 | 10:13 | 8.0 | 31.5 |
| 22 | 10:30 | 7.9 | 31.5 |
| 23 | 11:02 | 8.0 | 31.6 |
| 24 | 12:18 | 8.1 | 31.7 |
| 25 | 12:24 | 8.1 | 31.7 |
| 26 | 13:03 | 8.2 | 31.6 |
| 27 | 13:46 | 8.1 | 31.6 |
| 28 | 14:26 | 8.1 | 31.5 |
| 29 | 15:10 | 8.2 | 31.5 |
| 30 | 16:11 | 8.0 | 31.5 |
| 31 | 8:20 | 8.1 | 31.5 |
*The observations are missing from January 12 and 15 because the wind and large waves prevented me from safely accessing the jetty.
We Have a Weaner
Wind: yesterday and today 5-25 knots between E and N
Sea State: yesterday and today rippled with afternoon NE swells of up to 1 m
Visibility: yesterday 10-15 NM, today 3-10 NM
Sky: both days mostly cloudy with periods of rain
Temperature: both days 7-10 °C
Atmospheric CO2: 414.07 ppm (recorded by NOAA at Mauna Loa Observatory, Hawaii)
On Tuesday night, the first elephant seal mother left the island, leaving her 24 day old pup to fend for itself. The mother had the tail flipper tag T562. The pup is still hanging out with the harem on the lawn.
The island is running on reduced power due to an issue with the generator, which is in the process of being fixed.
Four eco tour boats were in the reserve over the past two days. There were no human visitors on the island.
See the photos below for a few sights from the past two days:
-
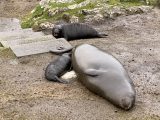
- The second pup and mother lying with some spilled milk in between them. The first pup, now a weaner, is in the background.
-
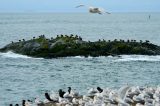
- 38 bald eagles gather yesterday morning on the south rocks. Near the upper right corner of the photo is the buoy that marks Rosedale Reef.
-

- A wet juvenile bald eagle on the path
-
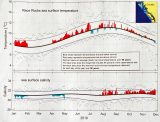
- DFO (Department of Fisheries and Oceans) mailed a paper copy of these graphs with the results of last year’s daily sea surface temperature and salinity observations.
December Seawater Observations
Day Time Temp ºC Sal ppt
1 8:00 8.3 32.0
2 8:00 8.3 32.1
3 8:00 8.5 32.0
4 8:00 8.4 31.9
5 8:15 8.5 32.0
6 9:15 8.4 32.0
7 10:00 8.4 31.9
8 11:30 8.3 31.9
9 11:30 8.4 32.0
10 12:00 8.4 32.0
11 12:30 8.5 32.1
12 13:00 8.4 31.9
13 14:00 8.4 32.1
14 14:30 8.4 32.1
15 15:00 8.3 32.2
16 15:30 8.2 32.2
17 15:45 8.3 32.1
18 8:00 8.2 32.2
19 8:00 8.2 32.1
20 9:00 8.3 32.2
21 9:00 8.2 32.2
22 10:05 8.3 32.2
23 11:03 8.3 32.0
24 11:48 8.3 32.2
25 12:10 8.2 32.1
26 12:00 8.2 32.2
27 12:27 8.3 32.2
28 13:20 8.3 32.1
29 13:36 8.3 31.9
30 9:19 8.3 32.0
31 9:22 8.3 31.9