Temperature Changes Through Time


BACKGROUND: With so much information in the media about Climate Change, it is important to be able to sort out and analyze the evidence first hand. From 1921 until the present, records of temperature of the sea water have been taken daily at Race Rocks. The question is, do we have evidence of an increase in ocean temperature over this time period?
OBJECTIVES: After doing this assignments, you will be able to:
a) Comment on the importance of maintaining a database of environmental factors over time.b) Compare the monthly temperature averages for the decade of the 1920’s with the last decade c) Examine data temperature records and determine if there is evidence of a change through time..d) Evaluate temperature change through time as an abiotic factor that affects the biodiversity of organisms in an ecosystem.e) Account for the geoclimatic reasons for similarities and differences of water temperatures, and indicate the implications for organisms living in these ecosystems.

PROCEDURE: 1. Describe how this set of sea-water temperature records have been obtained. This file provides examples of the records which have been submitted to The Institute of Ocean Sciences at Sidney, Vancouver Island.

The students from Lester Pearson College often stay at the island and take over the daily duties such as the water sampling for temperature and salinity. This video shows the process used in the manual determination of these factors.

When the records have been submitted, they are added to a database which is maintained by the Institute of Ocean Sciences. This link shows historic sets of raw data from IOS for the British Columbia Light Stations.
 Seawater temperature and salinity observations in the past few years:
See

2. Go to this file to obtain the Race Rocks Mean Monthly Sea Temperature 1921-present,a) open an excel workbook and save it as “Temperature records at Race Rocks. We will copy the data for the first ten years of the record and the last ten years of the record to an empty Excel file.

b) Highlight years 1921 to 1930 from the data, copy and paste to the open Excel file.

c) Cut out each year and paste it side by side so that you have the rows representing the months and the columns representing the years. Make a horizontal table of the data

d) highlight across the able, the temperatures for each month of the ten year group. Then click on the symbol in the menu line which produces an average. This average will appear to the right of the last years column.

e) Do the same with the last ten years set of data. You now have two sets of averages by month of the two decades.

f) Compare the monthly averages for the two decades. What do you find?

3. There are of course many ways of looking at this data. Try summing the total averages for each decade. Simply highlight the column of averages and click on the tool for SUM. What is your finding.4. You could also do the same for all the decades.Once you have a chart made up of the monthly averages of all the decades, It is easy to have Excel draw a graph for you. Click on the Wizard symbol and choose the type of graph.

5. After manipulating the data, and looking at it in several ways, write a statement which expresses your understanding of the whether or not there has been a temperature change in the Strait of Juan de Fuca as measured by daily samples taken at Race Rocks. Be sure that you do not generalize beyond the evidence provided by your data. Also discuss the assumptions that you must recognize before drawing a conclusion from this data.

6. For Extension work: Run a statistical program to determine if the difference you find is significant.

7. For Extension work: Read the review below and if possible, read the book! Present a summary to your class. The long-term Sea temperature record at Race Rocks has been pointed out as one of the pieces of evidence that has accumulated on global warming. Author Terry Glavin, in reviewing the book The Weather Makers by Tim Flannery ( Harper Collins Publishers, 2006) says :

” The Pacific Ocean itself is getting warmer. Measurements at the Race Rocks lighthouse near Victoria show an average rise in temperature of 1°C since 1921, which doesn’t sound like much until you remember that its only 10°C in the other direction that separates us from the deep freeze of the Ice Age. The ocean, absorbing increasing volumes of carbon dioxide, is becoming more acidic, too, inhibiting the production of plankton, the basis of all life in the sea.”

The rest of the article may be seen at http://www.straight.com/content.cfm?id=17132

8. Refer to the file: Sea Temperature as an abiotic factor . Several ideas are discussed in this file about how the sea water temperature affects marine organisms. Discuss how organisms adapt to changes in sea temperature.
9. Extension: Find out the monthly water temperature averages from your own area. Compare them with Race Rocks and discuss the geoclimatic factors which lead to the similarities and or the differences, and the implications for organisms living in the two ecosystems.

See also https://racerocks.ca/category/education/climate-change/

Sea Water Temperatures at Race Rocks

From
1921 until 1997 daily records of Seawater Temperature and
Salinity were manually taken at Race Rocks by the Lightkeepers and assistants. In 1997 the station was automated and Lester Pearson College took over the hiring of the Lightkeeper Mike Slater and his wife Carol as Guardians for the Ecological Reserve / Marine Protected Area. They  maintained the daily sea temp and salinity records until their retirement in 2009. The records have been submitted monthly to the Institute of Ocean Sciences, thus continuing this important long term record.

See the Decade Comparisons:Sea Surface Temperature at Race Rocks- 1921-1930 and 1995-2005


The students from Lester Pearson College often stayed at the island and took over the daily duties such as the water sampling for temperature and salinity. The following is their introduction to the video:During our project week at Race Rocks, Mike Slater, the Race Rocks Marine Protected Area Guardian asked us if we could make a video explaining the daily duties necessary to maintain the facility. Students who are relieving on the island during Mike’s absence will be able to use this data as a guide for performing their duties, as well as providing a useful information resource for students visiting the island. These duties include two daily engine checks, a salinity check one hour before high tide, and keeping a record of the days weather, as well as explaining the functions and instructions for testing machinery located on the island.


Garry gives a good demonstration of when one should avoid taking seawater temperatures!~ (Photo by Barry Herring Feb 2009)


SEA TEMPERATURE 1921 to 2008

Also
see historic sets of raw data from IOS for the British
Columbia Light Stations

http://www.pac.dfo-mpo.gc.ca/science/oceans/data-donnees/lighthouses-phares/data/racerockday.txt

Observations of Seawater Temperature and Salinity at British Columbia Shore Stations, 1983. F. Glovando 1985

Refer
to the File “Temperature Changes Through Time for an
Educational exercise on Sea water Temperature changes.


OCEAN
WARMING:
The
long-term Sea temperature record at Race Rocks has
been pointed out as one of the pieces of evidence that has
accumulated on global warming. Terry Glavin, in reviewing
the book The Weather Makers by Tim
Flannery
( Harper Collins Publishers, 2006) says
:

The Pacific Ocean itself is getting warmer.
Measurements at the Race Rocks lighthouse near
Victoria show an average rise in temperature of 1°C
since 1921, which doesn’t sound like much until you
remember that its only 10°C in the other direction
that separates us from the deep freeze of the Ice Age.
The ocean, absorbing increasing volumes of carbon
dioxide, is becoming more acidic too, inhibiting the
production of plankton, the basis of all life in the
sea.”
The
rest of the article may be seen at
http://www.straight.com/content.cfm?id=17132
See this file for our own analysis which supports this statement:

page 21
State
of the Pacific Ocean 2005
context.http://www.pac.dfo-mpo.gc.ca/sci/psarc/OSRs/StateofOceans2005fnl.pdf
Two
references are made to Race Rocks Sea Temperature
data. page 6 and page 31
State
of the Pacific Ocean , 2006

state of the pacific ocean 2006,
page 36 ” Ocean
Temperatures along the west coast of Vancouver island
declined to below average conditions in the latter half
of 2006. The waters of race Rocks …did not follow this
pattern, and remained above average all year.”
RESPONSE
OF ORGANISMS TO SEAWATER TEMPERATURES:
The
seawater in the Strait of Juan de Fuca has a very narrow
variation in temperature range. It is important to
understand about Heat Capacity, as it is partly due to
this ability of water to warm up slowly and cool off
slowly that the climate of Vancouver Island and the lower
mainland of British Columbia has the mildest weather in
Canada.
Heat
capacity is the ratio of the heat energy absorbed to the
rise in temperature. Objects with high heat capacity, such
as water, require a great amount of heat energy to change
temperature. Materials with low heat capacities, such as
air, easily change temperature with small amounts of heat
energy.

These
photos are from the California sea lion page. They demonstrate one of the forms of heat exchange used by the sea lions atRace Rocks. Their flippers are filled with blood vessels, so this behaviour allows heat exchange with the atmosphere.

Heat
Capacity is also sensitive to the size of the object
(for example, a bathtub of water has more heat capacity
than a cup of water). Therefore we can expect the
greatest variation in temperatures to occur at Race
Rocks in the tidepools.

This file shows one example of measurements taken on
tidepools. It illustrates this idea of size of the object and it also helps explain why our tidepools
have different biodiversity depending on the temperature variations of the pools.

Other ideas to be developed here:
1.Temperature stratification in tidepools and
distribution of organisms.

2.
Temperature stratification in the ocean. The importance
of the thermocline in determining marine-life zones.

3.
The relationship of temperature of water to its ability
to absorb the gases oxygen and carbon dioxide. (An
inverse relationship which has significant implications
for where organisms can live.)

4.
Birds and mammals have adaptation for cold temperatures,
e.g. Insulation, activity levels and counter-current
arterial circulation


Dr.
Kate Edwards of the University of Washington School of
Oceanography is doing research on the sea temperatures
of the Strait of Juan de Fuca. (click on image to left).
She maintains web pages at:
Strait of Juan de Fuca page:
http://www.ocean.washington.edu/~kate
West Coast headlands page:
http://www-ccs.ucsd.edu/~kate
Jan Newton is at the Washington state Department of Ecology and is interested in how the Straits affect Puget Sound.
She has organized the “Joint Effort to Monitor the
Straits,” which regularly sample the three stations south
of San Juan Island in the map at http://www.ecy.wa.gov/apps/eap/marinewq/mwdataset.asp
.

Click on the Station Group Puget Sound, and the Selected
Station – Juan de Fuca.

This
paper references Strait of Juan de Fuca Temperatures


Educational Exercises Using Data From Race Rocks – Excel and
Statistics

Salinity as an Abiotic Factor

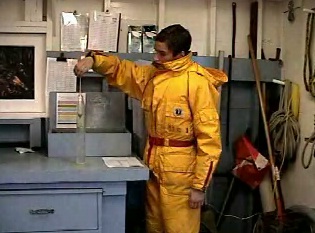
Jeremias tests the salinity using a hydrometer. This manual method has been used at Race Rocks from 1935 until more recent years when a digital salinometer has been used.


For monthly records of Salinity refer to :

https://www.racerocks.ca/?s=Salinity&submit=Search


“During our project week at Race Rocks, Mike Slater, the Race Rocks Marine Protected Area Guardian asked us if we could make a video explaining the daily duties necessary to maintain the facility. Students who are relieving on the island during Mike’s absence will be able to use this data as a guide for performing their duties, as well as providing a useful information resource for students visiting the island.

These duties include two daily engine checks, a salinity check one hour before high tide, and keeping a record of the days weather, as well as explaining the functions and instructions for testing machinery located on the island.”

ABIOTIC EFFECTS OF SALINITY ON ORGANISMS

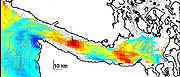
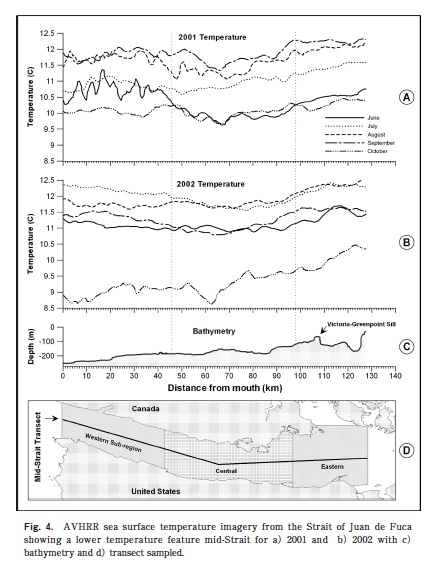
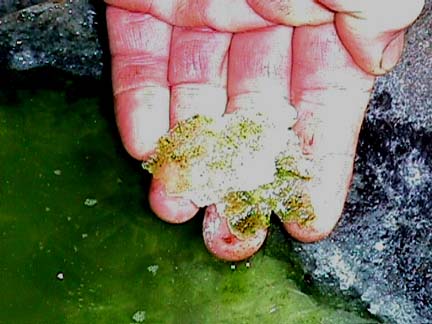
Organisms which live in Tidepools have to withstand changing salinities which may range from 0 parts per thousand to over 100 parts per thousand. Here is an example of an algae that in the summer lives in concentrated brine of the evaporated tidepool number 7.


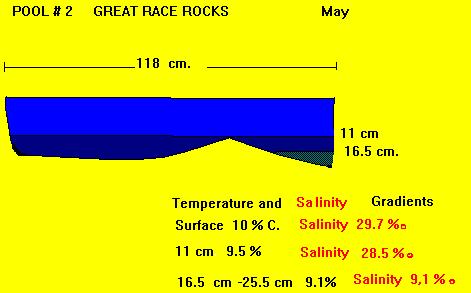
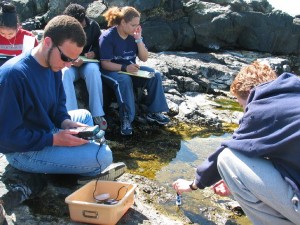
Rob measures salinity with the salinometer in tidepool Number 4..This file shows the results that one class in environmental systems got when measuring the salinities of tidepools. Note there can be quite a variation in both temperature and salinity, depending on the elevation of the pool and therefore the frequency of flooding from the ocean.

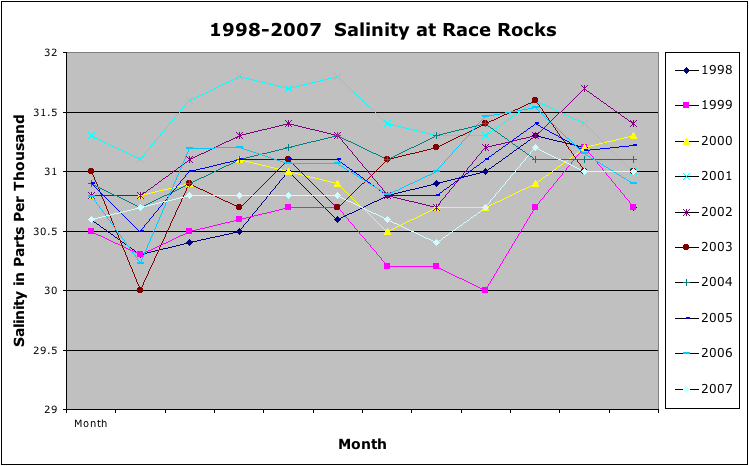
Mean Monthly Sea Surface Salinity at Race Rocks-1936 to present .

Two decades of mean monthly Salinity records are compared in the following investigation.

Salinity Comparisons for 2 Decades
There are a number of interesting features of the two decades almost 50 years apart.

Some open-ended questions that you may wish to pursue:

  1. How do the individual months compare?
  2. Is there any evidence of a trend that distinguishes the earlier decade from the most recent one?
  3. Is there any evidence of a trend that distinguishes one period of the year from another?
  4. What could be the cause of any observable trends?
  5. Does geographic location of Race Rocks provide an answer to any findings?
  6. See the work done on comparing sea temperature from two decades for some other ideas.
  7. What would the graphs look like if you took the means of each month from the two decades and plotted them ?

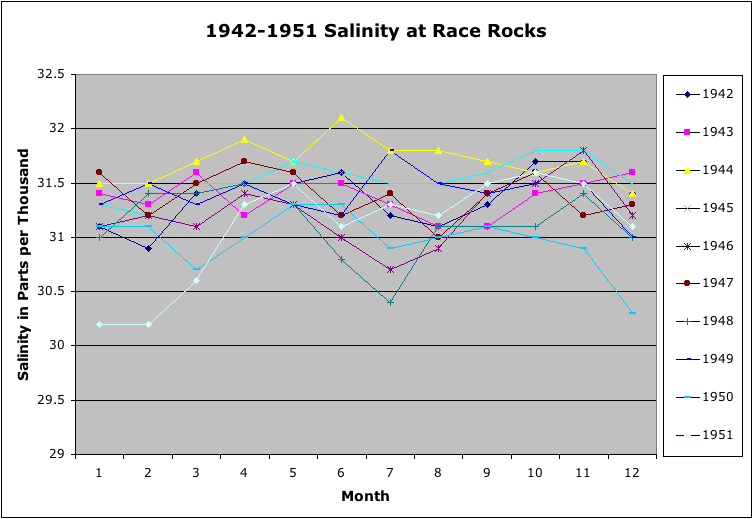
You may also see the the raw data used to make the graphs in the two tables below. It may be useful in this format to clip and paste into an EXCEL workbook for further analysis. If you come up with any other interesting analysis of the data from this exercise or from looking at the complete data archive. We would be interested in carrying it attached to this page.

Raw Data 1942 1943 1944 1945 1946 1947 1948 1949 1950 1951
Jan. 31.1 31.4 31.5 31.3 31.1 31.6 31 31.3 31.1 30.2
Feb. 30.9 31.3 31.5 31.2 31.2 31.2 31.4 31.5 31.1 30.2
Mar. 31.4 31.6 31.7 31.5 31.1 31.5 31.4 31.3 30.7 30.6
Apr. 31.5 31.2 31.9 31.5 31.4 31.7 31.5 31.5 31 31.3
May 31.5 31.5 31.7 31.7 31.3 31.6 31.3 31.3 31.3 31.5
June 31.6 31.5 32.1 31.6 31 31.2 30.8 31.2 31.3 31.1
July 31.2 31.3 31.8 31.5 30.7 31.4 30.4 31.8 30.9 31.3
Aug. 31.1 31.1 31.8 31.5 30.9 31 31.1 31.5 31 31.2
Sept. 31.3 31.1 31.7 31.6 31.4 31.4 31.1 31.4 31.1 31.5
Oct. 31.7 31.4 31.6 31.8 31.5 31.6 31.1 31.5 31 31.6
Nov 31.7 31.5 31.7 31.8 31.8 31.2 31.4 31.5 30.9 31.5
Dec 31.4 31.6 31.4 31.5 31.2 31.3 31 31 30.3 31.1
1998 1999 2000 2001 2002 2003 2004 2005 2006 2007
Jan. 30.6 30.5 30.8 31.3 30.8 31 30.9 30.9 30.79 30.6
Feb. 30.3 30.3 30.8 31.1 30.8 30 30.7 30.5 30.23 30.7
Mar. 30.4 30.5 30.9 31.6 31.1 30.9 30.9 31 31.19 30.8
Apr. 30.5 30.6 31.1 31.8 31.3 30.7 31.1 31.1 31.2 30.8
May 31 30.7 31 31.7 31.4 31.1 31.2 31.1 31.07 30.8
June 30.6 30.7 30.9 31.8 31.3 30.7 31.3 31.1 31.07 30.8
July 30.8 30.2 30.5 31.4 30.8 31.1 31.1 30.8 30.81 30.6
Aug. 30.9 30.2 30.7 31.3 30.7 31.2 31.3 30.8 31 30.4
Sept. 31 30 30.7 31.3 31.2 31.4 31.4 31.1 31.46 30.7
Oct. 31.3 30.7 30.9 31.6 31.3 31.6 31.1 31.4 31.54 31.2
Nov. 31.2 31.2 31.2 31.4 31.7 31 31.1 31.18 31.15 31
Dec. 30.7 30.7 31.3 31 31.4 31 31.1 31.22 30.9 31

LAB: Using Temperature and Salinity Data for an Excel exercise

Purpose:
To transfer Environmental Data being recorded at Race Rocks from a spread sheet presented on the internet to your own computer in order to be able to graph trends and analyze relationships.
Background:
Long term data bases are very important for a number of reasons. You may wish to write down in your assignment notes some of the applications you could use for such data. Certainly patterns of cyclic activity and even events such as Climate Change can be detected from the Race Rocks Data. Try to come up with a few other applications. We intend to make a complete range of environmental data from data sensors as these get installed.
See this file for the Data Recording IndexSee also IDEAS FOR STATISTCS ASSIGNMENTS
USING EXCEL DATA FROM racerocks.com
 

RACE ROCKS TEMPERATURE AND SALINITY EXERCISE
Since 1921 the Light keepers at Race Rocks have recorded some basic climatic data at Race Rocks. They started by taking daily sea water temperatures and in 1936 added daily salinity measurements to their measurements. The record is fairly complete except for a few years during the second world war, and so far we have not been able to determine why those records were not kept at that time.
1.This is a file with the daily sea temperatures and salinity and atmospheric data since the year 2000, as recorded by Mike Slater:2. We were able to get this complete monthly mean data base for Temperature….1921->present and this complete monthly mean data base…1936-present for Salinity from the Institute of Ocean Sciences.

3. Copy and Paste the data for the years you want to analyse from the web page directly into your blank EXCEL workbook.

4. You now have our original data on your computer and you can proceed to do any one of the many manipulations possible in the EXCEL program. You can also copy and paste in other month’s data in order to get a larger data set .

5. Take the opportunity to creative in the way you look at and interpret data, we would be interested in attaching your findings to this website. Send comments to: Garry Fletcher Just e-mail your analysis as an attachment.

6. You are welcome to use this data for educational purposes, you are just asked to reference the source as:
Lester B. Pearson College, racerocks.com

See this file for other ideas on Statistics from racerocks.com data.